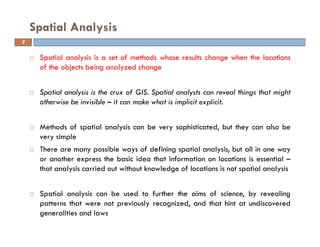
Remote sensing and GIS can be applied in civil engineering for spatial analysis and to answer geographic queries. Spatial analysis examines how the locations of objects impact analysis results and can reveal patterns. GIS uses methods like overlay, proximity, density, and network analysis to study spatial relationships. Common analyses include measuring distances, areas and shapes, transforming datasets, descriptive summaries of data, and optimizing locations.
basic concept of geographic data,GIS and its component,data acquisition ,raster, vector formats,spatial data,topology and data model data output ,GIS applications
Geographical Information System (GIS) Georeferencing and Digitization, Bihar ...Kamlesh Kumar
This work is an effort to share Geographical Information System: Georeferencing, digitization and map making steps through QGIS 2.0.1
Georeferencing
Digitization of Topographical sheet
Point
Line
Area
Bihar Map
District Headquarters
Railway of Bihar
District Boundaries
Thematic Maps (Literacy & Sex Ratio)
This document help you to prepare Triangulation Network (TIN), Hillshade Map, Slope map, interpolation and Digital Elevation Model (DEM) in a area and how to interpret them.
Understanding Coordinate Systems and Projections for ArcGISJohn Schaeffer
Everything you need to know to work with coordinate systems and projecting data in ArcGIS. The presentation starts by explaining the terminology, and then discusses the details you need to know to actually work successfully with coordinate systems, use the proper projections, and geographic transformations. This is a very practical look at a complex subject.
An introduction to GIS Data Types. Strengths and weaknesses of raster and vector data are discussed. Also covered is the importance of topology. Concludes with a discussion of the vector-based format of OpenStreetMap data.
One of most important topics in ArcGIS and GIS, is coordinate system, the slides will cover this topic in order to understand the difference between various coordinate systems.
This presentation is on utm ( universal transverse mercator )
the main content of this presentation are
OVERVIEW OF ZONES AND SUBZONES
FALSE VALUES OF ORIGIN
IDENTIFICATION OF 100*100KM SQ.
REGION AND SUB-REGIONS IDENTIFICATION
SUMMARY of UTM
TYBSC IT PGIS Unit I Chapter II Geographic Information and Spacial DatabaseArti Parab Academics
Geographic Information and Spatial Database Models and Representations of the real world Geographic Phenomena: Defining geographic phenomena, types of geographic phenomena, Geographic fields, Geographic objects, Boundaries Computer Representations of Geographic Information: Regular tessellations, irregular tessellations, Vector representations, Topology and Spatial relationships, Scale and Resolution, Representation of Geographic fields, Representation of Geographic objects Organizing and Managing Spatial Data The Temporal Dimension
In this study various techniques for exploratory spatial data analysis are reviewed : spatial autocorrelation, Moran's I statistic, hot spots analysis, spatial lag and spatial error models.
A hybrid approach for analysis of dynamic changes in spatial dataijdms
Any geographic location undergoes changes over a period of time. These changes can be observed by
naked eye, only if they are huge in number spread over a small area. However, when the changes are small
and spread over a large area, it is very difficult to observe or extract the changes. Presently, there are few
methods available for tackling these types of problems, such as GRID, DBSCAN etc. However, these
existing mechanisms are not adequate for finding an accurate changes or observation which is essential
with respect to most important geometrical changes such as deforestations and land grabbing etc.,. This
paper proposes new mechanism to solve the above problem. In this proposed method, spatial image
changes are compared over a period of time taken by the satellite. Partitioning the satellite image in to
grids, employed in the proposed hybrid method, provides finer details of the image which are responsible
for improving the precision of clustering compared to whole image manipulation, used in DBSCAN, at a
time .The simplicity of DBSCAN explored while processing portioned grid portion.
Object tracking with SURF: ARM-Based platform ImplementationEditor IJCATR
Several algorithms for object tracking, are developed, but our method is slightly different, it’s about how to adapt and implement such algorithms on mobile platform.
We started our work by studying and analyzing feature matching algorithms, to highlight the most appropriate implementation technique for our case.
In this paper, we propose a technique of implementation of the algorithm SURF (Speeded Up Robust Features), for purposes of recognition and object tracking in real time. This is achieved by the realization of an application on a mobile platform such a Raspberry pi, when we can select an image containing the object to be tracked, in the scene captured by the live camera pi. Our algorithm calculates the SURF descriptor for the two images to detect the similarity therebetween, and then matching between similar objects. In the second level, we extend our algorithm to achieve a tracking in real time, all that must respect raspberry pi performances. So, the first thing is setting up all libraries that the raspberry pi need, then adapt the algorithm with card’s performances. This paper presents experimental results on a set of evaluation images as well as images obtained in real time.
Individual movements and geographical data mining. Clustering algorithms for ...Beniamino Murgante
Individual movements and geographical data mining. Clustering algorithms for highlighting hotspots in personal navigation routes.
Giuseppe Borruso, Gabriella Schoier - University of Trieste
Spatial association discovery process using frequent subgraph miningTELKOMNIKA JOURNAL
Spatial associations are one of the most relevant kinds of patterns used by business
intelligence regarding spatial data. Due to the characteristics of this particular type of
information, different approaches have been proposed for spatial association mining.
This wide variety of methods has entailed the need for a process to integrate the activities
for association discovery, one that is easy to implement and flexible enough to
be adapted to any particular situation, particularly for small and medium-size projects
to guide the useful pattern discovery process. Thus, this work proposes an adaptable
knowledge discovery process that uses graph theory to model different spatial relationships
from multiple scenarios, and frequent subgraph mining to discover spatial
associations. A proof of concept is presented using real data.
Enhancing the Design pattern Framework of Robots Object Selection Mechanism -...INFOGAIN PUBLICATION
In order to enable a computer to construct and display a three-dimensional array, solid objects from a single two-dimensional photograph, the rules and assumptions of depth perception have been carefully analyzed and mechanized. It is assumed that a photograph is a perspective projection of a set of objects which can be constructed from transformations of known three-dimensional models, and that the objects are supported by other visible objects or by a ground plane. These assumptions enable a computer to obtain a reasonable, three-dimensional description from the edge information in a photograph by means of a topological, mathematical process. A computer program has been written which can process a photograph into a line drawing .transform the line drawing into a three-dimensional representation and, finally, display the three-dimensional structure with all the hidden lines removed, from any point of view. The 2-D to 3-D construction and 3-D to 2-D display processes are sufficiently general to handle most collections of planar-surfaced objects and provide a valuable starting point for future investigation of computer-aided three-dimensional systems.
International Journal of Engineering and Science Invention (IJESI)inventionjournals
International Journal of Engineering and Science Invention (IJESI) is an international journal intended for professionals and researchers in all fields of computer science and electronics. IJESI publishes research articles and reviews within the whole field Engineering Science and Technology, new teaching methods, assessment, validation and the impact of new technologies and it will continue to provide information on the latest trends and developments in this ever-expanding subject. The publications of papers are selected through double peer reviewed to ensure originality, relevance, and readability. The articles published in our journal can be accessed online.
The students can learn about basics of image processing using matlab.
It explains the image operations with the help of examples and Matlab codes.
Students can fine sample images and .m code from the link given in slides.
This lecture is about particle image velocimetry technique. It include discussion about the basic element of PIV setup, image capturing, laser lights, synchronize and correlation analysis.
CFD Simulation of By-pass Flow in a HRSG module by R&R Consult.pptxR&R Consult
CFD analysis is incredibly effective at solving mysteries and improving the performance of complex systems!
Here's a great example: At a large natural gas-fired power plant, where they use waste heat to generate steam and energy, they were puzzled that their boiler wasn't producing as much steam as expected.
R&R and Tetra Engineering Group Inc. were asked to solve the issue with reduced steam production.
An inspection had shown that a significant amount of hot flue gas was bypassing the boiler tubes, where the heat was supposed to be transferred.
R&R Consult conducted a CFD analysis, which revealed that 6.3% of the flue gas was bypassing the boiler tubes without transferring heat. The analysis also showed that the flue gas was instead being directed along the sides of the boiler and between the modules that were supposed to capture the heat. This was the cause of the reduced performance.
Based on our results, Tetra Engineering installed covering plates to reduce the bypass flow. This improved the boiler's performance and increased electricity production.
It is always satisfying when we can help solve complex challenges like this. Do your systems also need a check-up or optimization? Give us a call!
Work done in cooperation with James Malloy and David Moelling from Tetra Engineering.
More examples of our work https://www.r-r-consult.dk/en/cases-en/
Overview of the fundamental roles in Hydropower generation and the components involved in wider Electrical Engineering.
This paper presents the design and construction of hydroelectric dams from the hydrologist’s survey of the valley before construction, all aspects and involved disciplines, fluid dynamics, structural engineering, generation and mains frequency regulation to the very transmission of power through the network in the United Kingdom.
Author: Robbie Edward Sayers
Collaborators and co editors: Charlie Sims and Connor Healey.
(C) 2024 Robbie E. Sayers
Saudi Arabia stands as a titan in the global energy landscape, renowned for its abundant oil and gas resources. It's the largest exporter of petroleum and holds some of the world's most significant reserves. Let's delve into the top 10 oil and gas projects shaping Saudi Arabia's energy future in 2024.
About
Indigenized remote control interface card suitable for MAFI system CCR equipment. Compatible for IDM8000 CCR. Backplane mounted serial and TCP/Ethernet communication module for CCR remote access. IDM 8000 CCR remote control on serial and TCP protocol.
• Remote control: Parallel or serial interface.
• Compatible with MAFI CCR system.
• Compatible with IDM8000 CCR.
• Compatible with Backplane mount serial communication.
• Compatible with commercial and Defence aviation CCR system.
• Remote control system for accessing CCR and allied system over serial or TCP.
• Indigenized local Support/presence in India.
• Easy in configuration using DIP switches.
Technical Specifications
Indigenized remote control interface card suitable for MAFI system CCR equipment. Compatible for IDM8000 CCR. Backplane mounted serial and TCP/Ethernet communication module for CCR remote access. IDM 8000 CCR remote control on serial and TCP protocol.
Key Features
Indigenized remote control interface card suitable for MAFI system CCR equipment. Compatible for IDM8000 CCR. Backplane mounted serial and TCP/Ethernet communication module for CCR remote access. IDM 8000 CCR remote control on serial and TCP protocol.
• Remote control: Parallel or serial interface
• Compatible with MAFI CCR system
• Copatiable with IDM8000 CCR
• Compatible with Backplane mount serial communication.
• Compatible with commercial and Defence aviation CCR system.
• Remote control system for accessing CCR and allied system over serial or TCP.
• Indigenized local Support/presence in India.
Application
• Remote control: Parallel or serial interface.
• Compatible with MAFI CCR system.
• Compatible with IDM8000 CCR.
• Compatible with Backplane mount serial communication.
• Compatible with commercial and Defence aviation CCR system.
• Remote control system for accessing CCR and allied system over serial or TCP.
• Indigenized local Support/presence in India.
• Easy in configuration using DIP switches.
1. APPLICATION OF REMOTE SENSING AND
GEOGRAPHICAL INFORMATION SYSTEM IN
CIVIL ENGINEERING
Date:
INSTRUCTORS
DR. MOHSIN SIDDIQUE
ASSIST. PROFESSOR
DEPARTMENT OF CIVIL ENGINEERING
2. Geographic query and analysis
How many
houses are
within 50m of
this junction?
How many
children live in
this 100m grid
square?
Which house
holds falls within
the floodplain?
2
3. Spatial analysis is a set of methods whose results change when the locations
of the objects being analyzed change
Spatial analysis is the crux of GIS. Spatial analysts can reveal things that might
otherwise be invisible – it can make what is implicit explicit.
Methods of spatial analysis can be very sophisticated, but they can also be
very simple
There are many possible ways of defining spatial analysis, but all in one way
or another express the basic idea that information on locations is essential –
that analysis carried out without knowledge of locations is not spatial analysis
Spatial analysis can be used to further the aims of science, by revealing
patterns that were not previously recognized, and that hint at undiscovered
generalities and laws
Spatial Analysis
3
4. In the 1850s cholera was very poorly
understood
An outbreak in London in 1854 in the
Soho district was typical of the time,
and the deaths it caused are mapped in
Figure
Dr. John Snow conceived the hypothesis
that cholera was transmitted through the
drinking of polluted water, rather than
through the air, as was commonly
believed
He noticed that the outbreak appeared
to be centered on a public drinking
water pump in Broad Street, and if his
hypothesis was correct, the pattern
shown on the map would reflect the
locations of people who drank the
pump’s water
Dr. John Snow and the causes of cholera
Dr. John Snow and the causes of
cholera in London
4
5. There are nine methods for testing spatial relations between geometric
objects. Each takes as input two geometries and evaluates whether the
relation is true or not.
1. Equals – are the geometries the same.
2. Disjoint – do the geometries share a common point
3. Intersects – do the geometries intersect
4. Touches – do the geometries intersect at their boundaries
5. Crosses – do the geometries overlap
6. Within – do the geometries within another
7. Contains – does one geometry completely contain another
8. Overlaps – do the geometries overlap
9. Relate – are the intersections between the interior, boundary or exterior
of the geometries.
Spatial relations and analysis on geometric objects
5
6. Seven methods support spatial analysis on these geometries:
1: Distance – determines the shortest distance between any two points in two
geometries.
2: Buffer – returns a geometry that represents all the points whose distance
from the geometry is less than or equal to a user defi ned distance.
3: Convex hull – returns a geometry representing the convex hull of a
geometry (convex hull is the smallest polygon that can enclose another
geometry without any concave areas).
Spatial relations and analysis on geometric objects
6
7. 4: Intersection – returns a geometry that contains just the points common to
both input geometries.
5: Union – returns a geometry that contains all the points in both input
geometries.
6: Difference – returns a geometry containing the points that are different
between the two geometries.
7: SymDifference – returns a geometry containing the points that are in either
of the input geometries, but not both.
Spatial relations and analysis on geometric objects
7
8. Spatial relations and analysis on geometric objects
Examples of possible relations for two geographic database.
8
9. Spatial relations and analysis on geometric objects
Examples of spatial analysis methods on geometries.
9
10. Spatial relations and analysis on geometric objects
Examples of spatial analysis methods on geometries.
10
12. Queries and reasoning are the most basic of analysis operations, in which
the GIS is used to answer simple questions posed by the user.
No changes occur in the database, and no new data are produced.
The operations vary from simple and well-defined queries like
‘how many houses are found within 1 km of this point’,
to vaguer questions ‘which is the closest city to Lahore going east’, where
the response may depend on the system’s ability to understand what the
user means by ‘going east’.
Interrogations/queries may involve pointing at a map, typing a question or
pulling down a menu and clicking some buttons or sending formal SQL request
to database.
The term reasoning encompasses a collection of methods designed to respond
to more complex forms of query and interrogation.
Queries and reasoning
12
13. Measurements are simple numerical values that describe aspects of
geographic data.
They include measurement of simple properties of objects, like
length,
area, or
shape,
and of the relationships between pairs of objects, like distance or
direction.
Measurements
13
14. Transformations are simple methods of spatial analysis that change datasets,
combining them or comparing them to obtain new datasets, and eventually
new insights.
Transformations use simple geometric, arithmetic, or logical rules, and they
include operations that convert raster data into vector data, or vice versa.
They may also create fields from collections of objects, or detect collections of
objects in fields.
Buffering
One of the most important transformations available to the GIS user is the
buffer operation called buffering
Given any set of objects, which may include points, lines, or areas, a buffer
operation builds a new object or objects by identifying all areas that are
within a certain specified distance of the original objects.
Buffering is possible in both raster and vector GIS, in the raster case
Transformations
14
16. Transformations
A raster generalization of the buffer function where changes may be
controlled by some variable (example is of travel speed, whose value is
recorded in every raster cell)
16
17. Point in polygon: In its simplest
form, the point in polygon operation
determines whether a given point
lies inside or outside a given
polygon.
In more elaborate forms there may
be many polygons, and many points,
and the task is to assign points to
polygons.
If the polygons overlap, it is possible
that a given point lies in one, many,
or no polygons, depending on its
location.
Transformations
The point in polygon problem.
17
18. Polygon overlay is similar to point in polygon transformation in the sense that
two sets of objects are involved, but in this case both are polygons.
It exists in two forms, depending on whether a field or discrete object
perspective is taken.
From the discrete object perspective, the task is to determine whether two
area objects overlap, to determine the area of overlap, and to define the
area formed by the overlap as one or more new area objects
This operation is useful to determine answers to such queries as:
How much area lies in the shaded zone?
How much of this land parcel is shaded but not the white polygon?
What proportion of the land area outside the shaded but inside the white
polygon?
Transformations
18
19. From the field perspective the task is
somewhat different.
Figure shows two datasets, both
representations of fields–one
differentiates areas according to
land ownership, and the other
differentiates the same region
according to land cover class.
There are numerous queries that
require simultaneous access to both
datasets, for example:
⇒⇒⇒⇒ What is the total area of land owned
by A and with land cover class X?
⇒⇒⇒⇒ Where are the areas that is owned by
C and have land cover class Y?
⇒⇒⇒⇒ What is the land cover class and who
is the owner of the point indicated by
the user?
Transformations
Polygon overlay in the field case. Where a
dataset representing two types of land
cover. It is overlaid on a dataset showing
three land parcels owned by three
different persons. The overlay result will be
a single dataset in which every point
is identified with one land cover type and
one ownership type. There will be five
polygons, as land over X intersects two
ownership types and land cover y
intersects with three.
19
20. Spatial interpolation is a pervasive operation in GIS.
Although it is often used explicitly in analysis, it is also used implicitly, in
various operations such as the preparation of a contour map display, where
spatial interpolation is invoked without the user’s direct involvement.
Spatial interpolation is a process of intelligent guesswork, in which the
investigator attempts to make a reasonable estimate of the value of a field at
places where the field has not actually been measured.
Spatial interpolation is an operation that makes sense only from the field
perspective.
Spatial interpolation
20
21. Spatial interpolation finds applications in many areas:
In contouring, when it is necessary to guess where to place contours in
between measured locations.
In estimating the elevation of the surface in between the measured
locations of a DEM.
In estimating rainfall, temperature, and other attributes at places that are
not weather stations, and where no direct measurements of these
variables are available.
In resampling rasters, the operation that must take place whenever raster
data must be transformed to another grid.
Two commonly used methods of spatial interpolation are inverse distance
weighting (IDW) and Kriging
Spatial interpolation
21
22. Inverse distance weighting (IDW)
is the workhorse of spatial
interpolation, the method that is
most often used by GIS analysts.
It employs the Tobler law by
estimating unknown measurements
as weighted averages over the
known measurements at nearby
points, giving the greatest weight to
the nearest points.
IDW provides a simple way of
guessing the values of a field at
locations where no measurement is
available.
Inverse distance weighting
Notation used in the equations
defining spatial interpolation.
22
24. Kriging: Of all of the common
methods of spatial interpolation it is
Kriging that makes the most
convincing claim to be grounded in
good theoretical principles.
The basic idea is to discover
something about the general
properties of the surface, as
revealed by the measured values,
and then to apply these properties
in estimating the missing parts of the
surface.
Smoothness is the most important
property, and it is operationalized
in Kriging in a statistically
meaningful way.
Kriging
A semivariogram, here each
cross represents a pair of points.
The solid circles are obtained by
averaging within the ranges of
the distance axis. The dashed
line is the best fit to the five
points.
24
25. Density estimation is in many ways the logical twin of spatial interpolation –
it begins with points, and ends with a surface.
But conceptually the two approaches could not be more different, because
one seeks to estimate the missing parts of a field from samples of the field
taken at data points, while the other creates a field from discrete objects.
Density estimation
Two identical datasets but with different representations.
A – represents a field of atmospheric temperature recorded at nine sample points.
B – nine discrete objects representing population of different settlements in thousands.
Spatial interpolation is appropriate for case A, while for case B density estimation is
suitable.
25
26. Density estimation could be applied to any type of discrete spatial object, it
is most often applied to the estimation of point density, and that is the focus
here.
The most obvious example is the estimation of population density, and but it
could be equally well applied to the density of different kinds of diseases, or
animals, or any other set of well-defined points.
Density estimation
Density estimation using two different distance parameters in the
respective kernel functions, displaying smoother and less peaked nature of
the surface that results from the larger distance parameter.
26
27. Descriptive summaries attempt to capture the essence of a dataset in one or
two numbers.
They are the spatial equivalent of the descriptive statistics commonly used in
statistical analysis, including the mean and standard deviation.
Centers: To analyze the numerical summaries generally we measure by
methods of central tendency.
Like mean is one method which is broadly citing the average of data
series, similarly median, where the value is as such that one half of the
numbers are larger and one half are smaller.
Dispersion: Central tendency is the obvious choice if a set of numbers are to
be summarized in a single value, but where there is opportunity for a second
summary value standard deviation or the variance is often used.
Standard deviation and variance are more appropriate measures of
dispersion than the range because as averages they are less sensitive to
the specific values of the extremes
Descriptive summaries
27
28. Histograms and Pie Charts: Histograms (bar graphs) and pie charts are two
of many ways of visualizing the content of a geographic database.
A histogram shows the relative frequencies of different value of an attribute
by ordering them on the X axis and displaying frequency through the length
of a bar parallel to the Y axis.
Attributes should have interval or ratio properties, although ordinal properties
are sufficient to allow the values to be ranked and histogram based on
ordinal data is useful representation.
A pie chart is useful for nominal data and is used to display the relative
frequencies of distinct values, with no necessity for ranking.
Pie charts are also useful in dealing with attributes measured on cyclic scales.
Both take a single attribute and organize its values in a form that allow quick
comprehension.
Descriptive summaries
28
29. Scatterplots are useful visual summaries of relationships between attributes. It
display the value of one attribute plotted against the other.
If both sets of attributes belong to the same objects then the construction of a
scatter plot is straight.
Spatial Dependence: The fundamental problem of spatial analysis is selecting
appropriate digital representations from the real world.
The Tobler’s first law of geography states that everything is related to
everything else but near things are more related than distant things.
A dataset can exhibit positive spatial dependence at one scale but negative
at another scale.
Spatial dependence is a very useful descriptive summary of geographic data
and a fundamental part of its nature
Descriptive summaries
29
30. Fragmentation and Fractional Dimension: In GIS, maps may show many
patches with each patch representing an area of uniform class and this may
be bounded by patch of different class.
For example, a soil map where we may be interested in the degree to which
the landscape can be fragmented (meaning breaking in small or large
patches).
Fragmentation statistics provide the numerical basis for this purpose. Here we
can analyze the number of patches, their shape or size etc, as a way of
summarizing the geographic details.
The concept of fractals is used as a way of summarizing the relationship
between apparent length and level of geographic detail in the form of
fractional dimensions.
Descriptive summaries
30
31. Optimization techniques are normative in nature, designed to select ideal
locations for objects given certain well-defined criteria.
They are widely used in market research, in the package delivery industry,
and in a host of other applications.
Optimization is a prime example of GIS utility to support spatial decisions. It
can be by many ways like optimum location of points, routing on a network,
selection of optimum paths across continuous space, locating facilities etc.
The methods of optimization also divide between those that are designed
to locate points and routes on network
and those designed to locate points and routes in continuous space without
respect to the existence of roads or other links. E.g., Point Locations,
Routing Problems, and Optimum Paths
Optimization techniques
31
32. Point Locations: It is an instance of location in continuous space and
identifying location that minimizes total distance with respect to a number of
points.
The analogous problem on a network would involve finding that location on
the network which minimize total distance to a number of points, also located
on the network, using routes that are considered on the network using routes
that are constrained to the network.
Location allocation involves two types of decisions – where to locate and how
to allocate demand for service.
Optimization techniques
32
33. Routing Problems: This is another area of optimization where routing and
scheduling or decisions about he optimum tracks are considered.
At the root of all routing problem is the shortest path, the path through the
network between a defined origin and destination that minimizes distance or
travel time.
Attributes such as length, travel speed, restrictions on travel direction and level
of congestion are taken into account.
A GIS can be very effective at solving routing problems because it is able to
examine vast numbers of possible solutions quickly.
Optimization techniques
33
34. Optimum Paths: Here the concern is for finding optimum path across
continuous space for linear facilities like highways, pipelines or even airline
path etc.
Again emphasis would be on shortest route may be to save fuel, time or
avoiding the restrictions if there are any.
These are normally sorted in raster, where each cell may be assigned a
friction value, equal to the cost or time associated with moving across the cell
in the horizontal or vertical directions.
Optimization techniques
34
35. Hypothesis testing focuses on the process of reasoning from the results of a
limited sample to make generalizations about an entire population.
It allows us, for example, to determine whether a pattern of points could have
arisen by chance, based on the information from a sample.
Hypothesis testing is based on two concepts – confidence limits and inferential
tests, which are basically statistical testing.
Hypothesis testing
35
36. Comments….
Questions….
Suggestions….
36
I am greatly thankful to all the information sources
(regarding remote sensing and GIS) on internet that I
accessed and utilized for the preparation of present
lecture.
Thank you !