Understanding Coordinate Systems and Projections for ArcGIS
•Download as PPTX, PDF•
30 likes•19,377 views

Everything you need to know to work with coordinate systems and projecting data in ArcGIS. The presentation starts by explaining the terminology, and then discusses the details you need to know to actually work successfully with coordinate systems, use the proper projections, and geographic transformations. This is a very practical look at a complex subject.

Recommended
More Related Content
What's hot
What's hot (20)
Viewers also liked
Similar to Understanding Coordinate Systems and Projections for ArcGIS
Similar to Understanding Coordinate Systems and Projections for ArcGIS (20)
Recently uploaded
Recently uploaded (20)
Understanding Coordinate Systems and Projections for ArcGIS
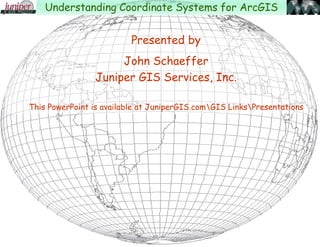
- 1. Presented by John Schaeffer Juniper GIS Services, Inc. This PowerPoint is available at JuniperGIS.comGIS LinksPresentations Understanding Coordinate Systems for ArcGIS
- 2. Presentation Objectives Understand basic concepts on coordinate systems for the GIS user. Terminology – What all those words really mean Geodesy – The shape of the Earth Geographic Coordinate Systems Datums Map Projections Projected Coordinate Systems Working with Projections in ArcGIS Changes in ArcGIS 10.1 Understanding Coordinate Systems for ArcGIS
- 3. Coordinate System – A reference framework consisting of: A set of points, lines and/or surfaces, and a set of rules, used to define the positions of points in space, in either two or three dimensions. Projection Terminology - From the ArcGIS Glossary Understanding Coordinate Systems for ArcGIS
- 4. Geographic Coordinate System – A reference system that uses: Latitude and longitude to define the locations of points on the surface of a sphere or spheroid. A geographic coordinate system definition includes a datum, prime meridian, and angular unit. Understanding Coordinate Systems for ArcGIS Projection Terminology - From the ArcGIS Glossary
- 5. Projected Coordinate System – A reference system used to: locate x, y, and z positions of point, line, and area features in two or three dimensions. A projected coordinate system is defined by a geographic coordinate system, a map projection, any parameters needed by the map projection, and a linear unit of measure. Understanding Coordinate Systems for ArcGIS Projection Terminology - From the ArcGIS Glossary
- 6. Planar Coordinate System – A two-dimensional measurement system that locates features on a plane based on their distance from an origin (0,0) along two perpendicular axes. Understanding Coordinate Systems for ArcGIS Projection Terminology - From the ArcGIS Glossary
- 7. Cartesian Coordinate System – A two-dimensional, planar coordinate system in which horizontal distance is measured along an x-axis and vertical distance is measured along a y-axis. Each point on the plane is defined by an x,y coordinate. Relative measures of distance, area, and direction are constant. X and Y values are positive only in the upper-right quadrant. Understanding Coordinate Systems for ArcGIS Projection Terminology - From the ArcGIS Glossary
- 8. Datum – The reference specifications of a measurement system, usually a system of coordinate positions on a surface (a horizontal datum) or heights above or below a surface (a vertical datum). Geodetic Datum – A datum that is the basis for calculating positions on the earth's surface or heights above or below the earth's surface. Datums are based on specific Ellipsoids and sometimes have the same name as the ellipsoid. Understanding Coordinate Systems for ArcGIS Projection Terminology - From the ArcGIS Glossary
- 9. Geocentric Datum – A horizontal geodetic datum based on an ellipsoid that has its origin at the earth's center of mass. Examples are the World Geodetic System of 1984, the North American Datum of 1983, and the Geodetic Datum of Australia of 1994. The first uses the WGS84 ellipsoid; the latter two use the GRS80 ellipsoid. Geocentric Datums are more compatible with GPS. Local Datum – A Horizontal Geodetic datum based on an ellipsoid that has its origin on the surface of the earth, such as the North American Datum of 1927. Understanding Coordinate Systems for ArcGIS Projection Terminology - From the ArcGIS Glossary
- 10. Ellipsoid/Spheriod – A three-dimensional, closed geometric shape, all planar sections of which are ellipses or circles. A three-dimensional shape obtained by rotating an ellipse about its minor axis, with dimensions that either approximate the earth as a whole, or with a part that approximates the corresponding portion of the geoid. A mathematical figure that approximates the shape of the Earth in form and size, and which is used as a reference surface - or DATUM for Geodetic surveys. (From Nationalatlas.gov) Understanding Coordinate Systems for ArcGIS Projection Terminology - From the ArcGIS Glossary
- 11. Transformation – The process of converting the coordinates of a map or an image from one system to another, typically by shifting, rotating, scaling, skewing, or projecting them. Geographic Transformation – A systematic conversion of the latitude-longitude values for a set of points from one geographic coordinate system - Datum - to equivalent values in another geographic coordinate system. Often called the “Datum Shift” Understanding Coordinate Systems for ArcGIS Projection Terminology - From the ArcGIS Glossary
- 12. Projection(Map Projection) – A method by which the curved surface of the earth is portrayed on a flat surface. This requires a systematic mathematical transformation of the earth's graticule of lines of longitude and latitude onto a plane. Understanding Coordinate Systems for ArcGIS Projection Terminology - From the ArcGIS Glossary
- 13. Geographic Coordinate System – The earth as a sphere, with location in latitude and longitude, with units in degrees. Projected Coordinate System – The earth, or parts of it, flat, with location in constant units. Datum – A large scale reference grid based on a spheriodal model of the earth. Projection – a method of converting locations from one coordinate system to another. Geographic Transformation – a method to convert locations from one datum to another datum as part of a projection. Projection Terminology – What you really need to know Understanding Coordinate Systems for ArcGIS
- 14. Geographic and Projected Coordinate Systems are tied to Datums Datums reflect different ways of measuring the shape of the earth and impact both Geographic Coordinate Systems using Latitude/Longitude and Projected Coordinate Systems. Datums can be considered as a set of established reference points to which coordinate systems are registered. Coordinate Systems and Datums Understanding Coordinate Systems for ArcGIS
- 15. Datums and Geographic Coordinate Systems (GCS) are often the same, and the terms are sometimes used interchangeably. In many cases a datum may be named the same as a GCS. In ArcGIS, almost anytime you see the phrase Geographic Coordinate System or GCS, think Datum. Coordinate Systems and Datums Understanding Coordinate Systems for ArcGIS
- 16. Coordinate Systems and Datums Common Datums used in the US: North American Datum 1927 (NAD 27) & Old Hawai'ian Based on Clarke Ellipsoid of 1866 North American Datum 1983 (NAD 83) Based on the GRS80 Ellipsoid High-Accuracy Reference Networks (HARN) Based on the GRS80 Ellipsoid but uses GPS satellites for control World Geodetic System 1984 (WGS84) Based on the WGS 1984 Ellipsoid Difference between NAD27 and NAD83 in the western US is about 100 meters. Difference between NAD83 and HARN is about 16 feet. Understanding Coordinate Systems for ArcGIS
- 17. Coordinate Systems and Datums Control points for North American Datum 1927 Understanding Coordinate Systems for ArcGIS
- 18. Coordinate Systems and Datums Control points for North American Datum 1983 Understanding Coordinate Systems for ArcGIS
- 19. Geodesy – Study of the shape of the Earth The earth was initially thought to be flat. Later thought to be a sphere. French geographers in the 1730’s proved that the earth is an ellipsoidspheroid. Common ellipsoids used now are Clarke 1866, the Geodetic Reference System of 1980(GRS80) and more recently the WGS84 ellipsoid. These are just different measurements of the “flattening” at the poles. Understanding Coordinate Systems for ArcGIS
- 20. ...And then there’s the Geoid This is a hypothetical figure of the earth that represents the surface as being at mean sea level, but still influenced by gravitational pull, density of earth’s materials, and hydrostatic forces. Geodesy – Study of the shape of the Earth Understanding Coordinate Systems for ArcGIS
- 21. Ellipsoid or Geoid?? This effects how elevation is measured, and also can effect the location of a point on the earth. When working between different coordinate systems, you may need to know how elevation is being measured: Height above Ellipsoid (HAE) Height above Geoid (HAG) In Bend, Oregon the ellipsoid is about 64’ below the geoid. Geodesy – Study of the shape of the Earth Understanding Coordinate Systems for ArcGIS
- 22. Measuring the Earth in 3D – Latitude and Longitude Latitude/Longitude measures in degrees — not in distance. The actual length of a degree changes over different parts of the earth. Understanding Coordinate Systems for ArcGIS
- 23. Location North or South (Latitude) is measured from the Equator Measuring the Earth in 3D – Latitude and Longitude Understanding Coordinate Systems for ArcGIS
- 24. Location East or West (Longitude) is measured from the Prime Meridian Measuring the Earth in 3D – Latitude and Longitude Understanding Coordinate Systems for ArcGIS
- 25. Distortion – Impossible to flatten a round object without distortion Projections try to preserve one or more of the following properties: Area – sometimes referred to as equivalence Shape – usually referred to as “conformality” Direction – or “azimuthality” Distance When choosing a projection, consider what type of measurement is important. Measuring the Earth in 3D – Latitude and Longitude Understanding Coordinate Systems for ArcGIS
- 26. “The transformation of the round earth onto a flat surface using Latitude and Longitude as a reference.” Projections – Going from 3D to Flat Maps Understanding Coordinate Systems for ArcGIS
- 27. Projections – Going from 3D to Flat Maps The World as seen from Space in 3D Understanding Coordinate Systems for ArcGIS
- 28. The World Projected onto a Flat Surface Projections – Going from 3D to Flat Maps Understanding Coordinate Systems for ArcGIS
- 29. The World as seen from an Oregon perspective Projections – Going from 3D to Flat Maps Understanding Coordinate Systems for ArcGIS
- 30. The World as seen from an Indonesian perspective Projections – Going from 3D to Flat Maps Understanding Coordinate Systems for ArcGIS
- 31. The World as seen from a Kenyan perspective Projections – Going from 3D to Flat Maps Understanding Coordinate Systems for ArcGIS
- 32. The World as seen from an Indian perspective Projections – Going from 3D to Flat Maps Understanding Coordinate Systems for ArcGIS
- 33. The World as seen from the Old Hawai'ian perspective Projections – Going from 3D to Flat Maps Understanding Coordinate Systems for ArcGIS
- 34. Projections are created by transferring points on the earth onto a flat surface. Think of this as having a light in the middle of the earth, shining through the earth’s surface, onto the projection surface. There are three basic methods for doing this: Planar – projection surface laid flat against the earth Conic – cone is placed on or through the surface of the earth Cylindrical – projection surface wrapped around the earth Where the projection surface touches the earth is called the “Standard Line.” Projections – Going from 3D to Flat Maps Understanding Coordinate Systems for ArcGIS
- 35. Projections – Polar Planar Projection Understanding Coordinate Systems for ArcGIS
- 36. Projections – Conic Projection Understanding Coordinate Systems for ArcGIS
- 37. Projections – Cylindrical Projection Understanding Coordinate Systems for ArcGIS
- 38. Projections –Transverse Mercator Understanding Coordinate Systems for ArcGIS
- 39. Projections – Origami Projection For the official descriptions of projection types, see http://erg.usgs.gov/isb/pubs/MapProjections/projections.html or Google on USGS Projections Poster Understanding Coordinate Systems for ArcGIS
- 40. Projections – ”Developing” a Cylindrical Projection Understanding Coordinate Systems for ArcGIS
- 41. Projection Distortion – Conic Projection cutting through the earth’s surface at 2 parallels Understanding Coordinate Systems for ArcGIS
- 42. Projected Coordinate Systems – Plotting Location on a Flat Map Once reference points have been projected to a flat plane, a coordinate system is established that provides a common reference on the ground. These are also sometimes called “Map Grids” and are usually based on the Cartesian Coordinate system. Understanding Coordinate Systems for ArcGIS
- 43. Coordinate systems have a baseline running East-West, and a baseline running North-South, used to measure distance in two directions from the origin. The origin, with a given value of 0,0 is where the baselines intersect. The location of any point can be described by listing two coordinates, one showing the distance from the East-West baseline and one showing the distance from the North-South baseline. Most CAD and mapping systems refer to the coordinates as “X,Y” but sometimes the coordinates are referred to as “Easting” and “Northing.” Projected Coordinate Systems – Plotting Location on a Flat Map Understanding Coordinate Systems for ArcGIS
- 44. The two most common types of projected coordinate systems in use in the United States for local work are: State Plane Coordinate System UTM (Universal Transverse Mercator) Coordinate System For regional or continental work: North America Albers Equal Area Conic North America Lambert Conformal Conic Projected Coordinate Systems – Plotting Location on a Flat Map Understanding Coordinate Systems for ArcGIS
- 45. State Plane Coordinate System One or more zones for each state. Usually based on Lambert Conic Conformal projection for East-West trending states and Transverse Mercator projection for states running North-South. Usually has a “False Easting” or “False Northing” so that all units are positive. Units are usually in feet. International feet, US Feet, Survey Feet, Projected Coordinate Systems – Plotting Location on a Flat Map Understanding Coordinate Systems for ArcGIS
- 46. Projected Coordinate Systems – Plotting Location on a Flat Map Based on a Conic Conformal Projection that with two points of tangency Understanding Coordinate Systems for ArcGIS
- 47. Projected Coordinate Systems – Plotting Location on a Flat Map Based on a Lambert Conic Conformal Projection that with two points of tangency Understanding Coordinate Systems for ArcGIS
- 48. Projected Coordinate Systems – Plotting Location on a Flat Map Based on a Transverse Mercator Projection Understanding Coordinate Systems for ArcGIS
- 49. Projected Coordinate Systems – Plotting Location on a Flat Map Based on a Transverse Mercator Projection Understanding Coordinate Systems for ArcGIS
- 50. Projected Coordinate Systems – Plotting Location on a Flat Map How Long is a Foot? Many Types of Feet – all related to Meter Many names, but not consistent Foot = International Foot??; Foot_US = Survey Foot?? Wrong foot can have significant impact Understanding Coordinate Systems for ArcGIS
- 51. Projected Coordinate Systems – Plotting Location on a Flat Map How Long is a Foot? Understanding Coordinate Systems for ArcGIS
- 52. UTM Coordinate System Used often by federal agencies. Units are usually in meters. Based on Transverse Mercator projection. Usually has a “False Northing” and “False Easting” so that all units are positive. Projected Coordinate Systems – Plotting Location on a Flat Map Understanding Coordinate Systems for ArcGIS
- 53. UTM Coordinate System Projected Coordinate Systems – Plotting Location on a Flat Map Understanding Coordinate Systems for ArcGIS
- 54. UTM Coordinate System Projected Coordinate Systems – Plotting Location on a Flat Map Understanding Coordinate Systems for ArcGIS
- 55. UTM Coordinate System on the Equator Projected Coordinate Systems – Plotting Location on a Flat Map Understanding Coordinate Systems for ArcGIS
- 56. So what do we do with this information? Hopefully you now know enough about ellipsoids, projections, datums, and coordinate systems to understand why some systems have been used. Better understand what is required when projecting data. And how to determine the parameters needed to project data from one system to another. Key parameters to look for are: Coordinate system Projection Type of Datum Type of Spheroid Standard parallel(s) and or meridians False Easting False Northing Units Understanding Coordinate Systems for ArcGIS
- 57. Working with Projections in ArcGIS Data needs to be in the same coordinate system for display and analysis ArcGIS needs to know the coordinate system of the data. Coordinate information is saved in: projection files, (.prj), world files(tfw,.jpw), auxiliary files(.aux), or within the geodatabase Understanding Coordinate Systems for ArcGIS
- 58. Coordinate information can be viewed in several places. ArcCatalog>Description>Metadata>Spatial ArcMap>Layer>Properties…>Source ArcCatalog>Properties…>XY Coordinate System ArcMap>DataFrame Properties… >Coordinate Systems>Layers Working with Projections in ArcGIS Understanding Coordinate Systems for ArcGIS
- 59. Coordinate system can be defined in ArcCatalog, as a property of the data, or in ArcToolbox using Projections…> Define Projection Tool. Working with Projections in ArcGIS Understanding Coordinate Systems for ArcGIS 10.0 Dialog
- 60. ArcGIS 10.1 Coordinate System Dialog Working with Projections in ArcGIS Understanding Coordinate Systems for ArcGIS
- 61. The coordinate system can be changed using ArcToolbox with Projections…>Project Tool Important to understand the difference between defining the coordinate system and projecting the data to a different coordinate system The correct coordinate system must be defined before data can be projected. Working with Projections in ArcGIS Understanding Coordinate Systems for ArcGIS
- 62. Projecting Data in ArcGIS Projecting data might also mean changing the Datum by using a specific transformation. When changing Datums, you have a choice of transformations. How to know?? C:Program FilesArcGISDesktop 10.0(10.1)Documentation Geographic_Transformations.pdf Or search for article 21327 In ArcGIS Resources. Working with Projections in ArcGIS Understanding Coordinate Systems for ArcGIS
- 63. Projecting Data in ArcGIS – Transformation Methods Projection Methods For NAD27 to WGS84 from Pegt_namewhere.doc Working with Projections in ArcGIS Understanding Coordinate Systems for ArcGIS
- 64. Projecting Data in ArcGIS – Transformation Methods Transformation Methods for Hawai'i coordinate systems from Geographic_Transformations.pdf Working with Projections in ArcGIS Understanding Coordinate Systems for ArcGIS
- 65. Projecting Data in ArcGIS – Transformation methods NAD83/WGS84 These maps are available from ArcScripts. The script is named Geographic Transformation Formula Maps; Created by Rob Burke. http://arcscripts. esri.com/details. asp?dbid=15287 For US, …1984 _5 is recommended by ESRI Working with Projections in ArcGIS Understanding Coordinate Systems for ArcGIS
- 66. Projecting Data in ArcGIS – Transformation methods NAD27/WGS84 These maps are available from ArcScripts. The script is named Geographic Transformation Formula Maps; Created by Rob Burke. http://arcscripts. esri.com/details. asp?dbid=15287 Working with Projections in ArcGIS Understanding Coordinate Systems for ArcGIS
- 67. Projecting Data in ArcGIS – Transformation methods NAD27/NAD83 These maps are available from ArcScripts. The script is named Geographic Transformation Formula Maps; Created by Rob Burke. http://arcscripts. esri.com/details. asp?dbid=15287 Working with Projections in ArcGIS Understanding Coordinate Systems for ArcGIS
- 68. Projecting Data in ArcGIS – Transformation methods NAD83WGS84 – 10.1 10.1 provides transformation choices sorted by suitability for layer’s extent – maybe?? Working with Projections in ArcGIS Understanding Coordinate Systems for ArcGIS
- 69. Projecting Data in ArcGIS In some cases, you might need to do two transformations. 10.0 The dialog is smart enough to keep the Geographic Transformation drop-down button “active” if you haven’t selected all the needed transformations. 10.1 Working with Projections in ArcGIS Understanding Coordinate Systems for ArcGIS
- 70. Projecting Data in ArcGIS ArcGIS will also project data as part of most Geoprocessing operations – But you must set the transformation methods in the Geoprocessing Environments or this may yield inaccurate results when datum changes are necessary. Geoprocessing>Environments>Output Coordinates Working with Projections in ArcGIS Understanding Coordinate Systems for ArcGIS
- 71. ArcGIS will project data “on the fly” when you add data to ArcMap Coordinate system must be set for the data frame Transformations methods can be set if you know the specifics of the data being added. Works on raster data (images) and vector data. Project on the fly is not as “mathematically rigorous” as using the project tool. Best procedure for highest accuracy: Do all projections through the Project Tool Working with Projections in ArcGIS Understanding Coordinate Systems for ArcGIS
- 72. Modifying a Projection in ArcGIS Projections can be modified to align with the area of interest Working with Projections in ArcGIS 10.1 Understanding Coordinate Systems for ArcGIS
- 73. How to determine what projection data is in when there is no metadata Bring data into an empty map and check some of the coordinate values. If you know typical values, that may help Can be hard to tell difference between NAD27 and NAD83 for UTM or NAD83 and Harn for State Plane because those numbers only vary a few feet to a 100 meters Compare unknown data to a known reference layer Check ESRI help for article 24893 – this has some suggestions Working with Projections in ArcGIS Understanding Coordinate Systems for ArcGIS
- 74. Demonstrations Working with “Project on the Fly” and transformations Modifying Projections What is the problem with this projection?? Working with Projections in ArcGIS Understanding Coordinate Systems for ArcGIS
- 75. http://www.junipergis.com/gis-links/presentations/ Linear Referencing Editing Tips Spatial Analyst and Raster Analysis Geodatabase Topology Suitability Modeling ModelBuilder Using the Query Builder Projections on U Tube Creating Map books with ArcGIS Other Presentations Understanding Coordinate Systems for ArcGIS