Downloaded 336 times


![Addition Information More information on this topic and presentation can be found at: http://pwoessner.wikispaces.com/Digital+Cartography Questions or comments? Email me at [email_address] Twitter: @pcwoessner Blog: http://pwoessner.com](https://image.slidesharecdn.com/digitalcartography-090624203208-phpapp01/85/Digital-Cartography-22-320.jpg)

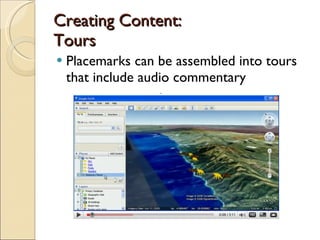
The document discusses the lack of geographical knowledge among young Americans, highlighting that many cannot locate significant countries or understand basic global facts. It emphasizes the importance of geographical literacy, intercultural understanding, and the integration of geography into various academic disciplines. Additionally, it provides an overview of digital cartography tools like Google Maps and Google Earth, detailing their features for creating and sharing custom content.


