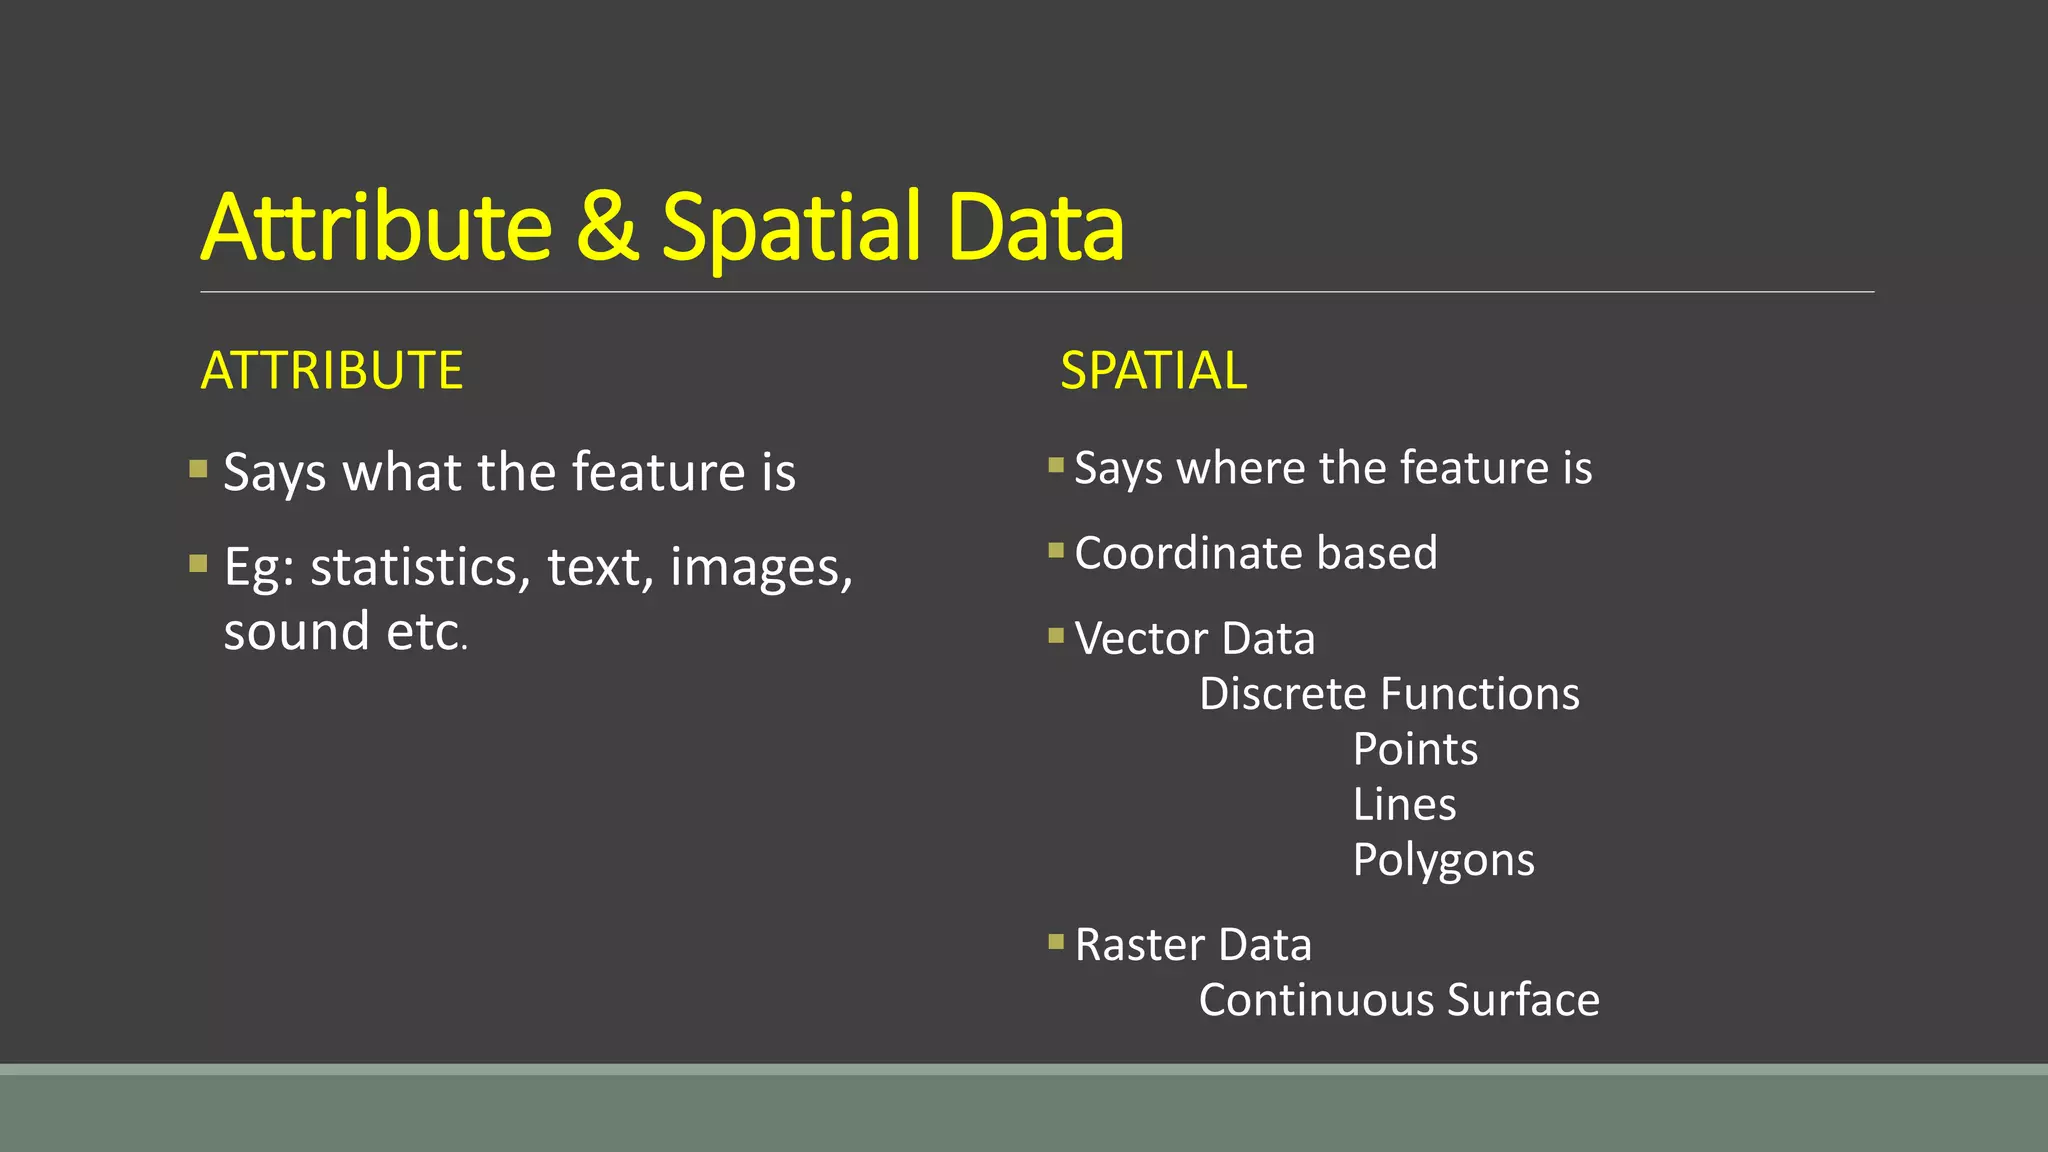
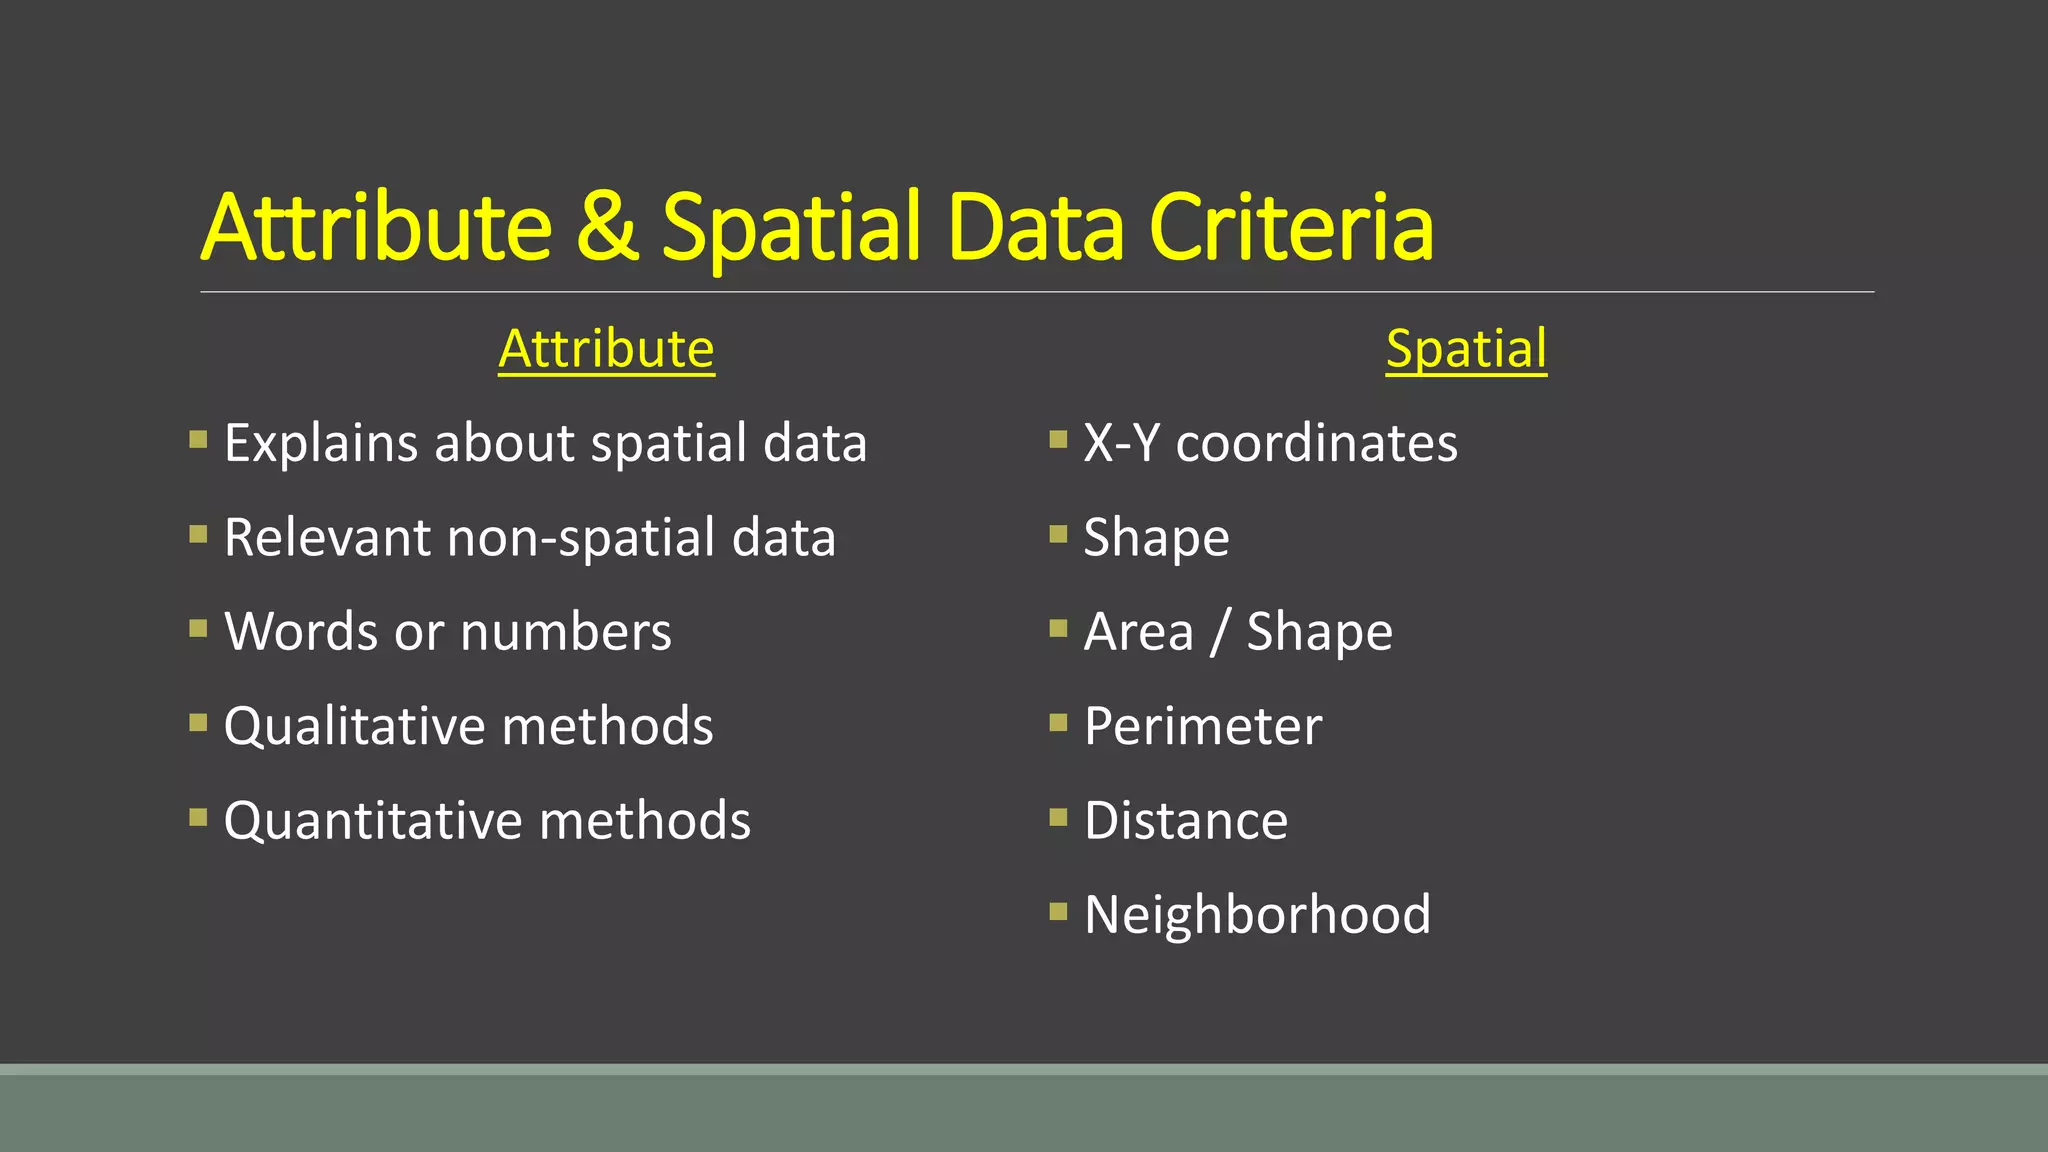
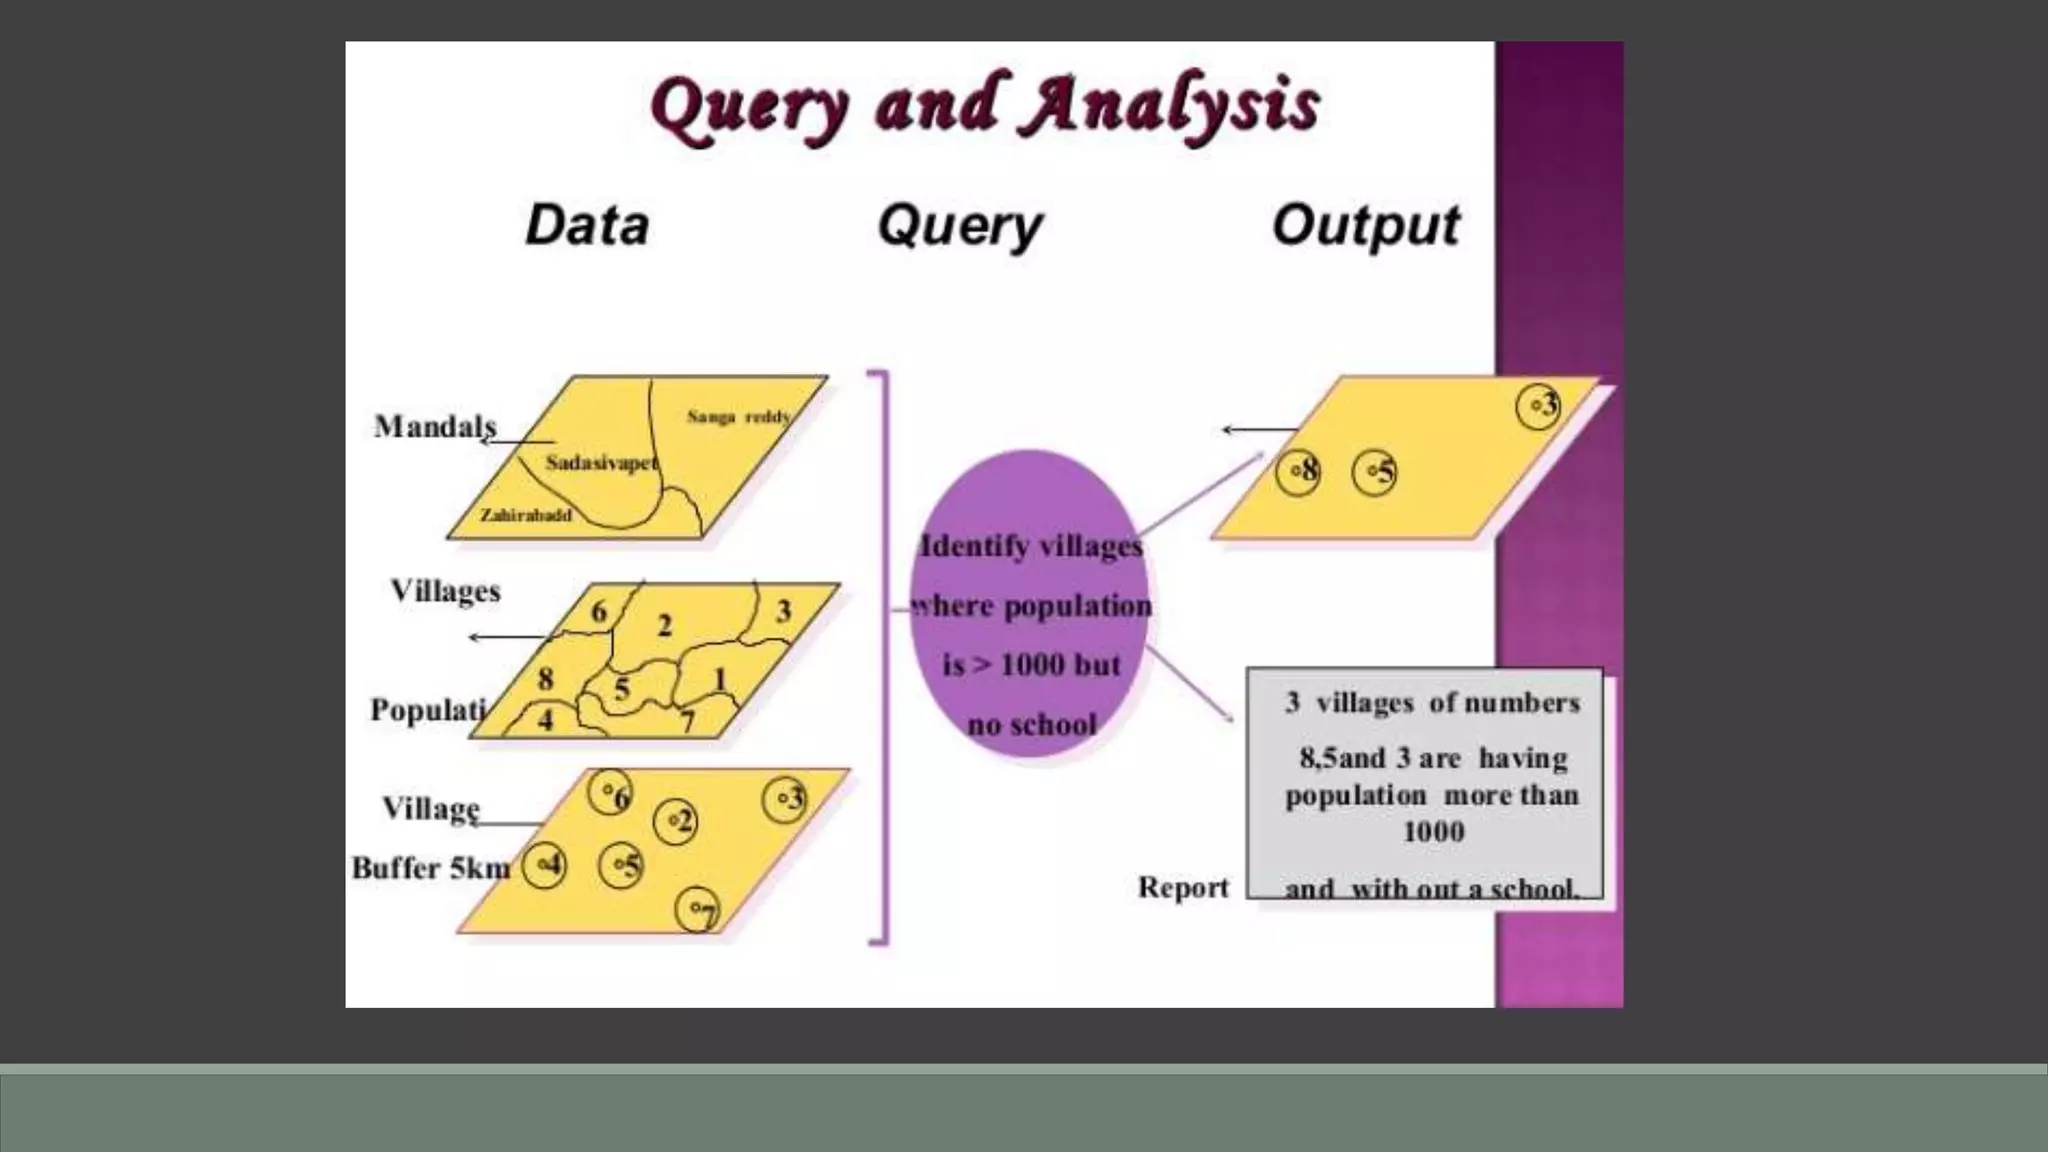
4. Attribute & Spatial Data
ATTRIBUTE
Says what the feature is
Eg: statistics, text, images,
sound etc.
SPATIAL
Says where the feature is
Coordinate based
Vector Data
Discrete Functions
Points
Lines
Polygons
Raster Data
Continuous Surface
5. Attribute & Spatial Data Criteria
Attribute
Explains about spatial data
Relevant non-spatial data
Words or numbers
Qualitative methods
Quantitative methods
Spatial
X-Y coordinates
Shape
Area / Shape
Perimeter
Distance
Neighborhood
6. Attribute Data
Attributes can be numeric or alpha-numeric
Data that can be assigned to a point, line or area spatial features
Example Attributes… Stand ID, Compartment No., Vegetation type,
Name of the Forest Block, Types of Road, VSS code etc.
7. Spatial Data
Nature of Spatial Data
Spatial component
Relative position between objects
Coordinate system
Attribute component
Explains spatial objects characteristics
Spatial relationship
Relationship between objects
Time component
Temporal element
Characteristics of Spatial Data
Location
Description
Grid Reference
Latitude / Longitude
Geometry
Shape
Route
Landscape
Topology
Connected to
Within
Adjacent to
North to
8. GIS Data Formats
There are two formats used by GIS systems to store and retrieve geographical
data:
Raster
Vector
9. Raster Format
A grid (or raster) system stores data as a string
of characters in which each character
represents a location
Data are divided into cell, pixels, or elements &
each cell/Pixel is assigned only one value
Cells are organized in arrays and array of Pixels
form the entity-Point, Line, Area and surface
The shape and size of the array determines the
basic Resolution
Polygons can be formed indicating areas of
homogeneous characteristics
The most common example of raster data is a
digital image
Vector Format
A vector system usually stores data as
coordinates
Data are associated with points, lines, or
boundaries enclosing areas
In a vector based system every point is recorded
by a pair of x and Y coordinates
Straight line segments called vectors are
displayed to indicate line based data ( roads
rivers wells)
Most spatial features can be displayed as:
Points-Line- Polygons
10.
11.
12. Comparison between Raster & Vector
RASTER
Raster formats are efficient when comparing
information among arrays with the same cell
size
Raster files are generally very large because
each cell occupies a separate line of data,
only one attribute can be assigned to each
cell, and cell sizes are relatively small
Raster representations are relatively coarse
and imprecise
VECTOR
Vector formats are efficient when comparing
information whose geographical shapes and
sizes are different
Vector files are much smaller because a
relatively small number of vectors can
precisely describe large areas and many
attributes can be ascribed to these areas
Vector representations of shapes can be very
precise
13. Geo-referenced Data
Capturing Data
Scanning: all of map converted into raster data
Digitising: individual features selected from map as points, lines or polygons
Geo-referencing
Initial scanning digitising gives co-ordinates in inches from bottom left corner of
digitiser/scanner
Real-world co-ordinates are found for four registration points on the captured
data
These are used to convert the entire map onto a real-world co-ordinate system
14. Layers in GIS
Data on different themes are stored in separate “layers”
As each layer is geo-referenced layers from different sources can
easily be integrated using location
This can be used to build up complex models of the real world from
widely disparate sources
15. Layers in GIS (Contd..)
Importance
Geographic data = representation of reality
Reality is complex
GIS uses a layer approach
Each layer includes information about one type
of phenomenon
Data layers must be aligned with one another
Proximity: Finding what is near or within a
distance from a certain location or feature
Overlay: Combining two layers to create new
information (eg: habitat based on veg, elevation & temp)
16. Querying GIS Data
Attribute query
Select features using attribute data (e.g. using SQL)
Results can be mapped or presented in conventional database form
Can be used to produce maps of subsets of the data or choropleth maps
Spatial query
Clicking on features on the map to find out their attribute values
Used in combination these are a powerful way of exploring spatial
patterns in your data
17. Spatial data: Registration
Districts, 1/1/1870
Attribute data: Mortality rate
per 1,000 from lung disease
among men aged 45-64
Source: Registrar General’s
Decennial Supplement, 1871
Query: Select areas where
mortality rate > 58.0
Attribute query: Lung disease in the 1860s
18. District: Alston with Garrigill
County: Cumberland
M_rate: 68.4
Spatial query: Lung disease in the 1860s
21. Data Integration: Overlay
Joins two layers to create
a new layer
The output layer will
contain both the spatial
AND attribute data from
both of the input layers
22. Conclusion
Data are the “heart” of any geographic information system
Data becomes valuable when it is analyzed and acted upon
Positioned by its known spatial coordinates
Input and organized (generally in layers)
Stored and retrieved
Analyzed (usually via a Relational DBMS)
Modified and displayed