Downloaded 167 times
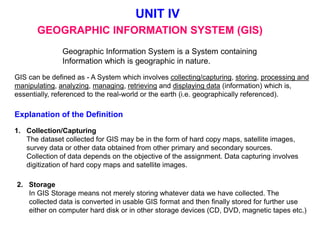


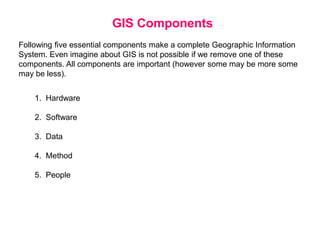
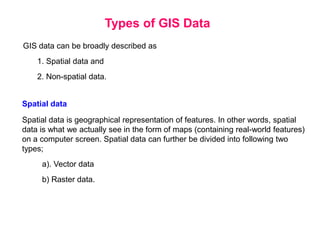


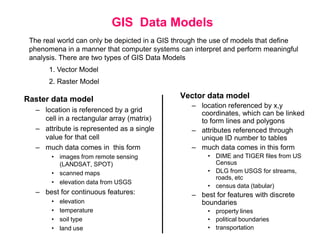
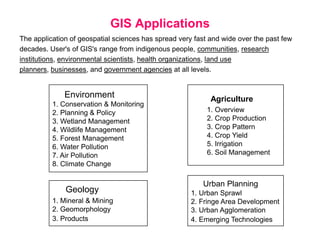


Geographic Information Systems (GIS) involve the collection, storage, processing, analysis, management, retrieval, and display of geographic data. GIS integrates spatial and non-spatial data through various data models, enabling applications across multiple fields such as environmental management, urban planning, and natural resource management. Key components of GIS include hardware, software, data, methodology, and user expertise, all essential for effective geographic analysis and decision-making.


