Download as PDF, PPTX


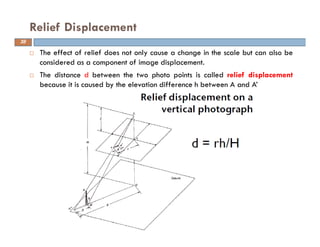
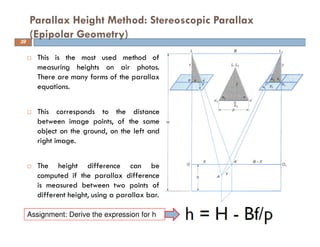


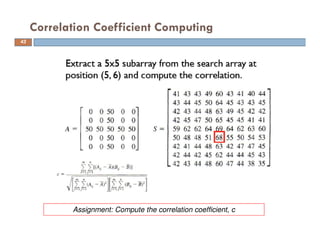


This document discusses different types of remote sensing systems used in civil engineering, including optical, photogrammetric, thermal, multispectral, hyperspectral, and panchromatic systems. It provides examples and specifications of various sensors, such as MODIS, AVIRIS, IKONOS, and WorldView. The document also covers digital image formats, photogrammetry, image distortions and displacements, reference ellipsoids, relief displacement, and methods of measuring heights from aerial photographs.


![Engineering Economics: Solved exam problems [ch1-ch4]](https://cdn.slidesharecdn.com/ss_thumbnails/solvedexamproblemsch1-ch4-200220070043-thumbnail.jpg?width=640&height=640&fit=bounds)


![Attack surfaces and attack tress[inform]](https://cdn.slidesharecdn.com/ss_thumbnails/lecture03-260108015941-a4dee53b-thumbnail.jpg?width=640&height=640&fit=bounds)

