Downloaded 1,184 times
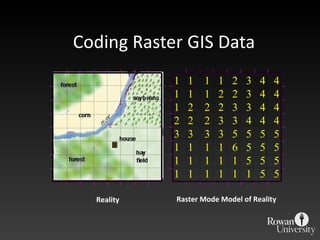
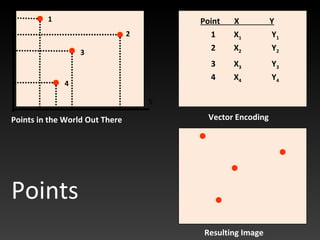
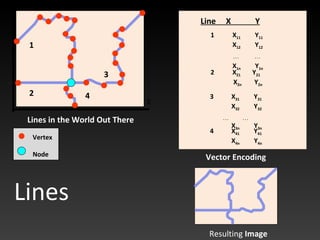
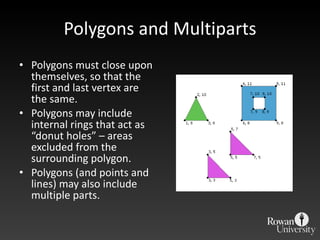
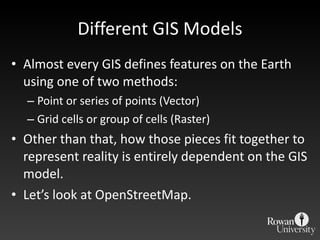


The document discusses the two major families of GIS data: raster and vector, explaining their characteristics and applications. It covers the limitations of raster data, the representation of points, lines, and polygons with vector data, normalization in database design, and the best practices for managing GIS systems. Additionally, it introduces OpenStreetMap as an alternative GIS model with its unique data storage and collaborative updating features.