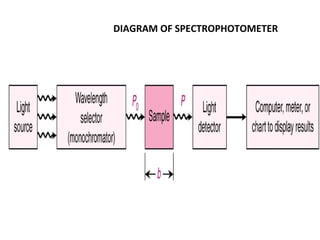
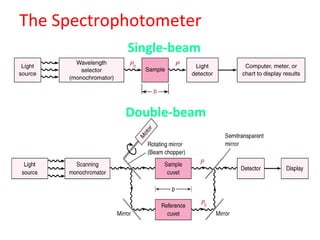
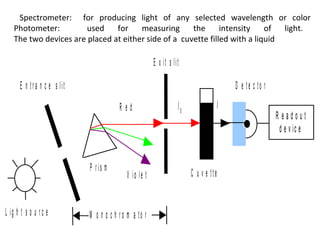
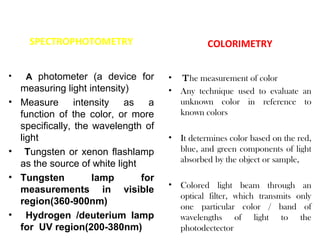
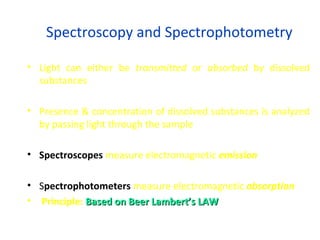
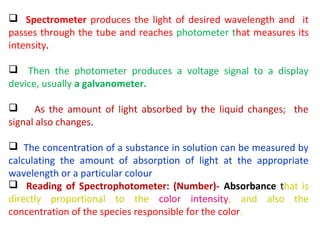
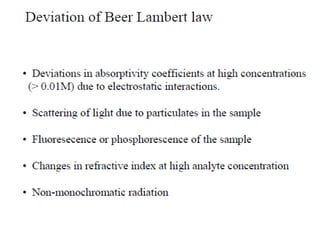
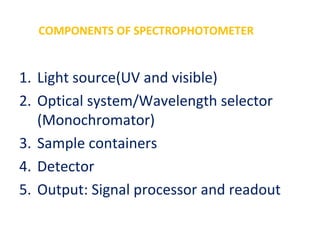
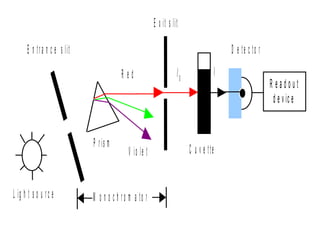
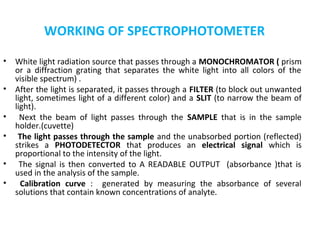
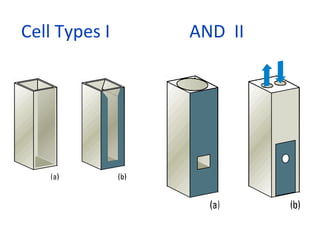
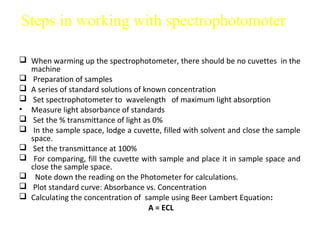
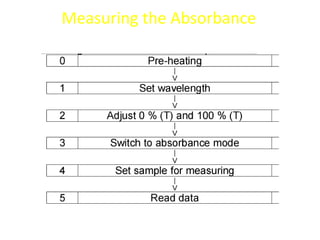
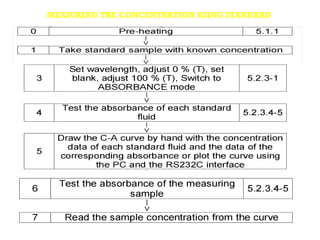
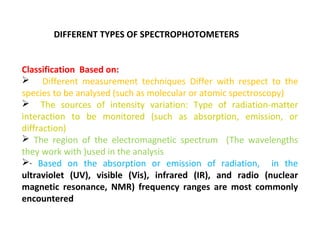
Spectrophotometry uses the principle that molecules absorb specific wavelengths of light. A spectrophotometer directs a beam of light through a sample and measures the amount of light absorbed. It contains a light source, wavelength selector like a prism or grating to produce monochromatic light, sample holders, a detector to measure transmitted light intensity, and a readout device. It works based on Beer's law, where absorbance is directly proportional to concentration, molar absorptivity, and path length. This allows spectrophotometry to quantify the concentration of an analyte by its optical properties.
A spectrophotometer is an instrument containing a monochromator, a device which produces a light beam containing wavelengths in a narrow band around a selected wavelength, and a means of measuring the ratio of that beam's intensity as it enters and leaves a cuvette 99 This describes a single-beam photometer.
Colorimeter and spectrophotometer, Mass Spectrometerprachann
It contains a brief knowledge on Introduction, Principle, Laws, Flow representation, Instrumentation, Applications
and Mass spectrometer
- Principle
- Instrumentation
An isotope is one of two or more atoms having the same atomic number but different mass numbers.
Unstable isotopes are called Radioisotopes.
uses of radioisotopes are many which are discussed in this slide.
A spectrophotometer is an instrument that measures the amount of light absorbed by a sample. Spectrophotometer techniques are used to measure the concentration of solutes in solution by measuring the amount of the light that is absorbed by the solution in a cuvette placed in the spectrophotometer .
It is the most common analytical technique used in biochemical estimation in clinical laboratory.
It involves the quantitative estimation of color.
A substance to be estimated colorimetrically, must be colored or it should be capable of forming chromogens (colored complexes) through the addition of reagents.
Introduction, Principle, Instrumentation and Applications of SDS-PAGEMohammed Mubeen
The following presentation contains helpful information regarding SDS-PAGE, including the history, introduction, principle, instrumentation, advantages and applications of SDS-PAGE.
An electron gun generates an electron beam that is interacting with a slow-wave structure.
It sustains the oscillations by propagating a traveling wave backwards against the beam
. The generated electromagnetic wave power has its group velocity directed oppositely to the direction of motion of the electrons.
The output power is coupled out near the electron gun.
OES is the reference analysis technique for elemental analysis of solid metallic samples . that uses the light emitted of an excited element and (PMT) convert the light in an electrical signal. that can be read by the instrument computer and the software
http://www.redicals.com
The spectrophotometer technique is to measures light intensity as a function of wavelength.
• Measures the light that passes through a liquid sample
• Spectrophotometer gives readings in Percent Transmittance (%T) and in Absorbance (A)
Spectrophotometer instrumentation & working Sabahat Ali
Spectrophotometric analysis is a technique to measure the concentration of solute solution by measuring the amount of light absorbed by solution.
Absorption can be calculated in terms of transmittance by using Beer's Lambert law.
Visible Spectrophotometry and Colorimetry.pptxNeetuSoni21
Visible Spectrophotometry and Colorimetry.pptx
Color comparison was one of the oldest methods used for quantitative
estimation of elements and substances. The variation of a color of a system with change
in concentration of some components forms the basis of colorimetric analysis. The color
is usually due to the formation of a colored compound by the addition of an appropriate
reagent at specific condition or it may be inherent in the desired constituent itself. The
intensity of the color may then be compared with that obtained by treating a known
amount of the substance in the same manner. Colorimetry is concerned with the
determination of the concentration of a substance by measurement of the relative
absorption of light with respect to a known concentration of a substance. In visual
colorimetry, natural or artificial white light.
Welcome to TechSoup New Member Orientation and Q&A (May 2024).pdfTechSoup
In this webinar you will learn how your organization can access TechSoup's wide variety of product discount and donation programs. From hardware to software, we'll give you a tour of the tools available to help your nonprofit with productivity, collaboration, financial management, donor tracking, security, and more.
Synthetic Fiber Construction in lab .pptxPavel ( NSTU)
Synthetic fiber production is a fascinating and complex field that blends chemistry, engineering, and environmental science. By understanding these aspects, students can gain a comprehensive view of synthetic fiber production, its impact on society and the environment, and the potential for future innovations. Synthetic fibers play a crucial role in modern society, impacting various aspects of daily life, industry, and the environment. ynthetic fibers are integral to modern life, offering a range of benefits from cost-effectiveness and versatility to innovative applications and performance characteristics. While they pose environmental challenges, ongoing research and development aim to create more sustainable and eco-friendly alternatives. Understanding the importance of synthetic fibers helps in appreciating their role in the economy, industry, and daily life, while also emphasizing the need for sustainable practices and innovation.
We all have good and bad thoughts from time to time and situation to situation. We are bombarded daily with spiraling thoughts(both negative and positive) creating all-consuming feel , making us difficult to manage with associated suffering. Good thoughts are like our Mob Signal (Positive thought) amidst noise(negative thought) in the atmosphere. Negative thoughts like noise outweigh positive thoughts. These thoughts often create unwanted confusion, trouble, stress and frustration in our mind as well as chaos in our physical world. Negative thoughts are also known as “distorted thinking”.
The Indian economy is classified into different sectors to simplify the analysis and understanding of economic activities. For Class 10, it's essential to grasp the sectors of the Indian economy, understand their characteristics, and recognize their importance. This guide will provide detailed notes on the Sectors of the Indian Economy Class 10, using specific long-tail keywords to enhance comprehension.
For more information, visit-www.vavaclasses.com
The French Revolution, which began in 1789, was a period of radical social and political upheaval in France. It marked the decline of absolute monarchies, the rise of secular and democratic republics, and the eventual rise of Napoleon Bonaparte. This revolutionary period is crucial in understanding the transition from feudalism to modernity in Europe.
For more information, visit-www.vavaclasses.com
How to Make a Field invisible in Odoo 17Celine George
It is possible to hide or invisible some fields in odoo. Commonly using “invisible” attribute in the field definition to invisible the fields. This slide will show how to make a field invisible in odoo 17.
Model Attribute Check Company Auto PropertyCeline George
In Odoo, the multi-company feature allows you to manage multiple companies within a single Odoo database instance. Each company can have its own configurations while still sharing common resources such as products, customers, and suppliers.
Palestine last event orientationfvgnh .pptxRaedMohamed3
An EFL lesson about the current events in Palestine. It is intended to be for intermediate students who wish to increase their listening skills through a short lesson in power point.
1. PRINCIPLES AND APPLICATION OF SPECTROPHOTOMETRY IN DISEASE DIAGNOSIS
Absorption : UV/Visible/IR
• Certain molecules absorb light in a characteristic way: helps
to identify and quantify biological molecules
• Absorption occurs when the energy contained in a photon is
absorbed by an electron resulting in a transition to an excited
state
• The absorption efficiency of an analyte is affected by: The
nature of the analyte, number of available microstates, The
solvent
• Absorption spectroscopy: Bioanalytical methods; signal
intensity is directly proportional to the concentration
2. • Pigment Chlorophyll- which absorbs light;
in the blue and red region of the visible light
spectrum.
• For this reason, leaves are- green (because
they reflect green).
• If Leaf is extracted in an organic solvent, the
leaf extract (containing the solute chlorophyll)
with a high chlorophyll content will produce:
dark green colour
• A leaf extract with a low chlorophyll content
will yield a pale green extract.
Spectrophotometry is
• a mean of measuring how densely green
the solution is.(concentration)
3. SPECTROSCOPY / SPECTROCHEMICAL ANALYSIS.
The study how the chemical compound interacts with
different wavelenghts in a given region of electromagnetic
radiation
Spectrophotometry : Quantitative measurement of the
reflection or transmission properties of a material as a
function of wavelength.; Involves the use of a
spectrophotometer.
SPECTROPHOTOMETER : The combination of two devices, a
spectrometer and a photometer.
•A device that is used to measure intensity of light as a function
of the wavelength of light.
• An instrument that measures the amount of light of a specified
wavelength that passes through (is transmitted through) a sample
(medium)
6. SPECTROPHOTOMETE
Spectrometer: for producing light of any selected wavelength or color
Photometer: used for measuring the intensity of light.
Rx i t s l i t
The two devices are placed at either side of a cuvette filled with a liquid
E
E n tr a n c e s lit D e te c to r
Red I0 I
R eadout
d e v ic e
I0= radiant power arriving at the cuvette a = absorptivity of the sample (extinction coefficient)
P r is m L = length of the path through the sample C
I = radiant power leaving the cuvette
V io le tc = concentration vof the absorbing substance
C u e tte
L ig h t s o u r c e M o n o c h ro m a to r
7. PRINCIPLES : Spectroscopy:
Deals with the production, measurement, and
interpretation of spectra arising from the
interaction of electromagnetic radiation with
matter.
Electromagnetic spectrum of energy: the gamma
rays (wavelengths < 0.1 nanometres) to radio
waves (wavelengths > 250 millimetres.)
Spectroscopy deals with :
the ultraviolet (180 to 380nm)
the visible (380 to 800nm)
the infrared (0.8 to 50 micrometres).
8.
9. Colors & Wavelengths
COLOR WAVELENGTH (λ in nm)
Ultraviolet < 380
Violet 380 – 435
Blue 436 – 480
Greenish-blue 481 – 490
Bluish-green 491 – 500
Green 501 – 560
Yellowish-green 561 – 580
Yellow 581 – 595
Orange 596 – 650
si V
Red 651 – 780
Near Infrared > 780
10. SPECTROPHOTOMETRY COLORIMETRY
• A photometer (a device for • The measurement of color
measuring light intensity) • Any technique used to evaluate an
• Measure intensity as a unknown color in reference to
function of the color, or more known colors
specifically, the wavelength of
light • It determines color based on the red,
• Tungsten or xenon flashlamp blue, and green components of light
absorbed by the object or sample,
as the source of white light
• Tungsten lamp for
• Colored light beam through an
measurements in visible
optical filter, which transmits only
region(360-900nm)
one particular color / band of
• Hydrogen /deuterium lamp wavelengths of light to the
for UV region(200-380nm) photodectector
11. Spectroscopy and Spectrophotometry
• Light can either be transmitted or absorbed by dissolved
substances
• Presence & concentration of dissolved substances is analyzed
by passing light through the sample
• Spectroscopes measure electromagnetic emission
• Spectrophotometers measure electromagnetic absorption
• Principle: Based on Beer Lambert’s LAW
12. Spectrometer produces the light of desired wavelength and it
passes through the tube and reaches photometer that measures its
intensity.
Then the photometer produces a voltage signal to a display
device, usually a galvanometer.
As the amount of light absorbed by the liquid changes; the
signal also changes.
The concentration of a substance in solution can be measured by
calculating the amount of absorption of light at the appropriate
wavelength or a particular colour
Reading of Spectrophotometer: (Number)- Absorbance that is
directly proportional to the color intensity, and also the
concentration of the species responsible for the color.
13. • To use absorbance for analytical purposes, a calibration
curve must be generated by measuring the absorbance
of several solutions that contain known concentrations of
analyte.
If development of color is linked to the concentration of
a substance in solution then: That concentration can be
measured by determining the extent of absorption of
light at the appropriate wavelength.
For example : Hemoglobin appears red
• Hemoglobin absorbs blue and green light rays much
more effectively than red.)
• Thus, The degree of absorbance of blue or green light is
proportional to the concentration of hemoglobin.
14. Terms:/Parameters
Transmittance : The passing of light through a sample
Absorbance: Amount of light absorbed by a sample (the
amount of light that does not pass through or reflect off
a sample)
%Transmittance: The manner in which a
spectrophotometer reports the amount of light that
passes through a sample
Absorbance units: A unit of light absorbance
determined by the decrease in the amount of light in a
light beam
Absorbance spectrum: A graph of a sample’s
absorbance at different wavelengths
Lambdamax: The wavelength that gives the highest
absorbance value for a sample
15. Absorption: The Beer-Lambert Law
August Beer (1825-1863): Added
absorption co-efficient and related to
conc. in solution.
Pierre Bouguer
Johan Lambert
Astronomer: Light
Mathematician, first to
is diminished as it
prove that π is irrational.
passes through the
No absorption coefficient
atmosphere.
A = − log( I1 / I 0 ) = εcl
€: Extinction coefficient
c: Concentration l : Path length
16. BEER–LAMBERT’S LAW
(Beer–Lambert–Bouguer law)
• Relates the absorption of light to the properties of the material
through which the light is travelling.
BEER'S LAW
• When monochromatic light (light of a specific wavelength) passes
through a solution there is usually a quantitative relationship
between the solute concentration and the intensity of the
transmitted light
• The amount of light absorbed by the a medium ( solution/ sample)
is proportional to the concentration of the absorbing material or
solute present.
• Thus the concentration of a coloured solute in a solution may
be determined in the lab by measuring the ABSORBANCY OF
LIGHT AT A GIVEN WAVELENGTH
17. BEER–LAMBERT’S LAW (Beer–Lambert–Bouguer law)
….contd
LAMBERT'S LAW
o Lambert described how intensity changes
with distance in an absorbing medium.
o The amount of light absorbed by the a
medium ( solution/ sample) at a given
wavelength is proportional to thickness of the
absorbing layer: path length of the light
18. Beer – Lambert Law
States that the Absorbance (O.D) of a solution is
directly proportional to the concentration of the
absorbing species in the solution and the path
length.
The fraction of the incident light absorbed by a solution at a given wavelength is
related to
a. thickness of the absorbing layer (path length) and
b. concentration of the absorbing species
19. Transmittance
Defined as the ratio of the intensity of light emerging from the
solution (I) to that of incident light entering (Io)
There is a logarithmic dependence between the transmission (or
transmissivity), T, of light through a substance and
The product of : the absorption coefficient of the substance, α,
and the distance the light travels through the material (i.e. the
path length), ℓ.
• The ABSORPTION COEFFICIENT: (α ) =
Molar absorptivity (extinction coefficient) of the absorber, (c)
X the concentration (c) of absorbing species in the material
I0 : intensity(power) of the incident light I : intensity(power) of the
transmitted light ; ℓ : . thickness of the absorbing layer (path length) and
cross section of light absorption by a single particle;
20. T- Transmittance
I
T= I0 - Original light intensity
I0
I- Transmitted light intensity
I
% Transmittance (T)= 100 x
I0
1
Absorbance (A) = Log
T
(OPTICAL DENSITY)
I0
= Log I = KCL
I0
Log I is proportional to : C (concentration of
solution) and L (length of light path through the
solution).
21. By definition of the Beer - Lambert Law.
α = εc
A=α ℓ
A = ECL
A = Transmission/Transmissivity ; expressed in terms
of Absorbance (numerical number only)- (OPTICAL
DENSITY)
E = Molar Extinction Coefficient of the absorber (ε)-
Extinction Coefficient of a solution containing 1g
molecule of solute per 1 liter of solution
C = concentration of solution ( C; moles per unit
vol) L= length of light path through the solution (ℓ ; )
22. IMPLICATIONS OF BEER-LAMBERTS LAW
• The absorbance (A) becomes linear with the
concentration ( C; number density of absorbers)
• Thus, if the path length and the Molar absorptivity ae
known; & the absorbance is measured: The
concentration of the substance (or the number
density of absorbers) can be obtained.
• As Concentration (C) increases, light Absorption
(A) increases, LINEARLY
• As Concentration (C) increases, light
Transmission (T) decreases: EXPONENTIALLY
(INVERSLY)
26. COMPONENTS OF SPECTROPHOTOMETER
1. Light source(UV and visible)
2. Optical system/Wavelength selector
(Monochromator)
3. Sample containers
4. Detector
5. Output: Signal processor and readout
27. SPECTROPHOTOMETER
E x it s lit
E n tr a n c e s lit D e te c to r
Red I0 I
R eadout
d e v ic e
P r is m
V io le t C u v e tte
I0= radiant power arriving at the cuvette a = absorptivity of the sample (extinction coefficient)
L = length of the path through the sample C
I = radiant power leaving the cuvette c = concentration of the absorbing substance
L ig h t s o u r c e M o n o c h ro m a to r
28. WORKING OF SPECTROPHOTOMETER
• White light radiation source that passes through a MONOCHROMATOR ( prism
or a diffraction grating that separates the white light into all colors of the
visible spectrum) .
• After the light is separated, it passes through a FILTER (to block out unwanted
light, sometimes light of a different color) and a SLIT (to narrow the beam of
light).
• Next the beam of light passes through the SAMPLE that is in the sample
holder.(cuvette)
• The light passes through the sample and the unabsorbed portion (reflected)
strikes a PHOTODETECTOR that produces an electrical signal which is
proportional to the intensity of the light.
• The signal is then converted to A READABLE OUTPUT (absorbance )that is
used in the analysis of the sample.
• Calibration curve : generated by measuring the absorbance of several
solutions that contain known concentrations of analyte.
•
29. COMPONENTS OF SPECTROPHOTOMETER
1. LIGHT SOURCE
• Deuterium Lamps - Continuous spectrum in the ultraviolet region is
produced by electrical excitation of deuterium at low pressure. (160nm-
375nm)
• Tungsten Filament Lamps - the most common source of visible and
near infrared radiation ( at wavelength 320 to 2500 nm)
• Hydrogen Gas Lamp and Mercury Lamp, Xenon (wavelengths from
200 to 800 nm)- in UV Spectrophotometer
• Silicon Carbide (SiC) Rod : Radiation at wavelengths:1200 -40000
nm
• NiChrome wire (750 nm to 20000 nm); ZrO2 (400 nm to 20000 nm)
– for IR Region:
• Laser: Used when high intensity line source is required
30. OPTICAL SYSTEM/WAVELENGTH SELECTOR
MONOCHROMATOR
• Optical device
• Disperses a beam of
light into its E x it s lit
component
wavelengths E n t r a n c e s lit D e te c to r
• Allows only a narrow
band of wavelengths to Red I0 I
pass R eadout
• Blocks all other d e v ic e
wavelengths
1. An entrance slit
2.I =A collimating lens P r is m
a = absorptivity of the sample (extinction coefficient)
0 radiant power arriving at the cuvette C u v e tte
(concave) L = length of the patht through the sample C
V io le
I = radiant power leaving the cuvette c = concentration of the absorbing substance
3. A dispersing device
(usually a prism or a
grating) L ig h t s o u rc e M o n o c h ro m a to r
4. A focusing lens
5. An exit slit
31. MONOCHROMATOR
•Czerny-Turner setup
• AS A FILTER: It will select a narrow portion of the spectrum
(the bandpass) of a given source.
• IN ANALYSIS: the monochromator will sequentially select
for the detector to record the different components
(spectrum) of any source or sample emitting light.
• Mirror collimates light (parallel rays)
• Gating disperses light ( Prisms were formerly used)
• Light coming through entrance slit is polychromatic
• Light out of exit slit is monochromatic
32. CUVETTES ( SAMPLE CONTAINERS)
• The containers for the sample- usually plastic or quartz:
• Reference solution must be transparent to the radiation which will
pass through them.
• Quartz or fused crystalline silica cuvettes for UV spectroscopy .
• Glass cuvettes for Visible Spectrophotometer
• NaCl and KBr Crystals for IR wavelengths
33. Cell Types I AND II
Open-topped rectangular standard cell (a)
34. • The photomultiplier tube (In UV-Vis spectroscopy)
Consists of :
Detectors
• A photoemissive cathode (a cathode which emits electrons
when struck by photons )
• Several dynodes (which emit several electrons for each
electron striking them)
• An anode.
• Produces an electric signal proportional to the radiation
intensity
• Signal is amplified and made available for direct display
• A sensitivity control amplifies the signal
• Examples: Phototube (UV); Photomultiplier tube (UV-Vis);
Thermocouple (IR); Thermister (IR)
36. 5. OUTPUT: SIGNAL PROCESSOR AND READOUT
(DISPLAY DEVICE)
DISPLAY DEVICE (Output device)
• Consist of a moving–coil meter or a pen
recorder displaying % transmission (%T).
• At present: Instrument control, operation,
standardization and data processing or
storage: carried out by a microcomputer or
microprocessor built in or interfaced to it.
37. Steps in working with spectrophotomoter
When warming up the spectrophotometer, there should be no cuvettes in the
machine
Preparation of samples
A series of standard solutions of known concentration
Set spectrophotometer to wavelength of maximum light absorption
• Measure light absorbance of standards
Set the % transmittance of light as 0%
In the sample space, lodge a cuvette, filled with solvent and close the sample
space.
Set the transmittance at 100%
For comparing, fill the cuvette with sample and place it in sample space and
close the sample space.
Note down the reading on the Photometer for calculations.
Plot standard curve: Absorbance vs. Concentration
Calculating the concentration of sample using Beer Lambert Equation:
A = ECL
40. DIFFERENT TYPES OF SPECTROPHOTOMETERS
Classification Based on:
Different measurement techniques Differ with respect to the
species to be analysed (such as molecular or atomic spectroscopy)
The sources of intensity variation: Type of radiation-matter
interaction to be monitored (such as absorption, emission, or
diffraction)
The region of the electromagnetic spectrum (The wavelengths
they work with )used in the analysis
· Based on the absorption or emission of radiation, in the
ultraviolet (UV), visible (Vis), infrared (IR), and radio (nuclear
magnetic resonance, NMR) frequency ranges are most commonly
encountered
41. TYPES AND APPLICATIONS OF SPECTROPHOTOMETER
• Primarily used for QUANTITATIVE Analysis
of Known Compounds
42. Tissue absorption
Major tissue absorbers include: Hemoglobin, lipids (beta carotene), melanin, water,
proteins, blood components, body fluids
Oxy and deoxy hemoglobin have distinct spectra. Optical measurements can provide
information on tissue oxygenation, oxygen consumption, blood hemodynamics
43. APPLICATIONS OF SPECTROPHOTOMETER
Forensic sciences.
Molecular biology: in measuring the growth of micro
organisms like bacteria.
UV-Vis : Most Popular in Pharmaceutical, Foods and
Paints Industries, Water Laboratories
In Disease diagnosis/ Pathological states (changes):
detected by the analysis of various samples.,taken from
the body : are analyzed in three different areas –
Chemistry, Hematology and Microbiology section
Blood (the blood plasma, and the formed elements – the
blood cells )- The most common substance for analysis
44. TYPES AND APPLICATION OF SPECTROSCOPY…contd
Types of Spectroscopy
Absorption Spectroscopy :
The power of a beam of light measured before and after
interaction with a sample is compared.
Specific absorption techniques tend to be referred to by the
wavelength of radiation measured such as ultraviolet, infrared or
microwave absorption spectroscopy
Absorption occurs when the energy of the photons matches the
energy difference between two states of the material.
The absorption of ultraviolet radiation by molecules is
dependent upon the electronic structure of the molecule. So the
ultraviolet spectrum is called electronic spectrum
45. Ultraviolet Spectroscopy
All atoms absorb in the Ultraviolet (UV) region because these
photons are energetic enough to excite outer electrons.
Used in quantifying protein and DNA concentration, the ratio of
protein to DNA concentration in a solution; Amino Acids
(aromatic), Pantothenic Acid, Glucose Determination and Enzyme
Activity (Hexokinase)
Several amino acids usually found in protein, such as tryptophan,
absorb light in the 280 nm range and DNA absorbs light in the
260 nm range. (Ratio of 260/280 nm absorbance- general indicator
of the relative purity of a solution)
Used as a detector for high performance liquid chromatography
(HPLC). The presence of an analyte gives a response which can be
assumed to be proportional to the concentration
46. Visible Spectroscopy
Many atoms emit or absorb visible light.
In order to obtain a fine line spectrum, the atoms must be in
a gas phase.
This means that the substance has to be vaporised.
The spectrum is studied in absorption or emission.
Often combined : UV absorption spectroscopy in UV/Vis
spectroscopy.
spectroscopy
Applications- Estimation of : Niacin, Pyridoxine, Vitamin
B12, Metal Determination (Fe), Fat-quality Determination
(TBA) and Enzyme Activity (glucose oxidase)
47. Infrared Spectroscopy
• The IR spectral region Further subdivided into ; near-infrared
(NIR), mid-infrared (MIR), and far-infrared (FIR) based on
wavelength.
• The MIR region : most familiar to the organic chemist as
offers the possibility to measure different types of
interatomic bond vibrations at different frequencies.
• In organic chemistry the analysis of IR absorption spectra
shows types of bonds are present in the sample.
• IR-based methods: Most common clinical analytical tests,
those involving serum, whole blood, and urine.; fluids that
are less commonly assayed (e.g. saliva and amniotic fluid)
48. Near /Mid Infrared Spectroscopy
• Near Infrared Spectroscopy : NIRange, immediately beyond the
visible wavelength range, -Much greater penetration depth into the
sample than in the case of mid IR spectroscopy range.
• Allows large samples to be measured in each scan
• Practical applications : Medical diagnosis,,
pharmaceuticals/medicines, biotechnology, genomics analysis,
proteomic analysis, interatomics research, inline textile monitoring,
food analysis and chemical imaging/hyperspectral imaging of intact
organisms, agricultural: rapid grain analysis; insect detection
• Forensic lab application, crime detection and various military
applications.
• To identify changes in biofluid metabolite concentrations reflecting
site and mechanism-specific toxicity, to define novel indices of toxic
insult, to evaluate control data, to monitor disease progression and
response to therapeutic intervention and to track progression and
regression of toxin-induced lesions over a time period
49.
50. X-Ray Spectroscopy
• When X-rays of sufficient frequency (energy) interact with a
substance, inner shell electrons in the atom are excited to
outer empty orbitals, or they may be removed completely,
ionizing the atom.
The inner shell "hole" will then be filled by electrons from
outer orbitals.
The energy available in this de-excitation process is emitted
as radiation (fluorescence) or will remove other less-bound
electrons from the atom (Auger effect).
The absorption or emission frequencies (energies) are
characteristic of the specific atom.
Used in chemistry and material sciences to determine
elemental composition and chemical bonding.
51. Atomic Absorption Spectroscopy -
Uses a pre-burner nebulizer (or nebulizing chamber) to
create a sample mist and a slot-shaped burner that
gives a longer path length flame.
The nebulizer and flame are used to desolvate and
atomize the sample, but the excitation of the analyte
atoms is done by the use of lamps shining through the
flame at various wavelengths for each type of analyte.
The amount of light absorbed after going through the
flame determines the amount of analyte in the sample.
A graphite furnace for heating the sample to desolvate
and atomize is commonly used for greater sensitivity.
Good sensitivity and selectivity: Used for trace
elements in aqueous (and other liquid) samples.
52. Photo Emission Spectroscopy
Photoelectron spectroscopy
Refers to energy measurement of electrons emitted
from solids, gases or liquids by the photoelectric effect,
in order to determine the binding energies of electrons in
a substance.
Various techniques, depending on whether the
ionization energy is provided by an X-ray photon or an
ultraviolet photon.
53. Mass Spectroscopy
• Unique among the various techniques
• Mass spectrometry: Highly sensitive detection and
identification technique, allowing determination of molecular
structures, and thus of a sample’s composition
• Weigh atoms, molecules, cluster, nano-particle, virus, cell
and etc. In general, it can only determine mass (mass-to-
charge ratio (M/Z) for a particle in gas phase.)
• .For most mass spectrometers, Z is equal to 1 so that mass
can be determined
• Involves the interaction of electromagnetic radiation or some
form of energy with molecules.
• The molecules absorb the radiation and produce a spectrum : during
absorption process or as the excited molecules return to the ground state.
54. Mass Spectrometry
The Components of a Mass Spectrometer
1. Ion Source
2. Analyser
3. Detector
4. Data
55. Mass Spectrometry
Provides Information on
1. Molecular Mass
2. Molecular Structure (fragmentation)
3. Elemental composition
56. MS Applications
Non-biomedical
• Pollutant Analysis
• Trace Metal Analysis
• Explosive Analysis
• Illegal Drug Detection
• Alcohol Analysis
• Organic Chemical Analysis
• Inorganic Chemical Analysis
Biomedical
• Proteomic Analysis
• DNA sequencing
• DNA fingerprinting for Forensic Applications
• Biomolecule structure analysis
• Polysaccharide Analysis
• Metabolomic Analysis and Pharmacological Applications
57. Mass Spectrometry
Hyphenated techniques; GC-MS
GC (Gas Chromatograph)
Excellent in separation and quantitation
Poor in identification
MS (Mass Spectrometer)
Excellent in identification and quantitation
Poor in separation
GC-MS Excellent in separation, identification and
quantitation!
58. Raman Spectroscopy
• Interactions between matter and electromagnetic radiation also
give rise to scattering processes, such as elastic scattering, and
inelastic scattering
• It relies on inelastic scattering, or Raman scattering, of
monochromatic light, usually from a laser in the visible, near
infrared, or near ultraviolet range.
• The laser light interacts with molecular vibrations, phonons or
other excitations in the system, resulting in the energy of the
laser photons being shifted up or down.
• The shift in energy gives information about the phonon modes
in the system.
• This process,it takes place with no change in frequency
• for the radiation forming the beam involved.
• To study vibrational, rotational, and other low-frequency
59. Nuclear Magnetic Resonance Spectroscopy
• Analyses the magnetic properties of
certain atomic nuclei to determine different
electronic local environments of hydrogen,
carbon, or other atoms in an organic
compound or other compound
• Used to determine the structure of the
compound.
60. APPLICATIONS OF NMR IN MEDICINE
BRAIN
Distinguishing gray matter & white matter
Imaging posterior fossae, brain stem, spinal cord
Detect demyelinating lesions, tumors, hemorrhages, infarctions
ABDOMEN
1. Metabolic liver disease
2. Measures liver iron over load in hemochromatosis
3. Focal areas of inflammation in chronic active hepatisis
KIDNEYS
Distinguishing renal cortex & medulla
To evaluate transplanted kidney
PELVIS
Differentiates between BPH & prostatic carcinoma
Detects bladder tumours
HEART
o Tomographic images of heart muscle, chambers, valvular structures
o Discrimination between infarcted, ischemic & normal myocardium
o
Editor's Notes
The presence and concentration of various substances dissolved in a water sample is commonly analyzed by passing different types of light (visible, infrared, or UV) through the sample. Light can either be transmitted or absorbed by the dissolved substances.