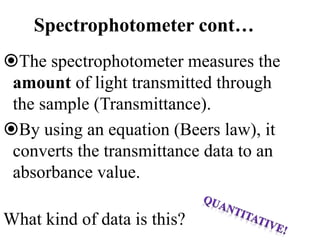
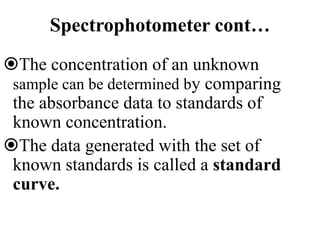
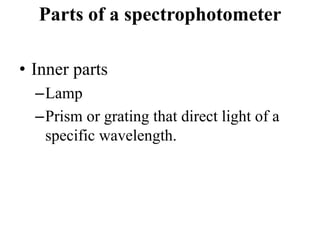
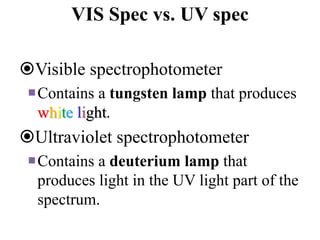
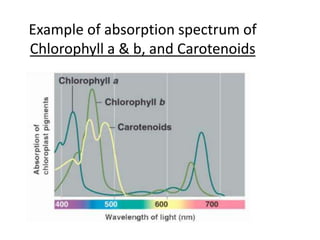
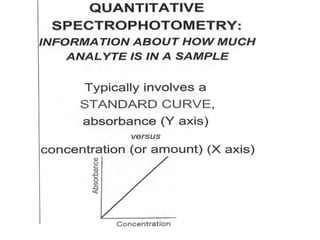
SlideShare a Scribd company logo
Spectrophotometer
BCH-503
Spectrophotometric Analysis
• Spectrophotometric techniques are used to measure
the concentration of solutes in solution by measuring the
amount of light that is absorbed by the solution in a
cuvette placed in the spectrophotometer.
• The spectrophotometer can measure the amount of
light or electromagnetic radiation (of certain frequency)
transmitted or absored by the solution.
Absorption of Radiant Energy
Wave-particle Nature of Radiant energy:
Light and other forms of radiant energy have a dual nature (wave
and particle)
Electromagnetic radiation is a type of energy that is transmitted
through space as a transverse wave at enormous velocity.
It takes numerous forms known as electromagnetic spectrum.
The electromagnetic spectrum include gamma ray, X-ray,
ultraviolet (UV), visible, infrared (IR), microwave and radio-wave
radiation.
Wave motion of light
Wave Properties
The wave is described either in terms of its wavelength (l),the distance
between successive maxima or minima of a wav(nm), or in terms of the
frequency(n), the number of oscillation of the field per second.
The velocity of light, c, is given by the equation:
C= n l
Particle properties
Electromagnetic radiation of light can be viewed as a stream of
discrete wave packets of distinct particles called photons.
The energy E of photon depends upon the frequency of the
radiation
E = hn
Therefore:
h = Planck’s constant (6.626 x 10⁻³⁴ J s)
n = frequency of the radiation (most common units = cm-1
Energy is inversely proportional to wavelength
• The ultraviolet region extends from about 10 to 380 nm
•The most analytically useful region is from 200 to 380
nm, called the near- ultraviolet region or quartz UV region.
• The visible (VIS) region extends from about 380 to
780nm.
•The infrared (IR) region extends from about 0.78μm to
300 μm.
•The near-infrared (IR) region extends from about 0.80μm
to 2.5 μm.
•The far-infrared (IR) region extends from about 2.5μm to
16 μm.
The electromagnetic spectrum
Regions of Electromagnetic Spectrum-the “colour” of light
The absorption process
How does matter absorb radiation
When polychromatic light (white light), which contains the
whole spectrum of wavelengths in visible region, is passed
though an object will absorb certain of the wavelengths, leaving
the unabsorbed wavelengths to be transmitted. These residual
transmitted wavelengths will be seen as a color. This color is
complementary to the absorbed colors.
Absorption is a process in which chemical species (atom, ion or molecule)
in a transparent medium selectively attenuate certain frequencies of EMR.
Absorption spectrum is a plot of the amount of light absorbed by
a sample as a function of wavelength.
At room temperature most substance are in their lowest energy or
ground state. When an atom, molecule or ion absorbs EMR it is
promoted to higher energy states or excited states.
The excited state is a transition one and the species soon looses
the energy it gained and returns to its ground state by relaxation
process either as heat of collision or sometimes emits radiation of
specific wavelength.
Ground state
First Excitation state
Second Excitation state
E2
E1
E0
hv1
hv2
• When a molecule interacts with photons of UV or VIS
radiation excitation of electrons takes place to higher
electronic energy level at any of its vibrational level.
• Eex-Eg= hn of the photon absorbed.
• UV / VIS radiation cause electronic transition which is
accompanied by vibrational and rotational.
• If the compound subjected to IR radiation vibrational and
rotational transitions in ground state occure.
• Rotational transitions alone can be brought about by microwave.
• Ultraviolt and visible radiations have sufficient energy to cause
transitions of the outermost or valence electrons.
• If large amount of energy is absorbed by certain substance, bonds may
be ruptured and new compounds are formed photolysis.
This may occur upon absorption of far Ultraviolt as its energy is
sufficiently high to exceed the energy of formation of certain bonds.
• The total energy of a molecule is given by
Etotal=Eelectronic+Evibrational +Erotational
Two methods to detect molecules:
Indicator – Quickest method.
Indicator solutions change colors when a
molecule of interest is present.
Allows scientist to detect colorless
molecules in a solution.
Examples: Bradford protein reagent
Diphenylamine (DPA) or
Biuret (NaOH+CuSO4).
What kind of data is this?
Two methods to detect molecules:
• Spectrophotometer (Spec)
–An instrument that measures the
amount of light that passes through (is
transmitted through) a sample.
Spectrophotometer cont…
–Uses a type of light to detect
molecules in a solution
–Light is a type of energy, and the
energy is reported as wavelengths,
in nanometers (nm).
Two different types of Spectrophotometer:
Ultraviolet (UV) Spectrophotometers.
Uses ultraviolet light of wave lengths from
200 nm to 350 nm.
Visible (VIS) Light Spectrum
Spectrophotometers.
Uses visible light (white light) of wave
lengths from 350 nm to 700 nm.
The visible light spectrum
R O Y G B I V
Spectrophotometer cont…
• Shines a beam of light on a sample.
• The molecules in the sample interact with
the light waves in of 3 ways:
–Absorb the energy
–Reflect the energy
–Transmit the energy between and
through the atoms and molecules of the
sample.
How a spectrophotometer works:
Consider blue molecules, all the
wavelengths of light are absorbed, except
for the blue ones.
The blue wavelengths are transmitted or
reflected off the molecules. If these blue
wavelengths hit a detector (such as in the
spectrophotometer or the nerve cells in
your eye), they appear blue.
How a spectrophotometer works:
• Molecules are whatever color of
light that they do not absorb.
• Green molecules appear green
because they absorb most
wavelengths of visible light, except
the green wavelengths.
Spectrophotometer cont…
The spectrophotometer measures the
amount of light transmitted through
the sample (Transmittance).
By using an equation (Beers law), it
converts the transmittance data to an
absorbance value.
What kind of data is this?
Spectrophotometer cont…
The concentration of an unknown
sample can be determined by comparing
the absorbance data to standards of
known concentration.
The data generated with the set of
known standards is called a standard
curve.
Parts of a spectrophotometer
• Inner parts
–Lamp
–Prism or grating that direct light of a
specific wavelength.
VIS Spec vs. UV spec
Visible spectrophotometer
Contains a tungsten lamp that produces
white light.
Ultraviolet spectrophotometer
Contains a deuterium lamp that
produces light in the UV light part of the
spectrum.
Parts of a Spectrophotometer
• Outer parts:
Sample Holder
Display
Knobs or buttons used to calibrate the
spec to measure the designated molecule.
Wavelength
Selection
How a spectrophotometer works:
Visible Spectrophotometer
White light hits the prism or grating, it is
split into the colors of the rainbow
(Visible Spectrum).
The wavelength knob rotates the
prism/grating, directing different color
of light toward the sample.
How a spectrophotometer works:
• The wavelength of light produced by the
tungsten lamp range from about 350 nm
(Violet light) to 700 nm (red light).
• The molecules in the sample either
absorb or Transmit the light energy of
one wavelength or another.
How a spectrophotometer works:
• The detector measures the amount of
light being transmitted by the sample
and reports that value directly (%
transmittance) or converts it to the
amount of light absorbed in absorbance
units (au) using Beers Law.
A = 2 – log10%T
Absorption Spectrum
• After collecting data for your
concentration an absorption
spectrum graph is created.
• These can be used when attempting
to identify unknown substances (e.g.
CSI)
Example of absorption spectrum of
Chlorophyll a & b, and Carotenoids
The relationship of concentration in a
solution:
The concentration of molecules in a
solution affects the solution’s
absorbance.
If there are more molecules in one
solution than in another, than there are
more molecules to absorb the light.
Applications of a spectrophotometer
• Determines the presence and
concentrations of samples.
• Determines the purity of a sample.
• Look at the change of samples over
time.
OVERVIEW OF QUANTITIVE
SPECTROPHOTOMETRY
A. Measure the absorbance of standards
containing known concentrations of the analyte
B. Plot a standard curve with absorbance on the X
axis and analyte concentration on the Y axis
C. Measure the absorbance of the unknown(s)
D. Determine the concentration of material of
interest in the unknowns based on the standard
curve
Spectrophotometer instrumentation & working

More Related Content

What's hot

Spectrophotometry
SpectrophotometrySpectrophotometry
Spectrophotometry
Nandita Kumari
 
Spectrophoto meter
Spectrophoto meterSpectrophoto meter
Spectrophoto meterNasir Nazeer
 
Spectrophotometry
SpectrophotometrySpectrophotometry
Spectrophotometry
sushma93
 
Spectrophotometry in clinical chemistry
Spectrophotometry in clinical chemistrySpectrophotometry in clinical chemistry
Spectrophotometry in clinical chemistry
Ofonmbuk Umoh
 
Photometry and spectrophotometry
Photometry and spectrophotometry Photometry and spectrophotometry
Photometry and spectrophotometry
AnumoluRamyasri
 
Photometry by Dr. Anurag Yadav
Photometry by Dr. Anurag YadavPhotometry by Dr. Anurag Yadav
Photometry by Dr. Anurag Yadav
Dr Anurag Yadav
 
Spectrophotometer introducing
Spectrophotometer  introducingSpectrophotometer  introducing
Spectrophotometer introducing
Ashkan Karimi Alamdari
 
SPECTROPHOTOMETER
SPECTROPHOTOMETERSPECTROPHOTOMETER
SPECTROPHOTOMETER
BalaPollachi
 
Liquid chromatography
Liquid chromatographyLiquid chromatography
Liquid chromatography
Dr.M.Prasad Naidu
 
Spectrophotometer
SpectrophotometerSpectrophotometer
SpectrophotometerAsad Leo
 
Spectrophotometry
SpectrophotometrySpectrophotometry
Spectrophotometry
drarunsingh4
 
Colorimeter and Photometer
Colorimeter and PhotometerColorimeter and Photometer
Colorimeter and Photometer
Burdwan University
 
Fluorescence Microscopy
Fluorescence MicroscopyFluorescence Microscopy
Fluorescence Microscopy
VIVEK KUMAR SINGH
 
Colorimeter pdf
Colorimeter pdfColorimeter pdf
Colorimeter pdf
binaya tamang
 
Colorimeter
ColorimeterColorimeter
Colorimeter
Tapeshwar Yadav
 
Colorimetry
ColorimetryColorimetry
Colorimetry
Furquan Alam
 
Nephlometery
NephlometeryNephlometery
Nephlometery
Musaddaq Hafeez
 
Flame photometer
Flame  photometerFlame  photometer
Flame photometer
revathyreva6
 
Spectrophotometer
SpectrophotometerSpectrophotometer

What's hot (20)

Spectrophotometry
SpectrophotometrySpectrophotometry
Spectrophotometry
 
Spectrophoto meter
Spectrophoto meterSpectrophoto meter
Spectrophoto meter
 
Spectrophotometry
SpectrophotometrySpectrophotometry
Spectrophotometry
 
Spectrophotometry in clinical chemistry
Spectrophotometry in clinical chemistrySpectrophotometry in clinical chemistry
Spectrophotometry in clinical chemistry
 
Colorimetry
ColorimetryColorimetry
Colorimetry
 
Photometry and spectrophotometry
Photometry and spectrophotometry Photometry and spectrophotometry
Photometry and spectrophotometry
 
Photometry by Dr. Anurag Yadav
Photometry by Dr. Anurag YadavPhotometry by Dr. Anurag Yadav
Photometry by Dr. Anurag Yadav
 
Spectrophotometer introducing
Spectrophotometer  introducingSpectrophotometer  introducing
Spectrophotometer introducing
 
SPECTROPHOTOMETER
SPECTROPHOTOMETERSPECTROPHOTOMETER
SPECTROPHOTOMETER
 
Liquid chromatography
Liquid chromatographyLiquid chromatography
Liquid chromatography
 
Spectrophotometer
SpectrophotometerSpectrophotometer
Spectrophotometer
 
Spectrophotometry
SpectrophotometrySpectrophotometry
Spectrophotometry
 
Colorimeter and Photometer
Colorimeter and PhotometerColorimeter and Photometer
Colorimeter and Photometer
 
Fluorescence Microscopy
Fluorescence MicroscopyFluorescence Microscopy
Fluorescence Microscopy
 
Colorimeter pdf
Colorimeter pdfColorimeter pdf
Colorimeter pdf
 
Colorimeter
ColorimeterColorimeter
Colorimeter
 
Colorimetry
ColorimetryColorimetry
Colorimetry
 
Nephlometery
NephlometeryNephlometery
Nephlometery
 
Flame photometer
Flame  photometerFlame  photometer
Flame photometer
 
Spectrophotometer
SpectrophotometerSpectrophotometer
Spectrophotometer
 

Similar to Spectrophotometer instrumentation & working

UV ray spectrophotometer
UV ray spectrophotometerUV ray spectrophotometer
UV ray spectrophotometer
Goa App
 
UV rays
UV rays UV rays
UV rays
Goa App
 
Uv/visible spectroscopy
Uv/visible spectroscopyUv/visible spectroscopy
Uv/visible spectroscopy
SavitaBhatt2
 
Uv
UvUv
UV SPECTROSCOPY ppt.pptx
UV SPECTROSCOPY ppt.pptxUV SPECTROSCOPY ppt.pptx
UV SPECTROSCOPY ppt.pptx
Ashish Hingnekar
 
UV SPECTROSCOPY ppt.pptx
UV SPECTROSCOPY ppt.pptxUV SPECTROSCOPY ppt.pptx
UV SPECTROSCOPY ppt.pptx
AshishHingnekar1
 
Absorbance
AbsorbanceAbsorbance
Absorbance
Yedhu Mohan
 
Biomolecular andcellularresearchdevices fin
Biomolecular andcellularresearchdevices finBiomolecular andcellularresearchdevices fin
Biomolecular andcellularresearchdevices finMUBOSScz
 
Spectroscopy
SpectroscopySpectroscopy
Spectroscopy
Iram Qaiser
 
Fundamentals of Spectrophotometer
Fundamentals of SpectrophotometerFundamentals of Spectrophotometer
Fundamentals of Spectrophotometer
Muhammad Asif Shaheeen
 
UV-Visible spectroscopy
UV-Visible spectroscopyUV-Visible spectroscopy
Mse spectroscopy
Mse spectroscopyMse spectroscopy
Mse spectroscopy
JeminMangukiya1
 
UV-VIS molecular spectroscopy.202004201521035685ranvijay_engg_UV_and_VISIBLE_...
UV-VIS molecular spectroscopy.202004201521035685ranvijay_engg_UV_and_VISIBLE_...UV-VIS molecular spectroscopy.202004201521035685ranvijay_engg_UV_and_VISIBLE_...
UV-VIS molecular spectroscopy.202004201521035685ranvijay_engg_UV_and_VISIBLE_...
abusunabakali
 
spectrophotometry, ultra violet absorption, infra red atomic absorption.
spectrophotometry, ultra violet absorption, infra red atomic absorption.spectrophotometry, ultra violet absorption, infra red atomic absorption.
spectrophotometry, ultra violet absorption, infra red atomic absorption.
priya tamang
 
UV Spectroscopy
UV Spectroscopy UV Spectroscopy
UV Spectroscopy
MdBabulAktar3
 
Spectroscpy methods.pptx
Spectroscpy methods.pptxSpectroscpy methods.pptx
Spectroscpy methods.pptx
SonaliGadge4
 
Spectroscopy.pptx
Spectroscopy.pptxSpectroscopy.pptx
Spectroscopy.pptx
Alisha Shaikh
 
uv -visible spectroscopy
 uv -visible spectroscopy uv -visible spectroscopy
uv -visible spectroscopy
keshav pai
 
New ppt of uv visible
New ppt of uv visibleNew ppt of uv visible
New ppt of uv visible
keshav pai
 

Similar to Spectrophotometer instrumentation & working (20)

UV ray spectrophotometer
UV ray spectrophotometerUV ray spectrophotometer
UV ray spectrophotometer
 
UV rays
UV rays UV rays
UV rays
 
Uv/visible spectroscopy
Uv/visible spectroscopyUv/visible spectroscopy
Uv/visible spectroscopy
 
Uv
UvUv
Uv
 
UV SPECTROSCOPY ppt.pptx
UV SPECTROSCOPY ppt.pptxUV SPECTROSCOPY ppt.pptx
UV SPECTROSCOPY ppt.pptx
 
UV SPECTROSCOPY ppt.pptx
UV SPECTROSCOPY ppt.pptxUV SPECTROSCOPY ppt.pptx
UV SPECTROSCOPY ppt.pptx
 
Absorbance
AbsorbanceAbsorbance
Absorbance
 
Biomolecular andcellularresearchdevices fin
Biomolecular andcellularresearchdevices finBiomolecular andcellularresearchdevices fin
Biomolecular andcellularresearchdevices fin
 
Spectroscopy
SpectroscopySpectroscopy
Spectroscopy
 
Fundamentals of Spectrophotometer
Fundamentals of SpectrophotometerFundamentals of Spectrophotometer
Fundamentals of Spectrophotometer
 
UV-Visible spectroscopy
UV-Visible spectroscopyUV-Visible spectroscopy
UV-Visible spectroscopy
 
Mse spectroscopy
Mse spectroscopyMse spectroscopy
Mse spectroscopy
 
Uv visiblr spectroscopy
Uv visiblr spectroscopyUv visiblr spectroscopy
Uv visiblr spectroscopy
 
UV-VIS molecular spectroscopy.202004201521035685ranvijay_engg_UV_and_VISIBLE_...
UV-VIS molecular spectroscopy.202004201521035685ranvijay_engg_UV_and_VISIBLE_...UV-VIS molecular spectroscopy.202004201521035685ranvijay_engg_UV_and_VISIBLE_...
UV-VIS molecular spectroscopy.202004201521035685ranvijay_engg_UV_and_VISIBLE_...
 
spectrophotometry, ultra violet absorption, infra red atomic absorption.
spectrophotometry, ultra violet absorption, infra red atomic absorption.spectrophotometry, ultra violet absorption, infra red atomic absorption.
spectrophotometry, ultra violet absorption, infra red atomic absorption.
 
UV Spectroscopy
UV Spectroscopy UV Spectroscopy
UV Spectroscopy
 
Spectroscpy methods.pptx
Spectroscpy methods.pptxSpectroscpy methods.pptx
Spectroscpy methods.pptx
 
Spectroscopy.pptx
Spectroscopy.pptxSpectroscopy.pptx
Spectroscopy.pptx
 
uv -visible spectroscopy
 uv -visible spectroscopy uv -visible spectroscopy
uv -visible spectroscopy
 
New ppt of uv visible
New ppt of uv visibleNew ppt of uv visible
New ppt of uv visible
 

More from Sabahat Ali

RECOMBINATION MOLECULAR BIOLOGY PPT UPDATED new.pptx
RECOMBINATION MOLECULAR BIOLOGY  PPT UPDATED new.pptxRECOMBINATION MOLECULAR BIOLOGY  PPT UPDATED new.pptx
RECOMBINATION MOLECULAR BIOLOGY PPT UPDATED new.pptx
Sabahat Ali
 
Good laboratory practices in a pharmaceutical lab 1
Good laboratory practices in a pharmaceutical lab 1Good laboratory practices in a pharmaceutical lab 1
Good laboratory practices in a pharmaceutical lab 1
Sabahat Ali
 
Degradation of PLA at Mesophillic and thermophillic conditions
Degradation of PLA at Mesophillic and thermophillic conditionsDegradation of PLA at Mesophillic and thermophillic conditions
Degradation of PLA at Mesophillic and thermophillic conditions
Sabahat Ali
 
Life cycle Assesment and waste stratigies of PLA
Life cycle Assesment and waste stratigies of PLALife cycle Assesment and waste stratigies of PLA
Life cycle Assesment and waste stratigies of PLA
Sabahat Ali
 
Environmental biodegradation of PLA by Biotic and Abiotic factors
Environmental biodegradation of PLA by Biotic and Abiotic factorsEnvironmental biodegradation of PLA by Biotic and Abiotic factors
Environmental biodegradation of PLA by Biotic and Abiotic factors
Sabahat Ali
 
Energy expenditure and BMR
Energy expenditure and BMREnergy expenditure and BMR
Energy expenditure and BMR
Sabahat Ali
 
Agriculture applications of nanobiotechnology
Agriculture applications of nanobiotechnologyAgriculture applications of nanobiotechnology
Agriculture applications of nanobiotechnology
Sabahat Ali
 
Macronutrients and nutrition
Macronutrients and nutritionMacronutrients and nutrition
Macronutrients and nutrition
Sabahat Ali
 
Poly lactic Acid Biodegradation
Poly lactic Acid BiodegradationPoly lactic Acid Biodegradation
Poly lactic Acid Biodegradation
Sabahat Ali
 
Alzhemier's disease and koraskoff syndrome
Alzhemier's disease and koraskoff syndromeAlzhemier's disease and koraskoff syndrome
Alzhemier's disease and koraskoff syndrome
Sabahat Ali
 
Nerve cells, Nervous communication & its link to the celllular signalling
Nerve cells, Nervous communication & its link to the celllular signallingNerve cells, Nervous communication & its link to the celllular signalling
Nerve cells, Nervous communication & its link to the celllular signalling
Sabahat Ali
 
Peptide Hormones and Catecholamines
Peptide Hormones and CatecholaminesPeptide Hormones and Catecholamines
Peptide Hormones and Catecholamines
Sabahat Ali
 
Membrane Proteins & its types
Membrane Proteins & its typesMembrane Proteins & its types
Membrane Proteins & its types
Sabahat Ali
 
membrane lipids & its types
membrane lipids & its types membrane lipids & its types
membrane lipids & its types
Sabahat Ali
 
Biomembranes (lipids, proteins, carbohydrates)
Biomembranes (lipids, proteins, carbohydrates)Biomembranes (lipids, proteins, carbohydrates)
Biomembranes (lipids, proteins, carbohydrates)
Sabahat Ali
 
cell to cell signalling
cell to cell signallingcell to cell signalling
cell to cell signalling
Sabahat Ali
 
Protein Folding Mechanism
Protein Folding MechanismProtein Folding Mechanism
Protein Folding Mechanism
Sabahat Ali
 
Proetin Tertiary Structure
Proetin Tertiary StructureProetin Tertiary Structure
Proetin Tertiary Structure
Sabahat Ali
 
Restriction digestion
Restriction digestionRestriction digestion
Restriction digestion
Sabahat Ali
 
Polymerase Chain Reaction(PCR)
Polymerase Chain Reaction(PCR)Polymerase Chain Reaction(PCR)
Polymerase Chain Reaction(PCR)
Sabahat Ali
 

More from Sabahat Ali (20)

RECOMBINATION MOLECULAR BIOLOGY PPT UPDATED new.pptx
RECOMBINATION MOLECULAR BIOLOGY  PPT UPDATED new.pptxRECOMBINATION MOLECULAR BIOLOGY  PPT UPDATED new.pptx
RECOMBINATION MOLECULAR BIOLOGY PPT UPDATED new.pptx
 
Good laboratory practices in a pharmaceutical lab 1
Good laboratory practices in a pharmaceutical lab 1Good laboratory practices in a pharmaceutical lab 1
Good laboratory practices in a pharmaceutical lab 1
 
Degradation of PLA at Mesophillic and thermophillic conditions
Degradation of PLA at Mesophillic and thermophillic conditionsDegradation of PLA at Mesophillic and thermophillic conditions
Degradation of PLA at Mesophillic and thermophillic conditions
 
Life cycle Assesment and waste stratigies of PLA
Life cycle Assesment and waste stratigies of PLALife cycle Assesment and waste stratigies of PLA
Life cycle Assesment and waste stratigies of PLA
 
Environmental biodegradation of PLA by Biotic and Abiotic factors
Environmental biodegradation of PLA by Biotic and Abiotic factorsEnvironmental biodegradation of PLA by Biotic and Abiotic factors
Environmental biodegradation of PLA by Biotic and Abiotic factors
 
Energy expenditure and BMR
Energy expenditure and BMREnergy expenditure and BMR
Energy expenditure and BMR
 
Agriculture applications of nanobiotechnology
Agriculture applications of nanobiotechnologyAgriculture applications of nanobiotechnology
Agriculture applications of nanobiotechnology
 
Macronutrients and nutrition
Macronutrients and nutritionMacronutrients and nutrition
Macronutrients and nutrition
 
Poly lactic Acid Biodegradation
Poly lactic Acid BiodegradationPoly lactic Acid Biodegradation
Poly lactic Acid Biodegradation
 
Alzhemier's disease and koraskoff syndrome
Alzhemier's disease and koraskoff syndromeAlzhemier's disease and koraskoff syndrome
Alzhemier's disease and koraskoff syndrome
 
Nerve cells, Nervous communication & its link to the celllular signalling
Nerve cells, Nervous communication & its link to the celllular signallingNerve cells, Nervous communication & its link to the celllular signalling
Nerve cells, Nervous communication & its link to the celllular signalling
 
Peptide Hormones and Catecholamines
Peptide Hormones and CatecholaminesPeptide Hormones and Catecholamines
Peptide Hormones and Catecholamines
 
Membrane Proteins & its types
Membrane Proteins & its typesMembrane Proteins & its types
Membrane Proteins & its types
 
membrane lipids & its types
membrane lipids & its types membrane lipids & its types
membrane lipids & its types
 
Biomembranes (lipids, proteins, carbohydrates)
Biomembranes (lipids, proteins, carbohydrates)Biomembranes (lipids, proteins, carbohydrates)
Biomembranes (lipids, proteins, carbohydrates)
 
cell to cell signalling
cell to cell signallingcell to cell signalling
cell to cell signalling
 
Protein Folding Mechanism
Protein Folding MechanismProtein Folding Mechanism
Protein Folding Mechanism
 
Proetin Tertiary Structure
Proetin Tertiary StructureProetin Tertiary Structure
Proetin Tertiary Structure
 
Restriction digestion
Restriction digestionRestriction digestion
Restriction digestion
 
Polymerase Chain Reaction(PCR)
Polymerase Chain Reaction(PCR)Polymerase Chain Reaction(PCR)
Polymerase Chain Reaction(PCR)
 

Recently uploaded

RNA INTERFERENCE: UNRAVELING GENETIC SILENCING
RNA INTERFERENCE: UNRAVELING GENETIC SILENCINGRNA INTERFERENCE: UNRAVELING GENETIC SILENCING
RNA INTERFERENCE: UNRAVELING GENETIC SILENCING
AADYARAJPANDEY1
 
Orion Air Quality Monitoring Systems - CWS
Orion Air Quality Monitoring Systems - CWSOrion Air Quality Monitoring Systems - CWS
Orion Air Quality Monitoring Systems - CWS
Columbia Weather Systems
 
Seminar of U.V. Spectroscopy by SAMIR PANDA
 Seminar of U.V. Spectroscopy by SAMIR PANDA Seminar of U.V. Spectroscopy by SAMIR PANDA
Seminar of U.V. Spectroscopy by SAMIR PANDA
SAMIR PANDA
 
general properties of oerganologametal.ppt
general properties of oerganologametal.pptgeneral properties of oerganologametal.ppt
general properties of oerganologametal.ppt
IqrimaNabilatulhusni
 
platelets_clotting_biogenesis.clot retractionpptx
platelets_clotting_biogenesis.clot retractionpptxplatelets_clotting_biogenesis.clot retractionpptx
platelets_clotting_biogenesis.clot retractionpptx
muralinath2
 
insect taxonomy importance systematics and classification
insect taxonomy importance systematics and classificationinsect taxonomy importance systematics and classification
insect taxonomy importance systematics and classification
anitaento25
 
Anemia_ different types_causes_ conditions
Anemia_ different types_causes_ conditionsAnemia_ different types_causes_ conditions
Anemia_ different types_causes_ conditions
muralinath2
 
GBSN- Microbiology (Lab 3) Gram Staining
GBSN- Microbiology (Lab 3) Gram StainingGBSN- Microbiology (Lab 3) Gram Staining
GBSN- Microbiology (Lab 3) Gram Staining
Areesha Ahmad
 
Structural Classification Of Protein (SCOP)
Structural Classification Of Protein  (SCOP)Structural Classification Of Protein  (SCOP)
Structural Classification Of Protein (SCOP)
aishnasrivastava
 
Hemoglobin metabolism_pathophysiology.pptx
Hemoglobin metabolism_pathophysiology.pptxHemoglobin metabolism_pathophysiology.pptx
Hemoglobin metabolism_pathophysiology.pptx
muralinath2
 
Viksit bharat till 2047 India@2047.pptx
Viksit bharat till 2047  India@2047.pptxViksit bharat till 2047  India@2047.pptx
Viksit bharat till 2047 India@2047.pptx
rakeshsharma20142015
 
Earliest Galaxies in the JADES Origins Field: Luminosity Function and Cosmic ...
Earliest Galaxies in the JADES Origins Field: Luminosity Function and Cosmic ...Earliest Galaxies in the JADES Origins Field: Luminosity Function and Cosmic ...
Earliest Galaxies in the JADES Origins Field: Luminosity Function and Cosmic ...
Sérgio Sacani
 
Richard's aventures in two entangled wonderlands
Richard's aventures in two entangled wonderlandsRichard's aventures in two entangled wonderlands
Richard's aventures in two entangled wonderlands
Richard Gill
 
PRESENTATION ABOUT PRINCIPLE OF COSMATIC EVALUATION
PRESENTATION ABOUT PRINCIPLE OF COSMATIC EVALUATIONPRESENTATION ABOUT PRINCIPLE OF COSMATIC EVALUATION
PRESENTATION ABOUT PRINCIPLE OF COSMATIC EVALUATION
ChetanK57
 
Richard's entangled aventures in wonderland
Richard's entangled aventures in wonderlandRichard's entangled aventures in wonderland
Richard's entangled aventures in wonderland
Richard Gill
 
erythropoiesis-I_mechanism& clinical significance.pptx
erythropoiesis-I_mechanism& clinical significance.pptxerythropoiesis-I_mechanism& clinical significance.pptx
erythropoiesis-I_mechanism& clinical significance.pptx
muralinath2
 
Penicillin...........................pptx
Penicillin...........................pptxPenicillin...........................pptx
Penicillin...........................pptx
Cherry
 
GBSN - Biochemistry (Unit 5) Chemistry of Lipids
GBSN - Biochemistry (Unit 5) Chemistry of LipidsGBSN - Biochemistry (Unit 5) Chemistry of Lipids
GBSN - Biochemistry (Unit 5) Chemistry of Lipids
Areesha Ahmad
 
Lateral Ventricles.pdf very easy good diagrams comprehensive
Lateral Ventricles.pdf very easy good diagrams comprehensiveLateral Ventricles.pdf very easy good diagrams comprehensive
Lateral Ventricles.pdf very easy good diagrams comprehensive
silvermistyshot
 
The ASGCT Annual Meeting was packed with exciting progress in the field advan...
The ASGCT Annual Meeting was packed with exciting progress in the field advan...The ASGCT Annual Meeting was packed with exciting progress in the field advan...
The ASGCT Annual Meeting was packed with exciting progress in the field advan...
Health Advances
 

Recently uploaded (20)

RNA INTERFERENCE: UNRAVELING GENETIC SILENCING
RNA INTERFERENCE: UNRAVELING GENETIC SILENCINGRNA INTERFERENCE: UNRAVELING GENETIC SILENCING
RNA INTERFERENCE: UNRAVELING GENETIC SILENCING
 
Orion Air Quality Monitoring Systems - CWS
Orion Air Quality Monitoring Systems - CWSOrion Air Quality Monitoring Systems - CWS
Orion Air Quality Monitoring Systems - CWS
 
Seminar of U.V. Spectroscopy by SAMIR PANDA
 Seminar of U.V. Spectroscopy by SAMIR PANDA Seminar of U.V. Spectroscopy by SAMIR PANDA
Seminar of U.V. Spectroscopy by SAMIR PANDA
 
general properties of oerganologametal.ppt
general properties of oerganologametal.pptgeneral properties of oerganologametal.ppt
general properties of oerganologametal.ppt
 
platelets_clotting_biogenesis.clot retractionpptx
platelets_clotting_biogenesis.clot retractionpptxplatelets_clotting_biogenesis.clot retractionpptx
platelets_clotting_biogenesis.clot retractionpptx
 
insect taxonomy importance systematics and classification
insect taxonomy importance systematics and classificationinsect taxonomy importance systematics and classification
insect taxonomy importance systematics and classification
 
Anemia_ different types_causes_ conditions
Anemia_ different types_causes_ conditionsAnemia_ different types_causes_ conditions
Anemia_ different types_causes_ conditions
 
GBSN- Microbiology (Lab 3) Gram Staining
GBSN- Microbiology (Lab 3) Gram StainingGBSN- Microbiology (Lab 3) Gram Staining
GBSN- Microbiology (Lab 3) Gram Staining
 
Structural Classification Of Protein (SCOP)
Structural Classification Of Protein  (SCOP)Structural Classification Of Protein  (SCOP)
Structural Classification Of Protein (SCOP)
 
Hemoglobin metabolism_pathophysiology.pptx
Hemoglobin metabolism_pathophysiology.pptxHemoglobin metabolism_pathophysiology.pptx
Hemoglobin metabolism_pathophysiology.pptx
 
Viksit bharat till 2047 India@2047.pptx
Viksit bharat till 2047  India@2047.pptxViksit bharat till 2047  India@2047.pptx
Viksit bharat till 2047 India@2047.pptx
 
Earliest Galaxies in the JADES Origins Field: Luminosity Function and Cosmic ...
Earliest Galaxies in the JADES Origins Field: Luminosity Function and Cosmic ...Earliest Galaxies in the JADES Origins Field: Luminosity Function and Cosmic ...
Earliest Galaxies in the JADES Origins Field: Luminosity Function and Cosmic ...
 
Richard's aventures in two entangled wonderlands
Richard's aventures in two entangled wonderlandsRichard's aventures in two entangled wonderlands
Richard's aventures in two entangled wonderlands
 
PRESENTATION ABOUT PRINCIPLE OF COSMATIC EVALUATION
PRESENTATION ABOUT PRINCIPLE OF COSMATIC EVALUATIONPRESENTATION ABOUT PRINCIPLE OF COSMATIC EVALUATION
PRESENTATION ABOUT PRINCIPLE OF COSMATIC EVALUATION
 
Richard's entangled aventures in wonderland
Richard's entangled aventures in wonderlandRichard's entangled aventures in wonderland
Richard's entangled aventures in wonderland
 
erythropoiesis-I_mechanism& clinical significance.pptx
erythropoiesis-I_mechanism& clinical significance.pptxerythropoiesis-I_mechanism& clinical significance.pptx
erythropoiesis-I_mechanism& clinical significance.pptx
 
Penicillin...........................pptx
Penicillin...........................pptxPenicillin...........................pptx
Penicillin...........................pptx
 
GBSN - Biochemistry (Unit 5) Chemistry of Lipids
GBSN - Biochemistry (Unit 5) Chemistry of LipidsGBSN - Biochemistry (Unit 5) Chemistry of Lipids
GBSN - Biochemistry (Unit 5) Chemistry of Lipids
 
Lateral Ventricles.pdf very easy good diagrams comprehensive
Lateral Ventricles.pdf very easy good diagrams comprehensiveLateral Ventricles.pdf very easy good diagrams comprehensive
Lateral Ventricles.pdf very easy good diagrams comprehensive
 
The ASGCT Annual Meeting was packed with exciting progress in the field advan...
The ASGCT Annual Meeting was packed with exciting progress in the field advan...The ASGCT Annual Meeting was packed with exciting progress in the field advan...
The ASGCT Annual Meeting was packed with exciting progress in the field advan...
 

Spectrophotometer instrumentation & working

  • 2. Spectrophotometric Analysis • Spectrophotometric techniques are used to measure the concentration of solutes in solution by measuring the amount of light that is absorbed by the solution in a cuvette placed in the spectrophotometer. • The spectrophotometer can measure the amount of light or electromagnetic radiation (of certain frequency) transmitted or absored by the solution.
  • 3. Absorption of Radiant Energy Wave-particle Nature of Radiant energy: Light and other forms of radiant energy have a dual nature (wave and particle) Electromagnetic radiation is a type of energy that is transmitted through space as a transverse wave at enormous velocity. It takes numerous forms known as electromagnetic spectrum. The electromagnetic spectrum include gamma ray, X-ray, ultraviolet (UV), visible, infrared (IR), microwave and radio-wave radiation.
  • 4. Wave motion of light Wave Properties The wave is described either in terms of its wavelength (l),the distance between successive maxima or minima of a wav(nm), or in terms of the frequency(n), the number of oscillation of the field per second. The velocity of light, c, is given by the equation: C= n l
  • 5. Particle properties Electromagnetic radiation of light can be viewed as a stream of discrete wave packets of distinct particles called photons. The energy E of photon depends upon the frequency of the radiation E = hn Therefore: h = Planck’s constant (6.626 x 10⁻³⁴ J s) n = frequency of the radiation (most common units = cm-1 Energy is inversely proportional to wavelength
  • 6. • The ultraviolet region extends from about 10 to 380 nm •The most analytically useful region is from 200 to 380 nm, called the near- ultraviolet region or quartz UV region. • The visible (VIS) region extends from about 380 to 780nm. •The infrared (IR) region extends from about 0.78μm to 300 μm. •The near-infrared (IR) region extends from about 0.80μm to 2.5 μm. •The far-infrared (IR) region extends from about 2.5μm to 16 μm. The electromagnetic spectrum
  • 7. Regions of Electromagnetic Spectrum-the “colour” of light
  • 8. The absorption process How does matter absorb radiation When polychromatic light (white light), which contains the whole spectrum of wavelengths in visible region, is passed though an object will absorb certain of the wavelengths, leaving the unabsorbed wavelengths to be transmitted. These residual transmitted wavelengths will be seen as a color. This color is complementary to the absorbed colors.
  • 9. Absorption is a process in which chemical species (atom, ion or molecule) in a transparent medium selectively attenuate certain frequencies of EMR. Absorption spectrum is a plot of the amount of light absorbed by a sample as a function of wavelength. At room temperature most substance are in their lowest energy or ground state. When an atom, molecule or ion absorbs EMR it is promoted to higher energy states or excited states. The excited state is a transition one and the species soon looses the energy it gained and returns to its ground state by relaxation process either as heat of collision or sometimes emits radiation of specific wavelength.
  • 10. Ground state First Excitation state Second Excitation state E2 E1 E0 hv1 hv2
  • 11. • When a molecule interacts with photons of UV or VIS radiation excitation of electrons takes place to higher electronic energy level at any of its vibrational level. • Eex-Eg= hn of the photon absorbed. • UV / VIS radiation cause electronic transition which is accompanied by vibrational and rotational. • If the compound subjected to IR radiation vibrational and rotational transitions in ground state occure. • Rotational transitions alone can be brought about by microwave.
  • 12. • Ultraviolt and visible radiations have sufficient energy to cause transitions of the outermost or valence electrons. • If large amount of energy is absorbed by certain substance, bonds may be ruptured and new compounds are formed photolysis. This may occur upon absorption of far Ultraviolt as its energy is sufficiently high to exceed the energy of formation of certain bonds. • The total energy of a molecule is given by Etotal=Eelectronic+Evibrational +Erotational
  • 13. Two methods to detect molecules: Indicator – Quickest method. Indicator solutions change colors when a molecule of interest is present. Allows scientist to detect colorless molecules in a solution. Examples: Bradford protein reagent Diphenylamine (DPA) or Biuret (NaOH+CuSO4). What kind of data is this?
  • 14. Two methods to detect molecules: • Spectrophotometer (Spec) –An instrument that measures the amount of light that passes through (is transmitted through) a sample.
  • 15. Spectrophotometer cont… –Uses a type of light to detect molecules in a solution –Light is a type of energy, and the energy is reported as wavelengths, in nanometers (nm).
  • 16. Two different types of Spectrophotometer: Ultraviolet (UV) Spectrophotometers. Uses ultraviolet light of wave lengths from 200 nm to 350 nm. Visible (VIS) Light Spectrum Spectrophotometers. Uses visible light (white light) of wave lengths from 350 nm to 700 nm.
  • 17. The visible light spectrum R O Y G B I V
  • 18. Spectrophotometer cont… • Shines a beam of light on a sample. • The molecules in the sample interact with the light waves in of 3 ways: –Absorb the energy –Reflect the energy –Transmit the energy between and through the atoms and molecules of the sample.
  • 19. How a spectrophotometer works: Consider blue molecules, all the wavelengths of light are absorbed, except for the blue ones. The blue wavelengths are transmitted or reflected off the molecules. If these blue wavelengths hit a detector (such as in the spectrophotometer or the nerve cells in your eye), they appear blue.
  • 20. How a spectrophotometer works: • Molecules are whatever color of light that they do not absorb. • Green molecules appear green because they absorb most wavelengths of visible light, except the green wavelengths.
  • 21. Spectrophotometer cont… The spectrophotometer measures the amount of light transmitted through the sample (Transmittance). By using an equation (Beers law), it converts the transmittance data to an absorbance value. What kind of data is this?
  • 22. Spectrophotometer cont… The concentration of an unknown sample can be determined by comparing the absorbance data to standards of known concentration. The data generated with the set of known standards is called a standard curve.
  • 23. Parts of a spectrophotometer • Inner parts –Lamp –Prism or grating that direct light of a specific wavelength.
  • 24. VIS Spec vs. UV spec Visible spectrophotometer Contains a tungsten lamp that produces white light. Ultraviolet spectrophotometer Contains a deuterium lamp that produces light in the UV light part of the spectrum.
  • 25. Parts of a Spectrophotometer • Outer parts: Sample Holder Display Knobs or buttons used to calibrate the spec to measure the designated molecule. Wavelength Selection
  • 26.
  • 27. How a spectrophotometer works: Visible Spectrophotometer White light hits the prism or grating, it is split into the colors of the rainbow (Visible Spectrum). The wavelength knob rotates the prism/grating, directing different color of light toward the sample.
  • 28. How a spectrophotometer works: • The wavelength of light produced by the tungsten lamp range from about 350 nm (Violet light) to 700 nm (red light). • The molecules in the sample either absorb or Transmit the light energy of one wavelength or another.
  • 29. How a spectrophotometer works: • The detector measures the amount of light being transmitted by the sample and reports that value directly (% transmittance) or converts it to the amount of light absorbed in absorbance units (au) using Beers Law. A = 2 – log10%T
  • 30.
  • 31.
  • 32. Absorption Spectrum • After collecting data for your concentration an absorption spectrum graph is created. • These can be used when attempting to identify unknown substances (e.g. CSI)
  • 33. Example of absorption spectrum of Chlorophyll a & b, and Carotenoids
  • 34. The relationship of concentration in a solution: The concentration of molecules in a solution affects the solution’s absorbance. If there are more molecules in one solution than in another, than there are more molecules to absorb the light.
  • 35. Applications of a spectrophotometer • Determines the presence and concentrations of samples. • Determines the purity of a sample. • Look at the change of samples over time.
  • 36.
  • 37. OVERVIEW OF QUANTITIVE SPECTROPHOTOMETRY A. Measure the absorbance of standards containing known concentrations of the analyte B. Plot a standard curve with absorbance on the X axis and analyte concentration on the Y axis C. Measure the absorbance of the unknown(s) D. Determine the concentration of material of interest in the unknowns based on the standard curve