Downloaded 534 times
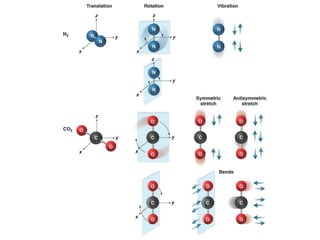
![Degrees of Freedom:
Translation, Rotation, and Vibration
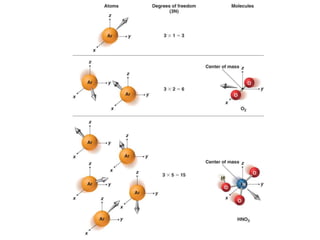
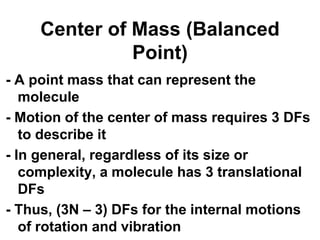
Consider a single Ar atom moving in 3-D space:
- Moving motion is referred to as Translation
- To analyze the translation of an Ar, we need to know
position (x, y, z) and momentum (px, py, pz)
Where it is Where it is headed
- Each coordinate-momentum pair [for example, (x,px)] is
referred to as a Degree of Freedom (DF)
- An Ar atom moving through 3-D space has three DFs
N argon atoms possesses 3N DFs:
All translational DFs](https://image.slidesharecdn.com/spectroscopy-160527094020/85/Spectroscopy-42-320.jpg)
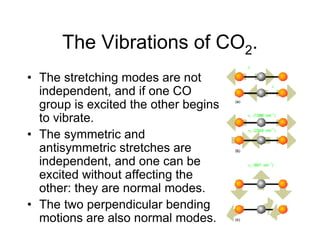
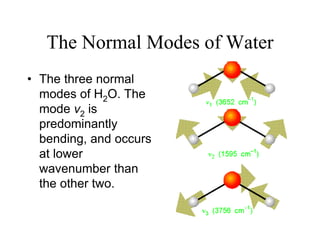
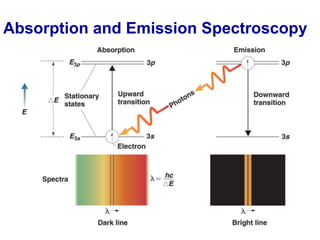
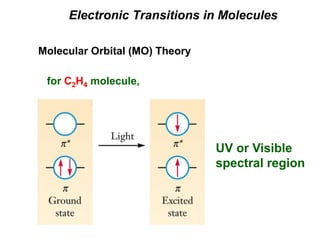
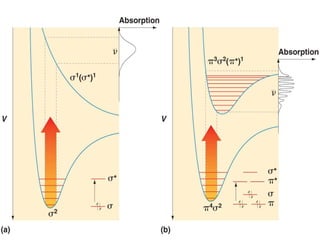
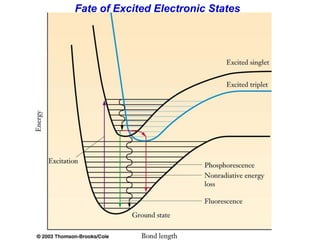
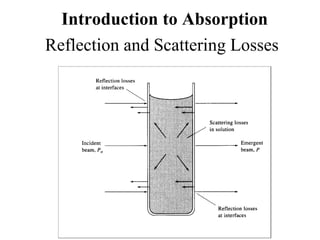
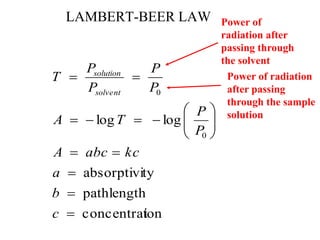
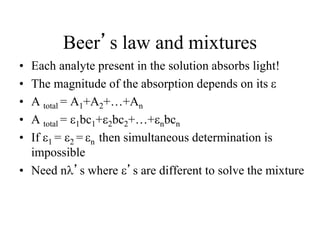
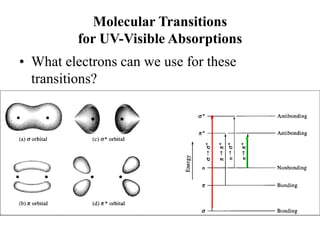
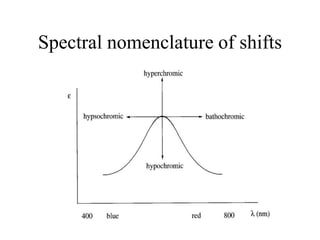
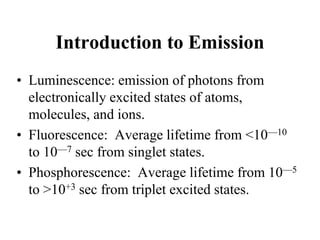
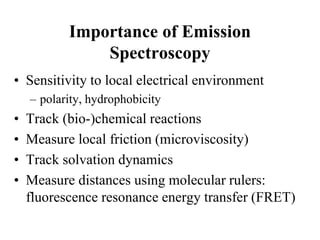

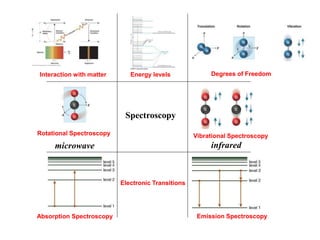
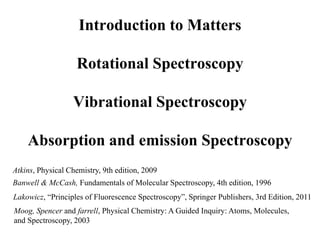
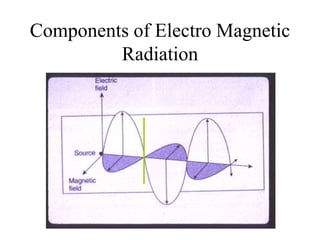
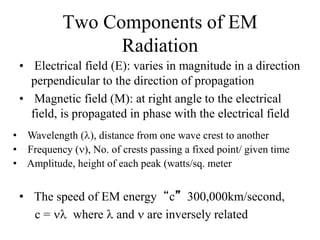
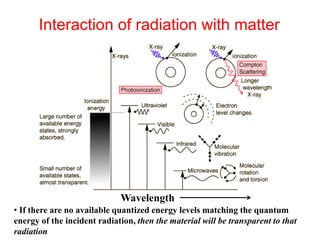
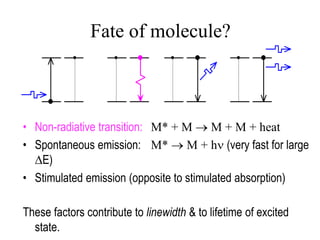
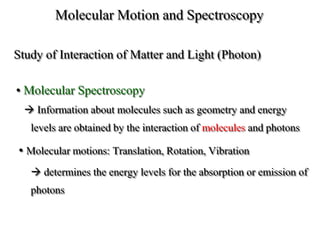
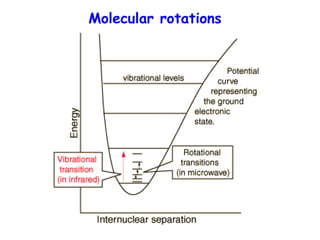
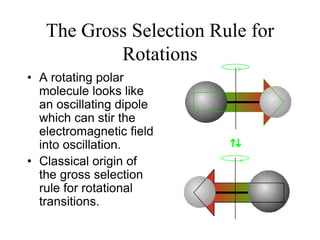
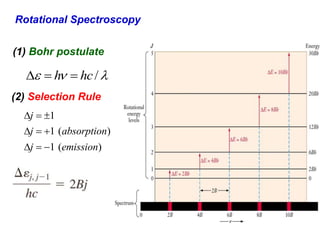
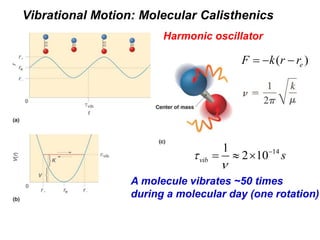
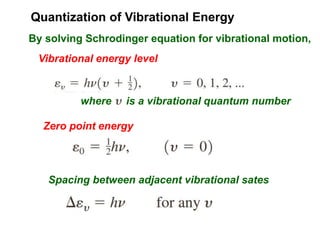
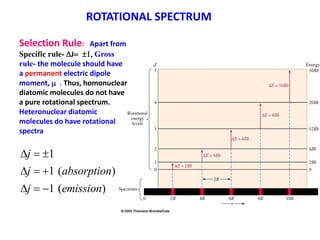
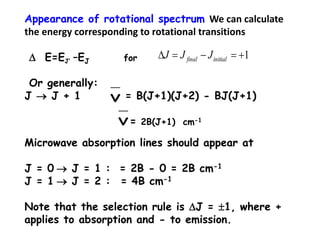
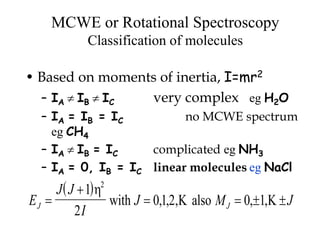
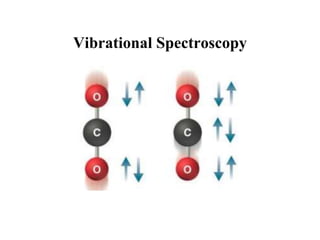
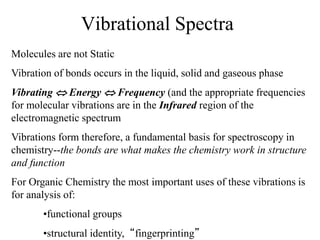
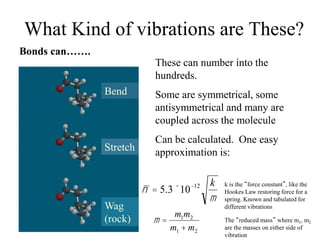
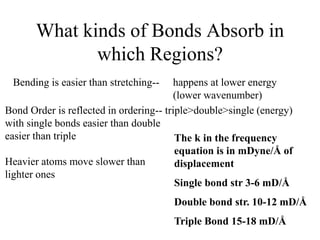
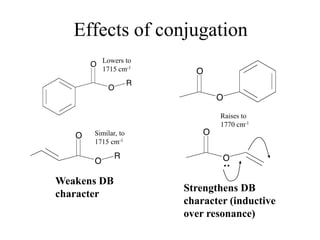
This document provides an overview of molecular spectroscopy techniques, including rotational spectroscopy, vibrational spectroscopy, and absorption and emission spectroscopy. Rotational spectroscopy uses microwave spectroscopy to study the quantized rotational energy levels of molecules. Vibrational spectroscopy uses infrared spectroscopy to analyze the quantized vibrational energy levels of bonds as they stretch, bend, and vibrate. Absorption and emission spectroscopy examines how molecules absorb and emit photons during electronic transitions between energy levels.