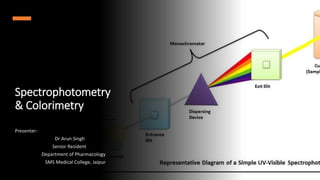
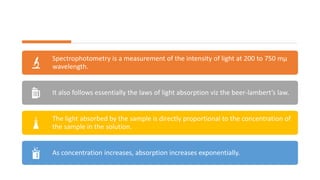
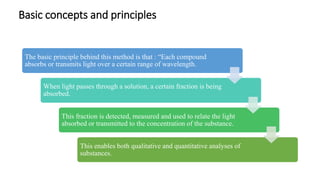
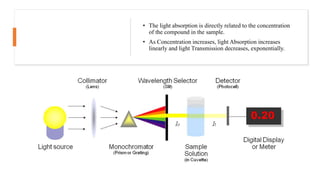
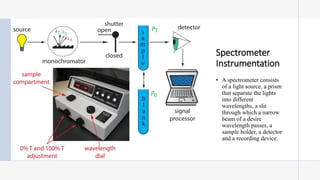
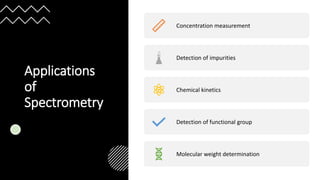
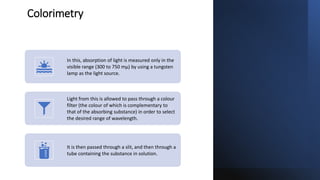
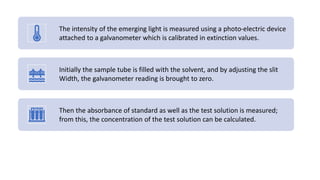
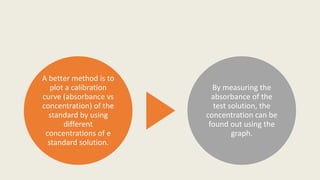
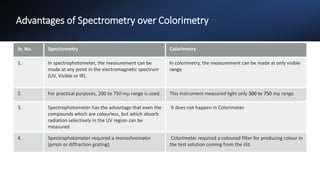
Spectrophotometry
& Colorimetry
Presenter-
Dr Arun Singh
Senior Resident
Department of Pharmacology
SMS Medical College, Jaipur
Overview
Introduction
Basic concepts and principles
Types of spectrometry
Device and mechanism
Beer-lambert-law
Applications
Colorimetry
Advantage of Spectrometry Over Colorimetry
Spectrophotometry is a measurement of the intensity of light at 200 to 750 mμ
wavelength.
It also follows essentially the laws of light absorption viz the beer-lambert’s law.
The light absorbed by the sample is directly proportional to the concentration of
the sample in the solution.
As concentration increases, absorption increases exponentially.
History
Instrumental spectrophotometry became commercially available about 1940
with the introduction of Arnold Beckman's DU spectrophotometer (Model D
Ultraviolet).
About 1950, a microscope was interfaced with an existing, direct reading spectrophotometer,
creating the first microspectrophotometer (MSP).
In 1959, another MSP system was invented the allowed the use of dual (sample vs. reference)
beams.
In the intervening years, there have been significant advances in the design of
spectrophotometers including the emergence of faster multi-wavelength designs in the 1970s
and the introduction of a commercially available diode array spectrophotometer in 1979.
Basic concepts and principles
The basic principle behind this method is that : “Each compound
absorbs or transmits light over a certain range of wavelength.
When light passes through a solution, a certain fraction is being
absorbed.
This fraction is detected, measured and used to relate the light
absorbed or transmitted to the concentration of the substance.
This enables both qualitative and quantitative analyses of
substances.
The spectrophotometric technique measures the
light intensity by:
(a) Diffracting the light beam into a spectrum of
wavelengths
(b) Direct it to an object
(c) Receiving the light reflected or returned from the
object
(d) Detecting the intensities with a charge-coupled
device
(e) Displaying the results as a graph on the detector
and then the display device
• The light absorption is directly related to the concentration
of the compound in the sample.
• As Concentration increases, light Absorption increases
linearly and light Transmission decreases, exponentially.
Spectrometer
Instrumentation
• A spectrometer consists
of a light source, a prism
that separate the lights
into different
wavelengths, a slit
through which a narrow
beam of a desire
wavelength passes, a
sample holder, a detector
and a recording device.
Transmittance and
Absorbance
• When a sample is illuminated, it absorbs some of the
light and transmits the rest.
• The transmitted light (Is ) is of lower intensity than
the incident light
(Io ), and the transmitted light is defined as: T = Is / Io
To ensure accuracy (by eliminating effects of reflection by surface of
the cell, absorption by the cell wall and by solvent) an identical
reference cell without the compound of interest is also used.
• Thus, the amount of light absorbed (A) as the incident light passes
through the sample is equivalent to:
A = - log Is / IR = - log T
In practice, the Reference cell is inserted, and the
instrument adjusted to an arbitrary scale
corresponding to 100% transmittance, after which
the percentage transmittance reading is made on
the sample.
Types of spectrometry
Spectrophotometer can be classified into two different types :
• Single Beam Spectrometer
• Double Beam Spectrometer
Single Beam Spectrometer
To measure the intensity of the incident light the sample must be removed so that the reference
can be placed each time.
This type of spectrometer is usually less expensive and less complicated.
Double Beam Spectrometer
In this type, before it reaches the sample, the light source is split into two separate beams.
From these one passes through the sample and second one is used for reference.
This gives an advantage because the reference reading and sample reading can take place at the same time.
Based on the wavelength of light used it can be classified into:
(A)Visible Spectrometer
• Uses visible range (400 –
700nm) of
electromagnetic radiation
spectrum.
• Visible
spectrophotometers vary
in accuracy.
• Plastic and glass cuvettes
can be used for visible
light spectroscopy.
(B)UV Spectrometer
• Uses light over the UV
range (180 - 400 nm).
• UV spectroscopy is used
for fluids, and even solids.
• Cuvettes, only made of
quartz, are used for
placing the samples.
(C) IR Spectrophotometer
• Uses light over infra red
range (700 -15000) of
electromagnetic radiation
spectra
• Its are instruments used to scan the fluorescence spectrum emitted by liquid
fluorescent labels, which used in scientific research, chemical
industry,medicine,biochemistry,environmental protection,clinical testing,food
testing,teaching experiments and other fields.
(D)Fluorescence Spectrometer:-
• This method is mainly applied to detect trace components in the sample analysis.
• It is powerful tool for material analysis and elemental analysis of trace
metals(semimetals).
(E)Atomic absorption Spectrometer:-
Device and Mechanism
• The spectrophotometer, in general, consists of two devices. They are the following :
1.Spectrometer : A device that produce, typically disperse and measure the light.
2.Photometer : Indicates the photoelectric detector that measures the light.
• The spectrometer consists of the following parts :
(i) Light source :It produces a desired range of wavelength of light.
(ii) Collimator : It transmits a straight beam of light.
(iii)Monochromator : It split the light into its component wavelength.
(iv)Wavelength selector : transmits only the desired wavelength.
(v) Cuvettes: The optically transparent cells (cuvette) are made up of glass,
plastic, silica or quartz, glass and plastic absorb UV light below 310 nm.
(vi) Photocell and photo-multiplier tubes: It a photocell is a photoelectric device
which converts light energy into electrical energy, which is then amplified,
detected and recorded.’’
• The photometer detects the light absorbed by the sample as the light from the
slit is passed through the solution and then it sends signal to the galvanometer
or digital display.
Beer – Lambert Law
• It states that the absorbance of light by a material in a solution is directly proportional to its
concentration in that solution.
A = ϵlc
Where,
A -absorbance
ϵ -molar absorptivity
l -length of solution
c -concentration
Standardization Graph
• Standards (solutions of
known concentration) of the
compound of interest are
made, treated, and their
absorbances (ABS) and
concentration values are
used to create a
Standardization Graph.
Absorption spectra
• A spectrum of electromagnetic radiation transmitted through a
substance, showing dark lines or bands due to absorption at specific
wavelengths.
Applications
of
Spectrometry
Concentration measurement
Detection of impurities
Chemical kinetics
Detection of functional group
Molecular weight determination
Colorimetry
In this, absorption of light is measured only in the
visible range (300 to 750 mµ) by using a tungsten
lamp as the light source.
Light from this is allowed to pass through a colour
filter (the colour of which is complementary to
that of the absorbing substance) in order to select
the desired range of wavelength.
It is then passed through a slit, and then through a
tube containing the substance in solution.
The intensity of the emerging light is measured using a photo-electric device
attached to a galvanometer which is calibrated in extinction values.
Initially the sample tube is filled with the solvent, and by adjusting the slit
Width, the galvanometer reading is brought to zero.
Then the absorbance of standard as well as the test solution is measured;
from this, the concentration of the test solution can be calculated.
A better method is to
plot a calibration
curve (absorbance vs
concentration) of the
standard by using
different
concentrations of e
standard solution.
By measuring the
absorbance of the
test solution, the
concentration can be
found out using the
graph.
Advantages of Spectrometry over Colorimetry
Sr. No. Spectrometry Colorimetry
1. ln spectrophotometer, the measurement can be
made at any point in the electromagnetic spectrum
(UV, Visible or IR).
ln colorimetry, the measurement can be made at only visible
range.
2. For practical purposes, 200 to 750 mμ range is used. This instrument measured light only 300 to 750 mμ range.
3. Spectrophotometer has the advantage that even the
compounds which are colourless, but which absorb
radiation selectively in the UV region can be
measured.
It does not happen in Colorimeter.
4. Spectrophotometer required a monochromator
(prism or diffraction grating).
Colorimeter required a coloured filter for producing colour in
the test solution coming from the slit.
Spectrophotometry & Calorimetry.pptx

Spectrophotometry & Calorimetry.pptx

  • 1.
    Spectrophotometry & Colorimetry Presenter- Dr ArunSingh Senior Resident Department of Pharmacology SMS Medical College, Jaipur
  • 2.
    Overview Introduction Basic concepts andprinciples Types of spectrometry Device and mechanism Beer-lambert-law Applications Colorimetry Advantage of Spectrometry Over Colorimetry
  • 3.
    Spectrophotometry is ameasurement of the intensity of light at 200 to 750 mμ wavelength. It also follows essentially the laws of light absorption viz the beer-lambert’s law. The light absorbed by the sample is directly proportional to the concentration of the sample in the solution. As concentration increases, absorption increases exponentially.
  • 4.
    History Instrumental spectrophotometry becamecommercially available about 1940 with the introduction of Arnold Beckman's DU spectrophotometer (Model D Ultraviolet).
  • 5.
    About 1950, amicroscope was interfaced with an existing, direct reading spectrophotometer, creating the first microspectrophotometer (MSP). In 1959, another MSP system was invented the allowed the use of dual (sample vs. reference) beams. In the intervening years, there have been significant advances in the design of spectrophotometers including the emergence of faster multi-wavelength designs in the 1970s and the introduction of a commercially available diode array spectrophotometer in 1979.
  • 6.
    Basic concepts andprinciples The basic principle behind this method is that : “Each compound absorbs or transmits light over a certain range of wavelength. When light passes through a solution, a certain fraction is being absorbed. This fraction is detected, measured and used to relate the light absorbed or transmitted to the concentration of the substance. This enables both qualitative and quantitative analyses of substances.
  • 7.
    The spectrophotometric techniquemeasures the light intensity by: (a) Diffracting the light beam into a spectrum of wavelengths (b) Direct it to an object (c) Receiving the light reflected or returned from the object (d) Detecting the intensities with a charge-coupled device (e) Displaying the results as a graph on the detector and then the display device
  • 8.
    • The lightabsorption is directly related to the concentration of the compound in the sample. • As Concentration increases, light Absorption increases linearly and light Transmission decreases, exponentially.
  • 9.
    Spectrometer Instrumentation • A spectrometerconsists of a light source, a prism that separate the lights into different wavelengths, a slit through which a narrow beam of a desire wavelength passes, a sample holder, a detector and a recording device.
  • 10.
    Transmittance and Absorbance • Whena sample is illuminated, it absorbs some of the light and transmits the rest. • The transmitted light (Is ) is of lower intensity than the incident light (Io ), and the transmitted light is defined as: T = Is / Io
  • 11.
    To ensure accuracy(by eliminating effects of reflection by surface of the cell, absorption by the cell wall and by solvent) an identical reference cell without the compound of interest is also used. • Thus, the amount of light absorbed (A) as the incident light passes through the sample is equivalent to: A = - log Is / IR = - log T In practice, the Reference cell is inserted, and the instrument adjusted to an arbitrary scale corresponding to 100% transmittance, after which the percentage transmittance reading is made on the sample.
  • 12.
    Types of spectrometry Spectrophotometercan be classified into two different types : • Single Beam Spectrometer • Double Beam Spectrometer
  • 13.
    Single Beam Spectrometer Tomeasure the intensity of the incident light the sample must be removed so that the reference can be placed each time. This type of spectrometer is usually less expensive and less complicated.
  • 14.
    Double Beam Spectrometer Inthis type, before it reaches the sample, the light source is split into two separate beams. From these one passes through the sample and second one is used for reference. This gives an advantage because the reference reading and sample reading can take place at the same time.
  • 15.
    Based on thewavelength of light used it can be classified into: (A)Visible Spectrometer • Uses visible range (400 – 700nm) of electromagnetic radiation spectrum. • Visible spectrophotometers vary in accuracy. • Plastic and glass cuvettes can be used for visible light spectroscopy. (B)UV Spectrometer • Uses light over the UV range (180 - 400 nm). • UV spectroscopy is used for fluids, and even solids. • Cuvettes, only made of quartz, are used for placing the samples. (C) IR Spectrophotometer • Uses light over infra red range (700 -15000) of electromagnetic radiation spectra
  • 16.
    • Its areinstruments used to scan the fluorescence spectrum emitted by liquid fluorescent labels, which used in scientific research, chemical industry,medicine,biochemistry,environmental protection,clinical testing,food testing,teaching experiments and other fields. (D)Fluorescence Spectrometer:- • This method is mainly applied to detect trace components in the sample analysis. • It is powerful tool for material analysis and elemental analysis of trace metals(semimetals). (E)Atomic absorption Spectrometer:-
  • 17.
    Device and Mechanism •The spectrophotometer, in general, consists of two devices. They are the following : 1.Spectrometer : A device that produce, typically disperse and measure the light. 2.Photometer : Indicates the photoelectric detector that measures the light. • The spectrometer consists of the following parts : (i) Light source :It produces a desired range of wavelength of light. (ii) Collimator : It transmits a straight beam of light. (iii)Monochromator : It split the light into its component wavelength. (iv)Wavelength selector : transmits only the desired wavelength.
  • 18.
    (v) Cuvettes: Theoptically transparent cells (cuvette) are made up of glass, plastic, silica or quartz, glass and plastic absorb UV light below 310 nm. (vi) Photocell and photo-multiplier tubes: It a photocell is a photoelectric device which converts light energy into electrical energy, which is then amplified, detected and recorded.’’ • The photometer detects the light absorbed by the sample as the light from the slit is passed through the solution and then it sends signal to the galvanometer or digital display.
  • 19.
    Beer – LambertLaw • It states that the absorbance of light by a material in a solution is directly proportional to its concentration in that solution. A = ϵlc Where, A -absorbance ϵ -molar absorptivity l -length of solution c -concentration
  • 20.
    Standardization Graph • Standards(solutions of known concentration) of the compound of interest are made, treated, and their absorbances (ABS) and concentration values are used to create a Standardization Graph.
  • 21.
    Absorption spectra • Aspectrum of electromagnetic radiation transmitted through a substance, showing dark lines or bands due to absorption at specific wavelengths.
  • 22.
    Applications of Spectrometry Concentration measurement Detection ofimpurities Chemical kinetics Detection of functional group Molecular weight determination
  • 23.
    Colorimetry In this, absorptionof light is measured only in the visible range (300 to 750 mµ) by using a tungsten lamp as the light source. Light from this is allowed to pass through a colour filter (the colour of which is complementary to that of the absorbing substance) in order to select the desired range of wavelength. It is then passed through a slit, and then through a tube containing the substance in solution.
  • 24.
    The intensity ofthe emerging light is measured using a photo-electric device attached to a galvanometer which is calibrated in extinction values. Initially the sample tube is filled with the solvent, and by adjusting the slit Width, the galvanometer reading is brought to zero. Then the absorbance of standard as well as the test solution is measured; from this, the concentration of the test solution can be calculated.
  • 25.
    A better methodis to plot a calibration curve (absorbance vs concentration) of the standard by using different concentrations of e standard solution. By measuring the absorbance of the test solution, the concentration can be found out using the graph.
  • 26.
    Advantages of Spectrometryover Colorimetry Sr. No. Spectrometry Colorimetry 1. ln spectrophotometer, the measurement can be made at any point in the electromagnetic spectrum (UV, Visible or IR). ln colorimetry, the measurement can be made at only visible range. 2. For practical purposes, 200 to 750 mμ range is used. This instrument measured light only 300 to 750 mμ range. 3. Spectrophotometer has the advantage that even the compounds which are colourless, but which absorb radiation selectively in the UV region can be measured. It does not happen in Colorimeter. 4. Spectrophotometer required a monochromator (prism or diffraction grating). Colorimeter required a coloured filter for producing colour in the test solution coming from the slit.