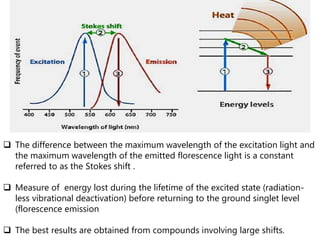
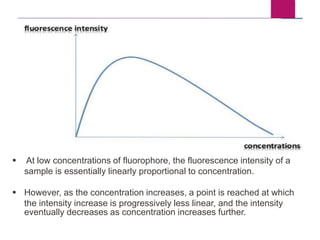
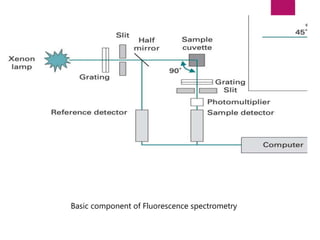
SPECTROFLUOROMETRY
HARI SHARAN MAKAJU
MSc. CLINICAL BIOCHEMISTRY
1ST YEAR
Fluorescence Spectrometry
(SPECTROFLUOROMETRY)
 Fluorescence is an emission phenomenon, the energy transition from
a higher to lower state within the molecule concerned being
measured by the detection of this emitted radiation rather than the
absorption.
 A molecule absorbs light at one wavelength and reemits light at a
longer wavelength.
 An atom or molecule that fluoresces is termed a fluorophore.
 Fluorometry is defied as the measurement of emitted florescent
light.
I. Principles of Fluorescence
1. Luminescence
• Emission of photons from electronically excited states
• Two types of luminescence:
1.Fluorescence
• Relaxation from singlet excited state
2. Phosphorescence
• Relaxation from triplet excited state
I. Principles of Fluorescence
2. Singlet and triplet states
• Ground state – two electrons per orbital; electrons have opposite spin
and are paired
• Singlet excited state
Electron in higher energy orbital has the opposite spin orientation
relative to electron in the lower orbital
• Triplet excited state
The excited valence electron may spontaneously reverse its spin (spin
flip). This process is called intersystem crossing. Electrons in both
orbitals now have same spin orientation
I. Principles of Fluorescence
3. Types of emission
• Fluorescence – return from excited singlet state to
ground state; does not require change in spin
orientation (more common of relaxation)
• Phosphoresence – return from a triplet excited state to
a ground state; electron requires change in spin
orientation
• Emissive rates of fluorescence are several orders of
magnitude faster than that of phosphorescence
I. Principles of Fluorescence
Jablonski Diagram
Basic concepts
 Each molecule contains a series of closely spaced energy levels.
 Absorption of a quantum of light energy by a molecule causes the
transition of an electron from the singlet ground state to one of a
number of possible vibrational levels of its fist singlet state.
 The actual number of molecules in the excited state under typical
reaction conditions and excited with a typical 150-W light source is
very small and is estimated to be about 10 −13 mole per mole of
fluorophore.
Basic concepts
 Once the molecule is in an excited state, it returns to its
original energy state in several ways.
 (1) radiation-less vibrational equilibration(IC)
 (2) the florescence process from the excited singlet state
 (3) quenching of the excited singlet state,
 (4) radiationless crossover to a triplet state(ISC),
 (5) quenching of the fist triplet state
 (6) the phosphorescence process of light
emission from the triplet state
Internal conversion Vs intersystem crossing
 Internal conversion is a transition
occurring between states of the same
multiplicity and it takes place at a time
scale of 10-12 s (faster than that of
fluorescence process)
Intersystem crossing
 Intersystem crossing refers to non-
radiative transition between states of
different multiplicity
 It occurs via inversion of the spin of the
excited electron resulting in two unpaired
electrons with the same spin orientation,
resulting in a state with Spin=1 and
multiplicity of 3 (triplet state)
 The difference between the maximum wavelength of the excitation light and
the maximum wavelength of the emitted florescence light is a constant
referred to as the Stokes shift .
 Measure of energy lost during the lifetime of the excited state (radiation-
less vibrational deactivation) before returning to the ground singlet level
(florescence emission
 The best results are obtained from compounds involving large shifts.
Relationship of Concentration and
Fluorescence Intensity
 The relationship of concentration to the intensity of florescence emission is derived from
the Beer-Lambert law.
 By expansion through a Taylor series, rearrangement, logarithm base conversion, and basic
assumptions about dilute solutions, the following equation is obtained:
w here
F = relative florescence intensity
ø = florescence effiency (i.e., the ratio between quanta of light emitted and quanta of light absorbed)
Io= initial excitation intensity
a = molar absorptivity
b = volume element defied by geometry of the excitation and emission slits
c = the concentration in mol/L
Florescence intensity is directly proportional to the concentration of the fluorophore and the
excitation intensity.
This relationship holds only for dilute solutions, in which absorbance is less than 2% of the
exciting radiation
 At low concentrations of fluorophore, the fluorescence intensity of a
sample is essentially linearly proportional to concentration.
 However, as the concentration increases, a point is reached at which
the intensity increase is progressively less linear, and the intensity
eventually decreases as concentration increases further.
Biological Fluorophores
Endogenous Fluorophores
 amino acids
 structural proteins
 enzymes and co-enzymes
 vitamins
 lipids
 porphyrins
Exogenous Fluorophores
 Cyanine dyes
 Photosensitizers
 Molecular markers – GFP, etc.
IV. Biological Fluorophores
Extrinsic fluorescence
 External fluorophore can be introduced into the system by chemical
coupling or non-covalent binding
 Three criteria:
 Firstly, it must not affect the mechanistic properties of the system under
investigation.
 Secondly, its fluorescence emission needs to be sensitive to environmental
conditions in order to enable monitoring of the molecular events.
 Lastly, the fluorophore must be tightly bound at a unique location.
 Examples
 1-anilino-8- naphthalene sulphonate (ANS), fluorescamine, o- phthalaldehyde or 6-
aminoquinolyl-N-hydroxysuccinimidyl carbamate
Fluorescence Instrumentation
Introduction
• Fluorescence is a highly sensitive method (can measure analyte
concentration of 10-8 M)
• Important to minimize interference from:
Background fluorescence from solvents
Light leaks in the instrument
Stray light scattered by turbid solutions
• Instruments do not yield ideal spectra:
Non-uniform spectral output of light source
Wavelength dependent efficiency of detector and optical
elements
Fluorescence Instrumentation
 Excitation source
 Excitation monochromator,
 Cuvet
 Emission monochromator,
 Detector.
Basic component of Fluorescence spectrometry
Excitation source
 The florescence emission intensity is proportional:
 to the initial excitation intensity
 to concentration and size of the volume element being
measured in the sample cell.
 Therefore, an intense lamp capable of emitting radiant
energy over a large spectral region is desirable.
 Excitation sources
 Xenon lamp ,
 Quartz halogen,
 mercury arc lamps
 Lasers.
Excitation source
 Xenon Lamp.
 Provides relatively high-intensity radiant energy over the
spectral region of 250 to 800 nm.
 Widely used for certain florescence applications because of
:
 its high energy output,
 stability of lamp flashes,
 Higher ultraviolet and visible spectral output.
Excitation source
 Lasers.
 Widely used in florescence applications in which highly
intense, well-focused, and essentially monochromatic light
is required.
 Examples
 time-resolved fluorometry,
 flow cytometry,
 laser-induced fluorometry,
Excitation and Emission Monochromator
 Two monochromators are used
 One for tuning the wavelength of the exciting beam
 Second one for analysis of the fluorescence emission.
 Due to the emitted light always having a lower energy
than the exciting light,
 the wavelength of the excitation monochromator is set at a
lower wavelength than the emission monochromator.
Excitation and Emission Monochromator
 Monochromators :
 Interference filters
 colored glass filters
 Gratings
 Prisms.
 Either type of filter is combined with appropriate sharp
cutof glass filters to form a single fiter package, which
removes
 undesired transmission of higher orders
 provides narrow bandwidth, higher peak wavelength
transmission, and increased band slope.
Excitation and Emission Monochromator
Colored glass filters
 used for both excitation and emission wavelength selection,
 but they are more susceptible to transmitting stray light and
unwanted florescence.
Grating monochromators
 Isolate regions of the spectrum
 An advantage of the grating monochromator
 Provides selectivity of the excitation and emission wavelengths
required when working with new fluorophores with absorbance
Cuvet
 Same as with spectrophotometers
 With spectroflorometers, placement of the cuvet and
excitation beam relative to the photodetector is critical
in establishing the optical geometry for florescence
measurements.
 Because florescence light is emitted in all directions from a
molecule, several excitation/emission geometries are used to
measure florescence
Cuvet
 In practice, most commercial spectrofluorometers use the
right angle–detector approach,
 because it minimizes the background signal that limits analytical
sensitivity
Cuvet
 Front surface approach provides the
greatest linearity over a broad
range of concentration
 because it minimizes the inner filter effect.
 The front surface approach shows similar
sensitivity to the right-angle detectors
but is more susceptible to background
light scatter.
 widely applied to heterogeneous solid
phase florescence immunoassay systems
Photodetectors
 Photomultiplier tube (PMT)
 Chargecoupled detector (CCD)
PMT
 commonly used detector in spectroflorometers
 Important features of the PMT for florescence measurements consist
of :
(1) a wide choice of spectral responses,
(2)nanosecond photon response time,
(3)sensitivity.
 Sensitivity is due to the possible gain of 106 electrons at the anode of the
PMT for each incident photon hitting the photo cathode
Photomultiplier tube (PMT)
Photodetectors
Charge-Coupled Detector.
 CCDs are multichannel devices with a dynamic range and a
signal-to-noise ratio that are superior to those of PMTs.
 Composed of a large number of photo-detecting shift
registers that are read horizontally and vertically.
 Because of their ability to detect very low levels of light
 they have been used for molecular fluorescence measurement of
very low concentrations of fluorescent molecules
Performance Verification
 As with spectrophotometers, NIST (National Institute of Standards
and Testing) provides a number of SRMs for use in calibration or
verification of the performance
 SRM 936a (quinine sulfate dihydrate) for calibrating such
instruments and SRM 1932 (fluorescein) for establishing a
reference scale for florescence measurements
Fluorescence measurements
1. Instrument non-uniformities
2. Excitation wavelength calibration
3. Emission wavelength calibration
4. Setup parameters for emission spectrum
5. Routine experimental procedure
6. Collection geometry
7. Blank scans
8. Typical fluorescence spectrum
Limitations of Fluorescence Measurements
 Factors that influence florescence measurements include:
 Concentration effects
 Inner filter effects, concentration quenching
 Background effects
 due to Rayleigh and Raman scattering
 Solvent effects
 Interfering nonspecific fluorescence, quenching from the solvent
 Sample effects
 Light scattering, interfering florescence, sample adsorption
 Temperature effects
 Photodecomposition (bleaching) of the sample.
Advantages of fluorescence
spectroscopy
 SENSITIVITY :
 It is more sensitive as concentration is low as µg/ml or ng/ml.
 PRECISION :
 Upto 1 % can be achieved.
 SPECIFICITY :
 More specific than absorption method where absorption
maxima may be same for two compounds.
 RANGE OF APPLICATION :
 Even non fluorescent compounds can also be converted to
fluorescent compounds by chemical compounds.
Disadvantages fluorescence
spectroscopy :
Disadvantages:
 Not useful for identification
 Not all compounds fluorescence
 Contamination can quench the fluorescence and hence
give false/no results
Applications
 Widely used method of quantitative analysis in the chemical and biological
sciences
 it is a very accurate and sensitive technique
Environmental Significance:
 To detect environmental pollutants such as polycyclic aromatic
hydrocarbons:
• pyrene
• benzopyrene
• organothiophosphorous pesticides
• carbamate insecticides
 Generally used to carry out qualitative as well as quantitative analysis for a
great aromatic compounds present in cigarette smoking, air pollutant
concentrates & automobile exhausts
Applications
Analytical chemistry:
 To detect compounds from HPLC flow
 TLC plates can be visualized if the compounds or a coloring reagent is
fluorescent
 Plant pigments, steroids, proteins, naphthols etc. can be determined at low
concentrations
Biochemistry:
 Used generally as a non-destructive way of tracking or analysis of biological
molecules (proteins)
 Possible direct or indirect analysis aromatic amino acids (phenylalanine-
tyrosine-tryptophan)
 Fingerprints can be visualized with fluorescent compounds such as
ninhydrin.
Applications
Medicine
 Blood and other substances are sometimes detected by fluorescent reagents,
particularly where their location was not previously known.
 There has also been a report of its use in differentiating malignant, bashful
skin tumors from benign.
Pharmacy:
Possible direct or indirect analysis drugs such as:
 vitamins (vitamin A -vitamin B2 -vitamin B6 -vitamin B12 -vitamin E -folic
acid)
 catecholamines (dopamine-norepinephrine)
 Other drugs (quinine-salicylic acid–morphine-barbiturates –lysergic acid
diethylamide (LSD))
 to measure the amount of impurities present in the sample.
Fluorescence spectrometry

Fluorescence spectrometry

  • 1.
    SPECTROFLUOROMETRY HARI SHARAN MAKAJU MSc.CLINICAL BIOCHEMISTRY 1ST YEAR
  • 2.
    Fluorescence Spectrometry (SPECTROFLUOROMETRY)  Fluorescenceis an emission phenomenon, the energy transition from a higher to lower state within the molecule concerned being measured by the detection of this emitted radiation rather than the absorption.  A molecule absorbs light at one wavelength and reemits light at a longer wavelength.  An atom or molecule that fluoresces is termed a fluorophore.  Fluorometry is defied as the measurement of emitted florescent light.
  • 3.
    I. Principles ofFluorescence 1. Luminescence • Emission of photons from electronically excited states • Two types of luminescence: 1.Fluorescence • Relaxation from singlet excited state 2. Phosphorescence • Relaxation from triplet excited state
  • 4.
    I. Principles ofFluorescence 2. Singlet and triplet states • Ground state – two electrons per orbital; electrons have opposite spin and are paired • Singlet excited state Electron in higher energy orbital has the opposite spin orientation relative to electron in the lower orbital • Triplet excited state The excited valence electron may spontaneously reverse its spin (spin flip). This process is called intersystem crossing. Electrons in both orbitals now have same spin orientation
  • 5.
    I. Principles ofFluorescence 3. Types of emission • Fluorescence – return from excited singlet state to ground state; does not require change in spin orientation (more common of relaxation) • Phosphoresence – return from a triplet excited state to a ground state; electron requires change in spin orientation • Emissive rates of fluorescence are several orders of magnitude faster than that of phosphorescence
  • 6.
    I. Principles ofFluorescence Jablonski Diagram
  • 7.
    Basic concepts  Eachmolecule contains a series of closely spaced energy levels.  Absorption of a quantum of light energy by a molecule causes the transition of an electron from the singlet ground state to one of a number of possible vibrational levels of its fist singlet state.  The actual number of molecules in the excited state under typical reaction conditions and excited with a typical 150-W light source is very small and is estimated to be about 10 −13 mole per mole of fluorophore.
  • 8.
    Basic concepts  Oncethe molecule is in an excited state, it returns to its original energy state in several ways.  (1) radiation-less vibrational equilibration(IC)  (2) the florescence process from the excited singlet state  (3) quenching of the excited singlet state,  (4) radiationless crossover to a triplet state(ISC),  (5) quenching of the fist triplet state  (6) the phosphorescence process of light emission from the triplet state
  • 9.
    Internal conversion Vsintersystem crossing  Internal conversion is a transition occurring between states of the same multiplicity and it takes place at a time scale of 10-12 s (faster than that of fluorescence process) Intersystem crossing  Intersystem crossing refers to non- radiative transition between states of different multiplicity  It occurs via inversion of the spin of the excited electron resulting in two unpaired electrons with the same spin orientation, resulting in a state with Spin=1 and multiplicity of 3 (triplet state)
  • 10.
     The differencebetween the maximum wavelength of the excitation light and the maximum wavelength of the emitted florescence light is a constant referred to as the Stokes shift .  Measure of energy lost during the lifetime of the excited state (radiation- less vibrational deactivation) before returning to the ground singlet level (florescence emission  The best results are obtained from compounds involving large shifts.
  • 11.
    Relationship of Concentrationand Fluorescence Intensity  The relationship of concentration to the intensity of florescence emission is derived from the Beer-Lambert law.  By expansion through a Taylor series, rearrangement, logarithm base conversion, and basic assumptions about dilute solutions, the following equation is obtained: w here F = relative florescence intensity ø = florescence effiency (i.e., the ratio between quanta of light emitted and quanta of light absorbed) Io= initial excitation intensity a = molar absorptivity b = volume element defied by geometry of the excitation and emission slits c = the concentration in mol/L Florescence intensity is directly proportional to the concentration of the fluorophore and the excitation intensity. This relationship holds only for dilute solutions, in which absorbance is less than 2% of the exciting radiation
  • 12.
     At lowconcentrations of fluorophore, the fluorescence intensity of a sample is essentially linearly proportional to concentration.  However, as the concentration increases, a point is reached at which the intensity increase is progressively less linear, and the intensity eventually decreases as concentration increases further.
  • 13.
    Biological Fluorophores Endogenous Fluorophores amino acids  structural proteins  enzymes and co-enzymes  vitamins  lipids  porphyrins Exogenous Fluorophores  Cyanine dyes  Photosensitizers  Molecular markers – GFP, etc.
  • 14.
  • 15.
    Extrinsic fluorescence  Externalfluorophore can be introduced into the system by chemical coupling or non-covalent binding  Three criteria:  Firstly, it must not affect the mechanistic properties of the system under investigation.  Secondly, its fluorescence emission needs to be sensitive to environmental conditions in order to enable monitoring of the molecular events.  Lastly, the fluorophore must be tightly bound at a unique location.  Examples  1-anilino-8- naphthalene sulphonate (ANS), fluorescamine, o- phthalaldehyde or 6- aminoquinolyl-N-hydroxysuccinimidyl carbamate
  • 16.
    Fluorescence Instrumentation Introduction • Fluorescenceis a highly sensitive method (can measure analyte concentration of 10-8 M) • Important to minimize interference from: Background fluorescence from solvents Light leaks in the instrument Stray light scattered by turbid solutions • Instruments do not yield ideal spectra: Non-uniform spectral output of light source Wavelength dependent efficiency of detector and optical elements
  • 17.
    Fluorescence Instrumentation  Excitationsource  Excitation monochromator,  Cuvet  Emission monochromator,  Detector.
  • 18.
    Basic component ofFluorescence spectrometry
  • 19.
    Excitation source  Theflorescence emission intensity is proportional:  to the initial excitation intensity  to concentration and size of the volume element being measured in the sample cell.  Therefore, an intense lamp capable of emitting radiant energy over a large spectral region is desirable.  Excitation sources  Xenon lamp ,  Quartz halogen,  mercury arc lamps  Lasers.
  • 20.
    Excitation source  XenonLamp.  Provides relatively high-intensity radiant energy over the spectral region of 250 to 800 nm.  Widely used for certain florescence applications because of :  its high energy output,  stability of lamp flashes,  Higher ultraviolet and visible spectral output.
  • 21.
    Excitation source  Lasers. Widely used in florescence applications in which highly intense, well-focused, and essentially monochromatic light is required.  Examples  time-resolved fluorometry,  flow cytometry,  laser-induced fluorometry,
  • 22.
    Excitation and EmissionMonochromator  Two monochromators are used  One for tuning the wavelength of the exciting beam  Second one for analysis of the fluorescence emission.  Due to the emitted light always having a lower energy than the exciting light,  the wavelength of the excitation monochromator is set at a lower wavelength than the emission monochromator.
  • 23.
    Excitation and EmissionMonochromator  Monochromators :  Interference filters  colored glass filters  Gratings  Prisms.  Either type of filter is combined with appropriate sharp cutof glass filters to form a single fiter package, which removes  undesired transmission of higher orders  provides narrow bandwidth, higher peak wavelength transmission, and increased band slope.
  • 24.
    Excitation and EmissionMonochromator Colored glass filters  used for both excitation and emission wavelength selection,  but they are more susceptible to transmitting stray light and unwanted florescence. Grating monochromators  Isolate regions of the spectrum  An advantage of the grating monochromator  Provides selectivity of the excitation and emission wavelengths required when working with new fluorophores with absorbance
  • 25.
    Cuvet  Same aswith spectrophotometers  With spectroflorometers, placement of the cuvet and excitation beam relative to the photodetector is critical in establishing the optical geometry for florescence measurements.  Because florescence light is emitted in all directions from a molecule, several excitation/emission geometries are used to measure florescence
  • 26.
    Cuvet  In practice,most commercial spectrofluorometers use the right angle–detector approach,  because it minimizes the background signal that limits analytical sensitivity
  • 27.
    Cuvet  Front surfaceapproach provides the greatest linearity over a broad range of concentration  because it minimizes the inner filter effect.  The front surface approach shows similar sensitivity to the right-angle detectors but is more susceptible to background light scatter.  widely applied to heterogeneous solid phase florescence immunoassay systems
  • 28.
    Photodetectors  Photomultiplier tube(PMT)  Chargecoupled detector (CCD) PMT  commonly used detector in spectroflorometers  Important features of the PMT for florescence measurements consist of : (1) a wide choice of spectral responses, (2)nanosecond photon response time, (3)sensitivity.  Sensitivity is due to the possible gain of 106 electrons at the anode of the PMT for each incident photon hitting the photo cathode
  • 29.
  • 30.
    Photodetectors Charge-Coupled Detector.  CCDsare multichannel devices with a dynamic range and a signal-to-noise ratio that are superior to those of PMTs.  Composed of a large number of photo-detecting shift registers that are read horizontally and vertically.  Because of their ability to detect very low levels of light  they have been used for molecular fluorescence measurement of very low concentrations of fluorescent molecules
  • 31.
    Performance Verification  Aswith spectrophotometers, NIST (National Institute of Standards and Testing) provides a number of SRMs for use in calibration or verification of the performance  SRM 936a (quinine sulfate dihydrate) for calibrating such instruments and SRM 1932 (fluorescein) for establishing a reference scale for florescence measurements
  • 32.
    Fluorescence measurements 1. Instrumentnon-uniformities 2. Excitation wavelength calibration 3. Emission wavelength calibration 4. Setup parameters for emission spectrum 5. Routine experimental procedure 6. Collection geometry 7. Blank scans 8. Typical fluorescence spectrum
  • 33.
    Limitations of FluorescenceMeasurements  Factors that influence florescence measurements include:  Concentration effects  Inner filter effects, concentration quenching  Background effects  due to Rayleigh and Raman scattering  Solvent effects  Interfering nonspecific fluorescence, quenching from the solvent  Sample effects  Light scattering, interfering florescence, sample adsorption  Temperature effects  Photodecomposition (bleaching) of the sample.
  • 34.
    Advantages of fluorescence spectroscopy SENSITIVITY :  It is more sensitive as concentration is low as µg/ml or ng/ml.  PRECISION :  Upto 1 % can be achieved.  SPECIFICITY :  More specific than absorption method where absorption maxima may be same for two compounds.  RANGE OF APPLICATION :  Even non fluorescent compounds can also be converted to fluorescent compounds by chemical compounds.
  • 35.
    Disadvantages fluorescence spectroscopy : Disadvantages: Not useful for identification  Not all compounds fluorescence  Contamination can quench the fluorescence and hence give false/no results
  • 36.
    Applications  Widely usedmethod of quantitative analysis in the chemical and biological sciences  it is a very accurate and sensitive technique Environmental Significance:  To detect environmental pollutants such as polycyclic aromatic hydrocarbons: • pyrene • benzopyrene • organothiophosphorous pesticides • carbamate insecticides  Generally used to carry out qualitative as well as quantitative analysis for a great aromatic compounds present in cigarette smoking, air pollutant concentrates & automobile exhausts
  • 37.
    Applications Analytical chemistry:  Todetect compounds from HPLC flow  TLC plates can be visualized if the compounds or a coloring reagent is fluorescent  Plant pigments, steroids, proteins, naphthols etc. can be determined at low concentrations Biochemistry:  Used generally as a non-destructive way of tracking or analysis of biological molecules (proteins)  Possible direct or indirect analysis aromatic amino acids (phenylalanine- tyrosine-tryptophan)  Fingerprints can be visualized with fluorescent compounds such as ninhydrin.
  • 38.
    Applications Medicine  Blood andother substances are sometimes detected by fluorescent reagents, particularly where their location was not previously known.  There has also been a report of its use in differentiating malignant, bashful skin tumors from benign. Pharmacy: Possible direct or indirect analysis drugs such as:  vitamins (vitamin A -vitamin B2 -vitamin B6 -vitamin B12 -vitamin E -folic acid)  catecholamines (dopamine-norepinephrine)  Other drugs (quinine-salicylic acid–morphine-barbiturates –lysergic acid diethylamide (LSD))  to measure the amount of impurities present in the sample.