Downloaded 1,367 times
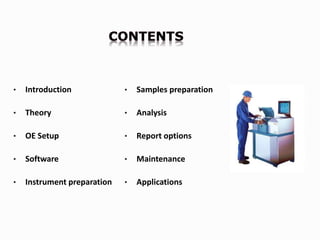

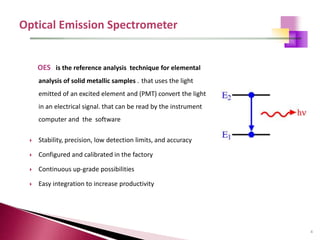
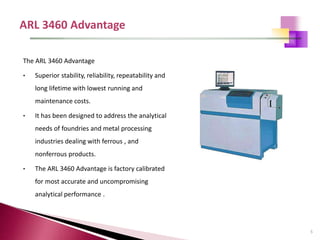
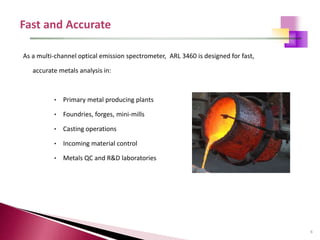

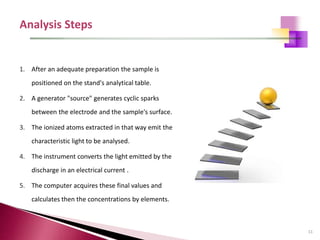
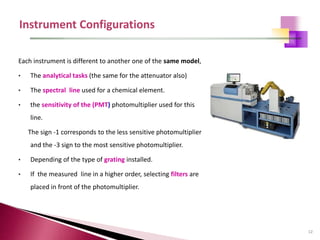
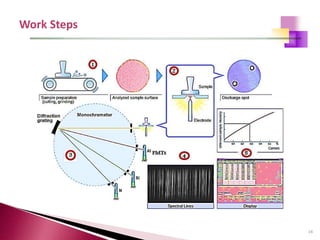
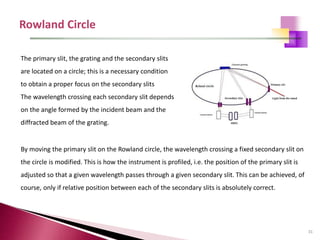

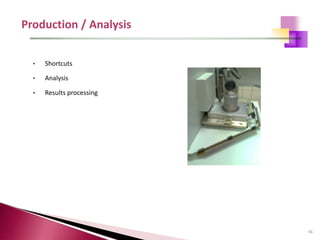


The document provides a comprehensive overview of Optical Emission Spectrometry (OES), detailing its theory, setup, instrument preparation, sample analysis, and applications within metal processing industries. It highlights the functionality and advantages of the ARL 3460 spectrometer, including its stability, precision, and the calibration process necessary for accurate elemental analysis. Additionally, it outlines the operational components of the spectrometer, including its excitation source, optical system, and the integrated software for managing analyses and reporting results.


