Downloaded 4,794 times
![Introduction
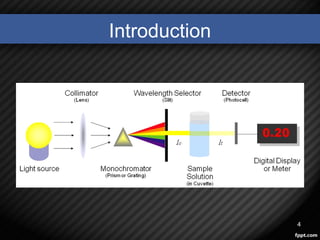
• The spectrophotometer technique is to measures light
intensity as a function of wavelength.
• It does this by:
1. diffracting the light beam into a spectrum of wavelengths
2. direct it to an object
3. receiving the light reflected or returned from the object
4. detecting the intensities with a charge-coupled device
5. displaying the results as a graph on the detector and then
the display device .[1],[2]
3](https://image.slidesharecdn.com/spect-130624080913-phpapp02/85/Spectrophotometry-Instruments-Applications-3-320.jpg)
![Introduction
• Spectrophotometer:
a)Single-beam
b) Double-beam
[4] 5](https://image.slidesharecdn.com/spect-130624080913-phpapp02/85/Spectrophotometry-Instruments-Applications-5-320.jpg)
![Introdution
• compounds absorb light radiation of a specific wavelength.
• the amount of light radiation absorbed by a sample is
measured.
• The light absorption is directly related to the concentration of
the compound in the sample.
• As Concentration increases, light Absorption increases,
linearly, As Concentration increases, light Transmission
decreases, exponentially.[3]
6](https://image.slidesharecdn.com/spect-130624080913-phpapp02/85/Spectrophotometry-Instruments-Applications-6-320.jpg)
![Beer-Lambert law
• Light Absorbance: (A) = log (I0 / I)= LCƐ
• Light Transmission (T) = I/I0 = 10- CLƐ
• I0: Light Intensity entering a sample
• I: Light Intensity exiting a sample
• C: The concentration of analyte in sample
• L: The length of the light path in glass sample cuvette
• Ɛ: a constant for a particular solution and wave
length
7
[5]](https://image.slidesharecdn.com/spect-130624080913-phpapp02/85/Spectrophotometry-Instruments-Applications-7-320.jpg)
![Instruments
• Light source: provide a sufficient of light
which is suitable for marking a measurement.
• The light source typically yields a high output of
polychromatic light over a wide range of the
spectrum.[4]
8](https://image.slidesharecdn.com/spect-130624080913-phpapp02/85/Spectrophotometry-Instruments-Applications-8-320.jpg)
![Instruments
• Monochromator : Accepts polychromatic input light
from a lamp and outputs monochromatic light.
• Monochromator consists of these parts:
I. Entrance slit
II. Collimating lens or mirror
III.Dispersion element
IV.Focusing lens or mirror
V. Exit slit [6]
9](https://image.slidesharecdn.com/spect-130624080913-phpapp02/85/Spectrophotometry-Instruments-Applications-9-320.jpg)
![Instruments
• Dispersion devices: A special plate with
hundreds of parallel grooved lines.
• The grooved lines act to separate the white light
into the visible light spectrum.
10
The more lines
the smaller
the wavelength
resolution.[5]](https://image.slidesharecdn.com/spect-130624080913-phpapp02/85/Spectrophotometry-Instruments-Applications-10-320.jpg)
![Instruments
• Focusing devices: Combinations of lenses,
slits, and mirrors.
• relay and focus light through the instrument.[2]
11](https://image.slidesharecdn.com/spect-130624080913-phpapp02/85/Spectrophotometry-Instruments-Applications-11-320.jpg)
![Instruments
• Cuvettes: designed to hold samples for
spectroscopic experiments. made of Plastic, glass
or optical grade quartz
• should be as clear as possible, without impurities
that might affect a spectroscopic reading.[2]
12](https://image.slidesharecdn.com/spect-130624080913-phpapp02/85/Spectrophotometry-Instruments-Applications-12-320.jpg)
![Instruments
• Detectors: Convert radiant energy (photons)
into an electrical signal.
The photocell and phototube are the simplest
photodetectors, producing current proportional
to the intensity of the light striking Them .[1],[2]
13](https://image.slidesharecdn.com/spect-130624080913-phpapp02/85/Spectrophotometry-Instruments-Applications-13-320.jpg)
![Instruments
• Display devices: The data from a detector
are displayed by a readout device, such as an
analog meter, a light beam reflected on a scale,
or a digital display , or LCD .
• The output can also be transmitted to a
computer or printer. [3]
14](https://image.slidesharecdn.com/spect-130624080913-phpapp02/85/Spectrophotometry-Instruments-Applications-14-320.jpg)
![Applications
1. Concentration measurement
– Prepare samples
– Make series of standard solutions of known concentrations
[4]
15](https://image.slidesharecdn.com/spect-130624080913-phpapp02/85/Spectrophotometry-Instruments-Applications-15-320.jpg)
![Applications
− Set spectrophotometer to the λ of maximum light
absorption
− Measure the absorption of the unknown, and
from the standard plot, read the related
concentration[4]
16](https://image.slidesharecdn.com/spect-130624080913-phpapp02/85/Spectrophotometry-Instruments-Applications-16-320.jpg)
![Applications
2. Detection of Impurities
•UV absorption spectroscopy is one of the
best methods for determination of impurities in
organic molecules. [7]
17
Additional peaks can be
observed due to impurities
in the sample and it can be
compared with that of
standard raw material.](https://image.slidesharecdn.com/spect-130624080913-phpapp02/85/Spectrophotometry-Instruments-Applications-17-320.jpg)
![Applications
3. Structure elucidation of organic compounds.
•From the location of peaks and combination of
peaks UV spectroscopy elucidate structure of
organic molecules:
othe presence or absence of unsaturation,
othe presence of hetero atoms.[7]
18](https://image.slidesharecdn.com/spect-130624080913-phpapp02/85/Spectrophotometry-Instruments-Applications-18-320.jpg)
![Applications
4. Chemical kinetics
•Kinetics of reaction can also be studied using
UV spectroscopy. The UV radiation is passed
through the reaction cell and the absorbance
changes can be observed.[7]
19](https://image.slidesharecdn.com/spect-130624080913-phpapp02/85/Spectrophotometry-Instruments-Applications-19-320.jpg)
![Applications
5. Detection of Functional Groups
•Absence of a band at particular wavelength
regarded as an evidence for absence of particular
group [5]
20](https://image.slidesharecdn.com/spect-130624080913-phpapp02/85/Spectrophotometry-Instruments-Applications-20-320.jpg)
![Applications
6. Molecular weight determination
•Molecular weights of compounds can be
measured spectrophotometrically by preparing the
suitable derivatives of these compounds.
•For example, if we want to determine
the molecular weight of amine then it is converted
in to amine picrate. [7]
21](https://image.slidesharecdn.com/spect-130624080913-phpapp02/85/Spectrophotometry-Instruments-Applications-21-320.jpg)
![References
[1] The principles of use of a spectrophotometer and its application in
the measurement of dental shades[2003]
[2] Chapter 11 Spectrophotometer
[3] Fundamentals of UV-visible spectroscopy, Tony Owen, 1996
[4] UV/Visible Spectrophotometer, Mecasys Co., Ltd. , Mar2006
[5] Spectrophotometry FUNDAMENTALS (Chapters 17, 19, 20), Dr. G.
Van Biesen, Win2011
[6] http://www.bio.davidson.edu
[7] UNIT: Spectrophotometry, Clinical Chemistry Lab Manual
22](https://image.slidesharecdn.com/spect-130624080913-phpapp02/85/Spectrophotometry-Instruments-Applications-22-320.jpg)

This document discusses spectrophotometry, including the Beer-Lambert law, instruments used, and applications. Spectrophotometry measures light intensity as a function of wavelength by diffracting light into a spectrum and detecting intensities. Instruments include a light source, monochromator to produce monochromatic light, cuvettes to hold samples, and detectors to convert light to electrical signals. Applications include concentration measurement using standard solutions, detecting impurities, structure elucidation of organic compounds, studying chemical kinetics, and determining functional groups and molecular weights.


![Getting Started with Apache Spark: Big Data Made Simple [Free Meetup]](https://cdn.slidesharecdn.com/ss_thumbnails/apachesparkgettingstarted-260203175547-8361bcc3-thumbnail.jpg?width=640&height=640&fit=bounds)


