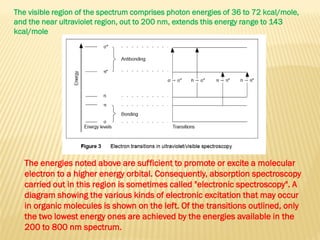
Download as PDF, PPTX


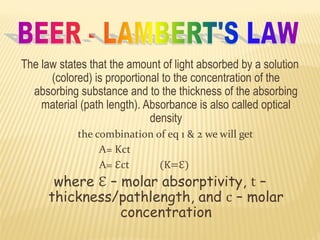

![Spectrophotometer:
a) Single-beam
b) Double-beam
[4]](https://image.slidesharecdn.com/uvspec-160731175526/85/UV-rays-29-320.jpg)
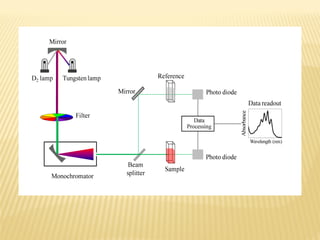
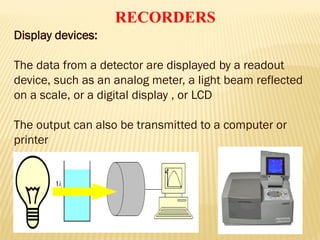
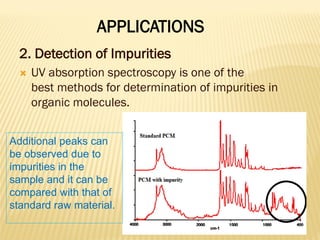
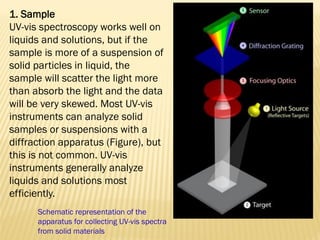

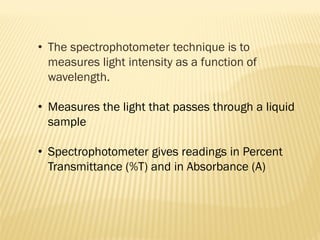
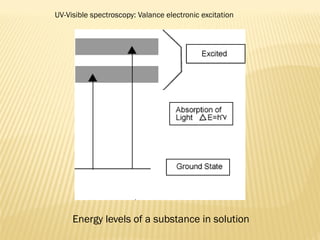
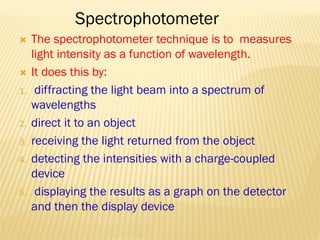
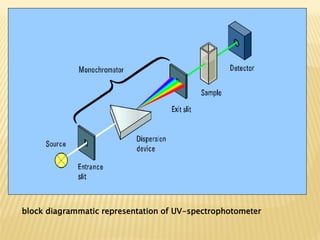
UV-Visible spectrophotometry involves measuring light intensity as a function of wavelength. A spectrophotometer directs light through a sample and measures the transmitted light intensities using a charged coupled device detector. It displays the results as a graph of absorbance versus wavelength. UV-Vis spectroscopy can be used to determine concentrations, detect impurities, elucidate organic structures, and study chemical kinetics by observing changes in absorbance.