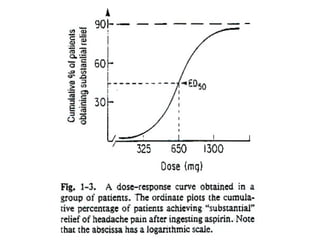
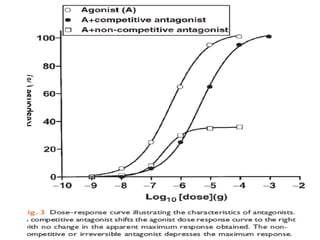
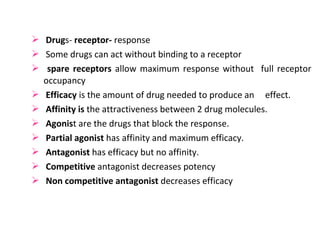
The document discusses key concepts related to dose-response relationships for drugs. It defines important terms like dose, response, and dose-response curves. It explains that the dose-response relationship depends on multiple factors and describes the difference between main and side effects. Additionally, it provides details about graded and quantal dose-response curves and their characteristics. Metrics like potency, efficacy, slope, and variability that are used to analyze dose-response relationships are also outlined.

![Efficacy
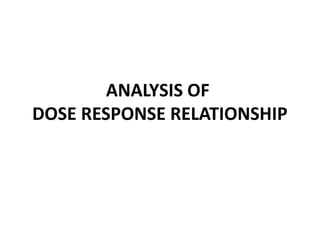
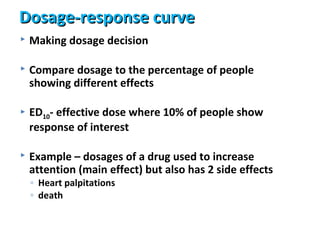
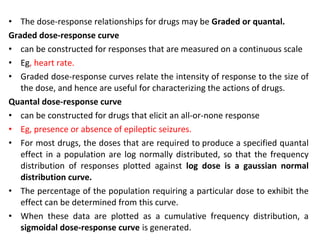
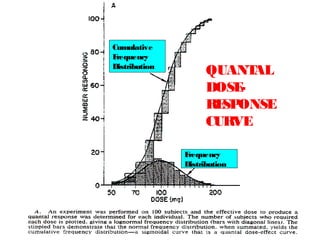
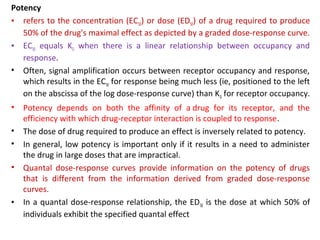
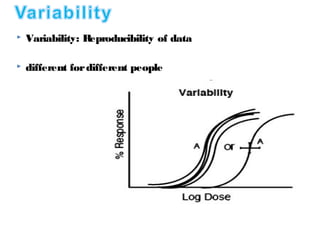
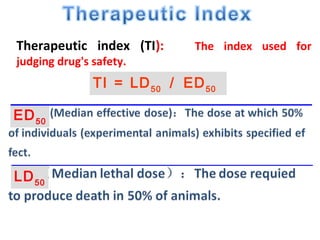
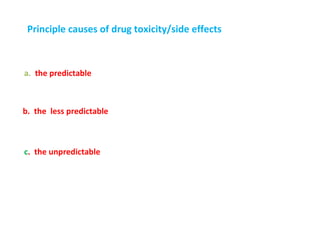
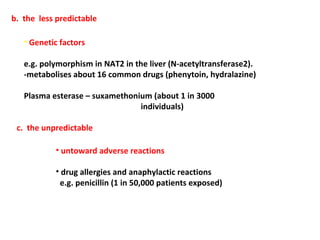
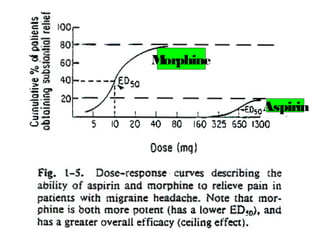
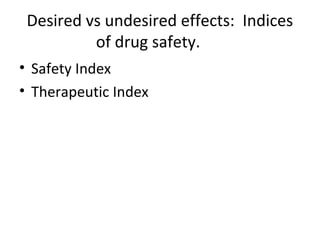
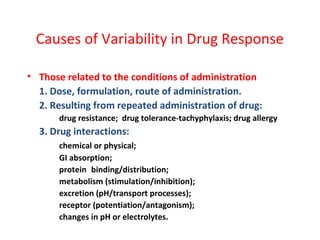
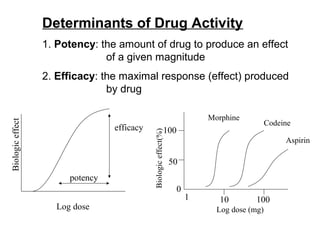
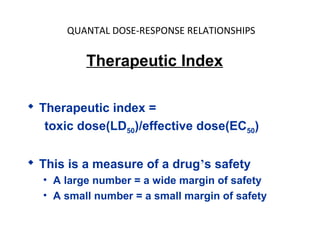
• Efficacy – how large an effect the drug produces
• Maximum effect obtained with drug (not potency)
100
Response 50 2
0
1
E 50
D
L Drug Concentration [M
og olar]](https://image.slidesharecdn.com/2-doseresprelationsppresentsn-copy-copy-130403020526-phpapp02/85/2-dose-resp-relationsp-presentsn-copy-copy-21-320.jpg)
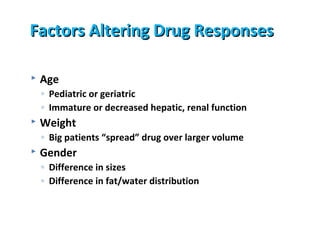
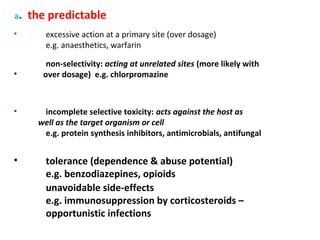
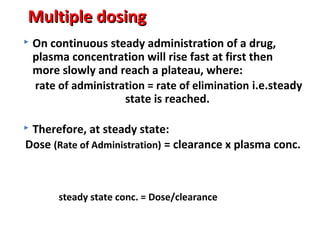
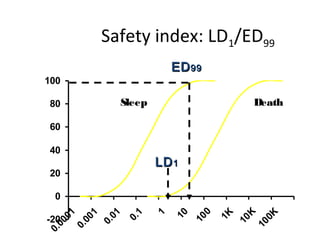
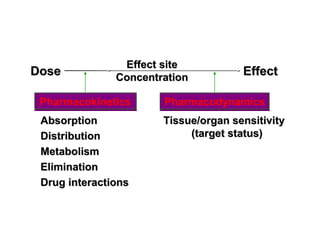
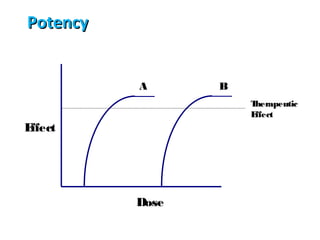
![DOSE-RESPONSE RELATIONSHIPS
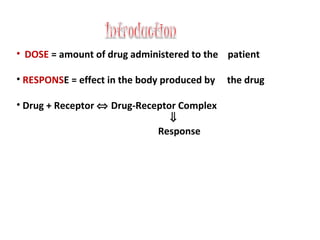
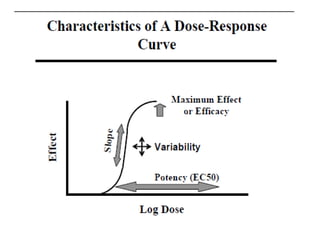
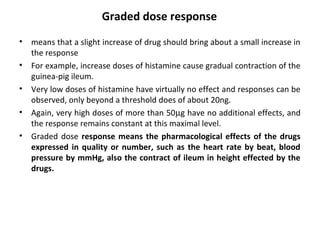
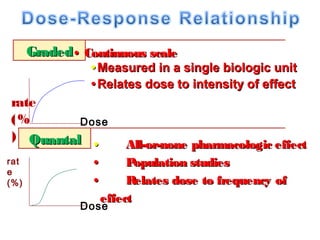
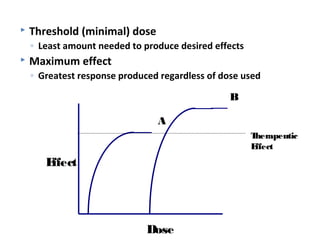
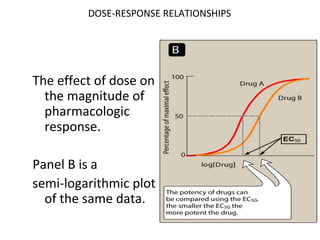
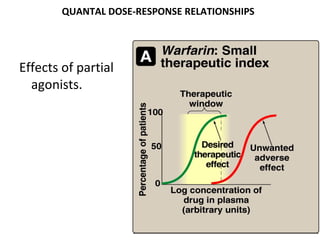
The effect of dose on the
magnitude of
pharmacologic
response.
Panel A is a linear graph.
EffectMax • [Drug]
*Effect =
KD + [Drug]
* E 50=drug dose that shows fifty
C
percent of maximal response.](https://image.slidesharecdn.com/2-doseresprelationsppresentsn-copy-copy-130403020526-phpapp02/85/2-dose-resp-relationsp-presentsn-copy-copy-51-320.jpg)
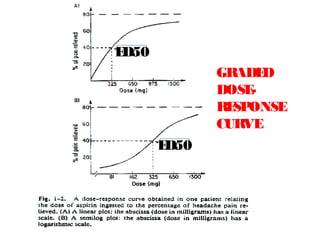
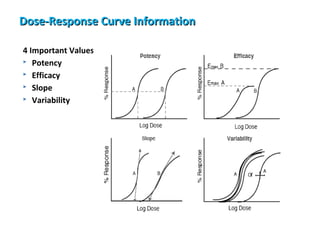
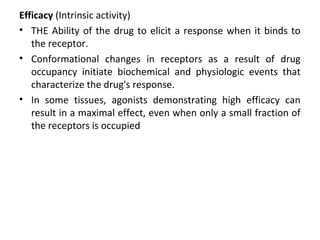
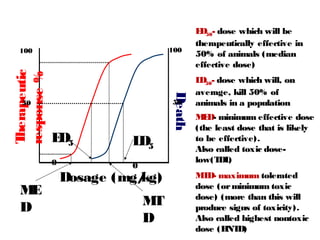
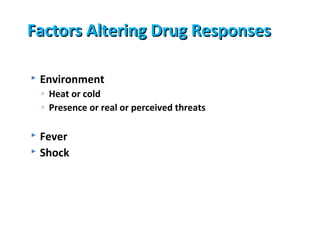
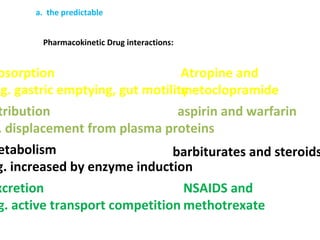
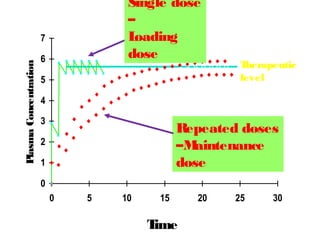
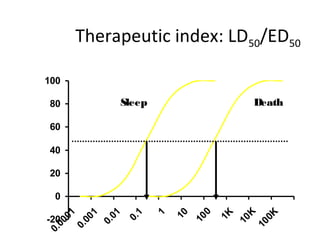
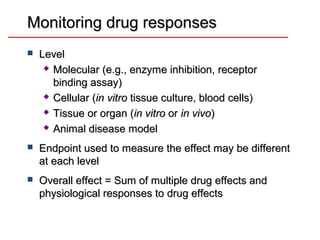
![DOSE-RESPONSE RELATIONSHIPS
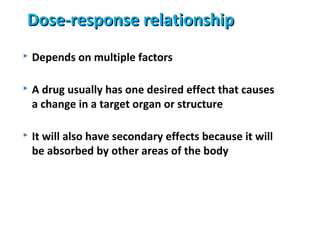
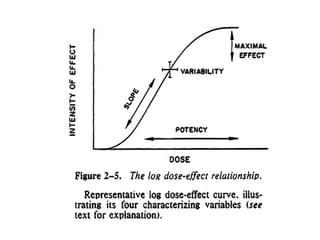
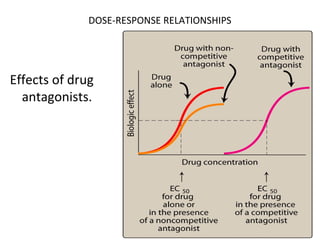
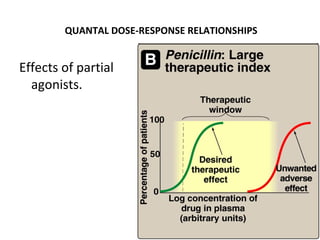
Effects of partial
agonists.
Full Agonist
Partial Agonist
ES NOPS E R
Antagonist
-1 0 1 2
Log([A]/KA)](https://image.slidesharecdn.com/2-doseresprelationsppresentsn-copy-copy-130403020526-phpapp02/85/2-dose-resp-relationsp-presentsn-copy-copy-56-320.jpg)


![Clinical Pharmacokinetics-II [dosing of drugs, tdm]](https://cdn.slidesharecdn.com/ss_thumbnails/clinicalpk-iidosingofdrugstdm-140217020047-phpapp02-thumbnail.jpg?width=640&height=640&fit=bounds)


