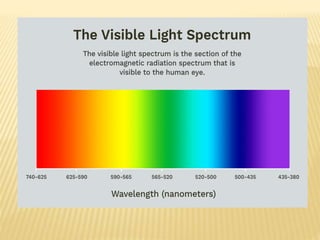
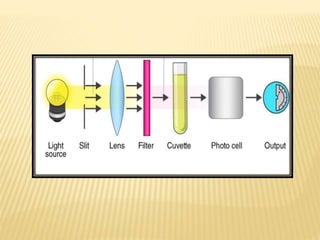
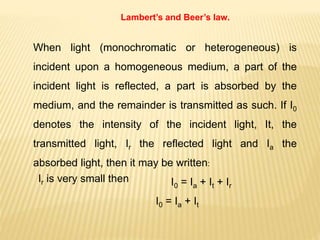
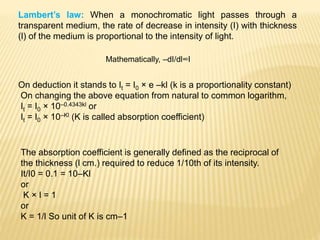
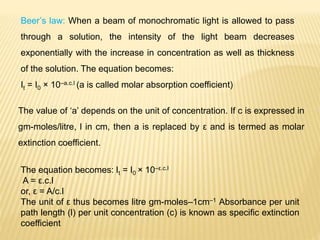
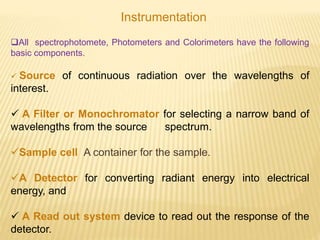
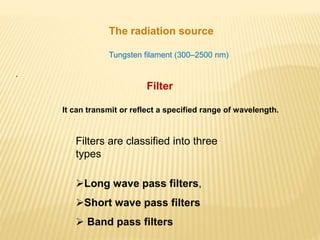
SlideShare a Scribd company logo
VISIBLE SPECTROPHOTOMETRY AND
COLORIMETRY
BY
DR. NEETU SONI ,SHUATS, PRAYAGRAJ
Instrumental visible spectroscopy is a
logical extension of the color tests and
visual observations. It is a sensitive,
accurate method of measuring the
colors or mixtures of colors that our
eyes perceive.
Spectrophotometry is the quantitative measurement
of how much a chemical substance absorbs light by
passing a beam of light through the sample using a
spectrophotometer. By measuring the intensity of
light detected, this method can be used to determine
the concentration of solute in the sample.
The visible light spectrum is the segment of
the electromagnetic spectrum that the
human eye can view. More simply, this range
of wavelengths is called visible light.
Typically, the human eye can detect
wavelengths from 380 to 700 nanometers.
Spectrophotometer
The spectrophotometer refers to an
instrument that measures the absorbance of
the test sample at a specific wavelength by
measuring the amount of light transmitted by
the sample. This device contains several
components like a light source, collimator,
monochromator, cuvette, light detector, and
digital meter.
Colorimetry is a scientific technique that
is used to determine the concentration of
colored compounds in solutions by the
application of the Beer–Lambert law,
which states that the concentration of a
solute is proportional to the absorbance.
Theory of spectrophotometry and
colorimetry
When light (monochromatic or heterogeneous) is
incident upon a homogeneous medium, a part of the
incident light is reflected, a part is absorbed by the
medium, and the remainder is transmitted as such.
Color comparison was one of the oldest methods
used for quantitative estimation of elements and
substances. The variation of a color of a system
with change in concentration of some components
forms the basis of colorimetric analysis.
In visual colorimetry, natural or artificial white light
(the whole range of the visible radiation is from
400-760 nm) is generally used as a light source
and determinations are usually made with a simple
instrument termed as colorimeter or color
comparator.
Lambert’s and Beer’s law.
When light (monochromatic or heterogeneous) is
incident upon a homogeneous medium, a part of the
incident light is reflected, a part is absorbed by the
medium, and the remainder is transmitted as such. If I0
denotes the intensity of the incident light, It, the
transmitted light, Ir the reflected light and Ia the
absorbed light, then it may be written:
I0 = Ia + It + Ir
Ir is very small then
I0 = Ia + It
Lambert’s law: When a monochromatic light passes through a
transparent medium, the rate of decrease in intensity (I) with thickness
(l) of the medium is proportional to the intensity of light.
Mathematically, –dI/dl∞I
On deduction it stands to It = I0 × e –kl (k is a proportionality constant)
On changing the above equation from natural to common logarithm,
It = I0 × 10–0.4343kl or
It = I0 × 10–Kl (K is called absorption coefficient)
The absorption coefficient is generally defined as the reciprocal of
the thickness (l cm.) required to reduce 1/10th of its intensity.
It/I0 = 0.1 = 10–Kl
or
K × l = 1
or
K = 1/l So unit of K is cm–1
The ratio (It/I0) is termed as Transmittance (T)
The ratio (I0/It) is termed as Opacity
log(I0/It)is termed as the Absorbance (A) of the medium or
Optical density (OD).
Beer’s law: When a beam of monochromatic light is allowed to pass
through a solution, the intensity of the light beam decreases
exponentially with the increase in concentration as well as thickness
of the solution. The equation becomes:
It = I0 × 10–a.c.l (a is called molar absorption coefficient)
The value of ‘a’ depends on the unit of concentration. If c is expressed in
gm-moles/litre, l in cm, then a is replaced by ε and is termed as molar
extinction coefficient.
The equation becomes: It = I0 × 10–ε.c.l
A = ε.c.l
or, ε = A/c.l
The unit of ε thus becomes litre gm-moles–1cm–1 Absorbance per unit
path length (l) per unit concentration (c) is known as specific extinction
coefficient
Instrumentation
All spectrophotomete, Photometers and Colorimeters have the following
basic components.
 Source of continuous radiation over the wavelengths of
interest.
 A Filter or Monochromator for selecting a narrow band of
wavelengths from the source spectrum.
Sample cell A container for the sample.
A Detector for converting radiant energy into electrical
energy, and
 A Read out system device to read out the response of the
detector.
The radiation source
Tungsten filament (300–2500 nm)
.
Filter
It can transmit or reflect a specified range of wavelength.
Filters are classified into three
types
Long wave pass filters,
Short wave pass filters
 Band pass filters
Types of filter from the viewpoint of function
(1) Absorption filter : a filter which absorbs a specific
range of wavelengths, for examples, colored filter
glass and gelatin filter.
(2) Interference filter : a filter which transmits a specific
range of wavelengths by utilizing the interference effect of
a thin film.
Prisms
A prism disperses polychromatic light from the source
into its constituent wavelengths by virtue of its ability to
reflect different wavelengths to a different extent
Two types of Prisms are usually employed in commercial
instruments. Namely, 600 cornu quartz prism and
300 Littrow Prism.
Grating
Gratings are often used in the monochromators of
spectrophotometers operating ultraviolet, visible and infrared
regions.
Monochromator
(1) entrance slit, (2) collimating mirror (to form a parallel beam after the slit),
(3) diffraction grating (dispersive element), (4) camera mirror (focuses light from
the dispersive element onto the exit slit), and (5) exit slit.
Detectors
Detectors are instruments that measure the amount of
ultraviolet or visible light absorbed by the sample
molecules.
In order to detect radiation three types of photosensitive
devices are
Photovoltaic cell
Phototubes
Photomultiplier
Photovoltaic cell
The Photovoltaic cell is the semiconductor device that converts the light
into electrical energy. The voltage induces by the PV cell depends on the
intensity of light incident on it.
Phototubes
Phototube is also known as a photoelectric cell.
It is filled with gas under low pressure.
It contains a light-sensitive cathode and anode inside an evacuated
quartz envelope.
A photon entering the tube strikes the cathode and leads to the ejection
of an electron.
 Electrons strikes the anode and results in the flow of current. The
resulting current is of low intensity and requires amplification.
The response in the phototube depends on the wavelength of incident
light.
Phototubes
Photomultiplier tube is used in UV-Vis spectrophotometers.
 It has an anode, cathode, and many dynodes.
Photon when entering the tube, strikes the cathode, resulting in
the emission of electrons.
The emitted electrons are accelerated towards the first dynode,
An electron striking the first dynode will result in the production of
several electrons.
The process repeats itself continuously from one dynode to
another and after passing to 10 dynodes.
Photomultiplier Tube
A colorimeter is an instrument that compares the amount of
light getting through a solution with the amount that can get
through a sample of pure solvent.
Visual comparators
•Multiple standard method
•Duplication Method
•Dilution methods
•Balancing method
Colorimeter
Dubosq colorimeter
Application of colorimetry and
spectrophotometry:
(i) Determination of molar composition of complexes.
(ii) Determination of instability constants of complexes.
(iii) Determination of pK value of an indicator.
(iv) Elucidation of structures of organic as well as
inorganic compounds.
(v) Determination of molecular weight of colored
substances.

More Related Content

What's hot

Introduction to spectroscopy
Introduction to spectroscopyIntroduction to spectroscopy
Introduction to spectroscopy
Ashish Roge
 
Flame photometry ppt
Flame photometry  pptFlame photometry  ppt
Flame photometry ppt
rdeepthi1
 
U V Visible Spectroscopy
U V Visible SpectroscopyU V Visible Spectroscopy
U V Visible Spectroscopy
Nandakumar Gopinathan
 
UV / Visible Spectroscopy
UV / Visible SpectroscopyUV / Visible Spectroscopy
UV / Visible Spectroscopy
kanhaiya kumawat
 
NEPHLOMETRY and TURBIDIMETRY PPT 1
NEPHLOMETRY and TURBIDIMETRY PPT 1NEPHLOMETRY and TURBIDIMETRY PPT 1
NEPHLOMETRY and TURBIDIMETRY PPT 1
shaisejacob
 
uv -visible spectroscopy
uv -visible spectroscopyuv -visible spectroscopy
uv -visible spectroscopy
yogitamandlik2
 
Detectors
DetectorsDetectors
Detectors
Preeti Choudhary
 
Nephelometry and turbidimetry
Nephelometry and turbidimetryNephelometry and turbidimetry
Nephelometry and turbidimetry
ushaSanmugaraj
 
HPTLC
HPTLCHPTLC
Nephelometry and Turbidimetry
Nephelometry and TurbidimetryNephelometry and Turbidimetry
Nephelometry and Turbidimetry
kumar ganesh
 
Uv visible sprctroscopy ppt
Uv visible sprctroscopy pptUv visible sprctroscopy ppt
Uv visible sprctroscopy ppt
nehla313
 
flame photometry (1).pptx
flame photometry (1).pptxflame photometry (1).pptx
flame photometry (1).pptx
KadDhanashree
 
INSTRUMENTATION OF UV-VISIBLE SPECTROSCOPY
INSTRUMENTATION OF UV-VISIBLE SPECTROSCOPYINSTRUMENTATION OF UV-VISIBLE SPECTROSCOPY
INSTRUMENTATION OF UV-VISIBLE SPECTROSCOPY
Ch. Bhargava krishna
 
column chromatography and ultra high performance liquid chromatography
column chromatography and ultra high performance liquid chromatographycolumn chromatography and ultra high performance liquid chromatography
column chromatography and ultra high performance liquid chromatography
vinitnai
 
Uv-visible spectroscopy
Uv-visible spectroscopyUv-visible spectroscopy
Uv-visible spectroscopy
Mzgin Mohammed
 
Flame Photometry
Flame PhotometryFlame Photometry
Flame Photometry
Damodar Koirala
 
Atomic Absorption Spectroscopy (www.Redicals.com)
Atomic Absorption Spectroscopy (www.Redicals.com)Atomic Absorption Spectroscopy (www.Redicals.com)
Atomic Absorption Spectroscopy (www.Redicals.com)
Goa App
 
INSTRUMENTATIONS UV-VIS.pdf
INSTRUMENTATIONS UV-VIS.pdfINSTRUMENTATIONS UV-VIS.pdf
INSTRUMENTATIONS UV-VIS.pdf
Dr. Dinesh Mehta
 
Flame Spectroscopy Analysis B.Pharma and M/Pharma
Flame Spectroscopy Analysis B.Pharma and M/PharmaFlame Spectroscopy Analysis B.Pharma and M/Pharma
Flame Spectroscopy Analysis B.Pharma and M/Pharma
AmanKapoorMPharma
 
Uv visible spectroscopy
Uv visible spectroscopyUv visible spectroscopy
Uv visible spectroscopy
Nilesh Thakare
 

What's hot (20)

Introduction to spectroscopy
Introduction to spectroscopyIntroduction to spectroscopy
Introduction to spectroscopy
 
Flame photometry ppt
Flame photometry  pptFlame photometry  ppt
Flame photometry ppt
 
U V Visible Spectroscopy
U V Visible SpectroscopyU V Visible Spectroscopy
U V Visible Spectroscopy
 
UV / Visible Spectroscopy
UV / Visible SpectroscopyUV / Visible Spectroscopy
UV / Visible Spectroscopy
 
NEPHLOMETRY and TURBIDIMETRY PPT 1
NEPHLOMETRY and TURBIDIMETRY PPT 1NEPHLOMETRY and TURBIDIMETRY PPT 1
NEPHLOMETRY and TURBIDIMETRY PPT 1
 
uv -visible spectroscopy
uv -visible spectroscopyuv -visible spectroscopy
uv -visible spectroscopy
 
Detectors
DetectorsDetectors
Detectors
 
Nephelometry and turbidimetry
Nephelometry and turbidimetryNephelometry and turbidimetry
Nephelometry and turbidimetry
 
HPTLC
HPTLCHPTLC
HPTLC
 
Nephelometry and Turbidimetry
Nephelometry and TurbidimetryNephelometry and Turbidimetry
Nephelometry and Turbidimetry
 
Uv visible sprctroscopy ppt
Uv visible sprctroscopy pptUv visible sprctroscopy ppt
Uv visible sprctroscopy ppt
 
flame photometry (1).pptx
flame photometry (1).pptxflame photometry (1).pptx
flame photometry (1).pptx
 
INSTRUMENTATION OF UV-VISIBLE SPECTROSCOPY
INSTRUMENTATION OF UV-VISIBLE SPECTROSCOPYINSTRUMENTATION OF UV-VISIBLE SPECTROSCOPY
INSTRUMENTATION OF UV-VISIBLE SPECTROSCOPY
 
column chromatography and ultra high performance liquid chromatography
column chromatography and ultra high performance liquid chromatographycolumn chromatography and ultra high performance liquid chromatography
column chromatography and ultra high performance liquid chromatography
 
Uv-visible spectroscopy
Uv-visible spectroscopyUv-visible spectroscopy
Uv-visible spectroscopy
 
Flame Photometry
Flame PhotometryFlame Photometry
Flame Photometry
 
Atomic Absorption Spectroscopy (www.Redicals.com)
Atomic Absorption Spectroscopy (www.Redicals.com)Atomic Absorption Spectroscopy (www.Redicals.com)
Atomic Absorption Spectroscopy (www.Redicals.com)
 
INSTRUMENTATIONS UV-VIS.pdf
INSTRUMENTATIONS UV-VIS.pdfINSTRUMENTATIONS UV-VIS.pdf
INSTRUMENTATIONS UV-VIS.pdf
 
Flame Spectroscopy Analysis B.Pharma and M/Pharma
Flame Spectroscopy Analysis B.Pharma and M/PharmaFlame Spectroscopy Analysis B.Pharma and M/Pharma
Flame Spectroscopy Analysis B.Pharma and M/Pharma
 
Uv visible spectroscopy
Uv visible spectroscopyUv visible spectroscopy
Uv visible spectroscopy
 

Similar to Visible Spectrophotometry and Colorimetry.pptx

Spectrophoto meter
Spectrophoto meterSpectrophoto meter
Spectrophoto meterNasir Nazeer
 
Spectrophotometry and colorimetry.pdf
Spectrophotometry and colorimetry.pdfSpectrophotometry and colorimetry.pdf
Spectrophotometry and colorimetry.pdf
Ebot Walter Ojong
 
UV-Visible.ppt
UV-Visible.pptUV-Visible.ppt
UV-Visible.ppt
IfraAzhar
 
Spectrophotometer instrumentation & working
Spectrophotometer instrumentation & working Spectrophotometer instrumentation & working
Spectrophotometer instrumentation & working
Sabahat Ali
 
UV rays
UV rays UV rays
UV rays
Goa App
 
8b-EnzymeKinetics-Spec.pdf
8b-EnzymeKinetics-Spec.pdf8b-EnzymeKinetics-Spec.pdf
8b-EnzymeKinetics-Spec.pdf
Daud Khan
 
UV ray spectrophotometer
UV ray spectrophotometerUV ray spectrophotometer
UV ray spectrophotometer
Goa App
 
Ultraviolet and visible spectroscopy
Ultraviolet and visible  spectroscopyUltraviolet and visible  spectroscopy
Ultraviolet and visible spectroscopy
GeetaraniLoushigam
 
Spectrophotometry
SpectrophotometrySpectrophotometry
Spectrophotometry
Nandita Kumari
 
Absorbance
AbsorbanceAbsorbance
Absorbance
Yedhu Mohan
 
Spectrophotometry.pptx
Spectrophotometry.pptxSpectrophotometry.pptx
Spectrophotometry.pptx
wadhava gurumeet
 
Uv/visible spectroscopy
Uv/visible spectroscopyUv/visible spectroscopy
Uv/visible spectroscopy
SavitaBhatt2
 
Uv
UvUv
Photometry
PhotometryPhotometry
Photometry
ShibleeZaman
 
Spectrophotometry
SpectrophotometrySpectrophotometry
Spectrophotometrysuniu
 
PHOTOMETRY.pptx
PHOTOMETRY.pptxPHOTOMETRY.pptx
PHOTOMETRY.pptx
ishtiyakjafarjafar
 
Spectropotometer.08.20 - Copy.ppt
Spectropotometer.08.20 - Copy.pptSpectropotometer.08.20 - Copy.ppt
Spectropotometer.08.20 - Copy.ppt
diptodas18
 
Spectrophotometer
SpectrophotometerSpectrophotometer
Spectroscopy
SpectroscopySpectroscopy
Spectroscopy
Iram Qaiser
 
Colorimetry, spectrophotometry and nephelometry.pptx
Colorimetry, spectrophotometry and nephelometry.pptxColorimetry, spectrophotometry and nephelometry.pptx
Colorimetry, spectrophotometry and nephelometry.pptx
padmasreepaddu2
 

Similar to Visible Spectrophotometry and Colorimetry.pptx (20)

Spectrophoto meter
Spectrophoto meterSpectrophoto meter
Spectrophoto meter
 
Spectrophotometry and colorimetry.pdf
Spectrophotometry and colorimetry.pdfSpectrophotometry and colorimetry.pdf
Spectrophotometry and colorimetry.pdf
 
UV-Visible.ppt
UV-Visible.pptUV-Visible.ppt
UV-Visible.ppt
 
Spectrophotometer instrumentation & working
Spectrophotometer instrumentation & working Spectrophotometer instrumentation & working
Spectrophotometer instrumentation & working
 
UV rays
UV rays UV rays
UV rays
 
8b-EnzymeKinetics-Spec.pdf
8b-EnzymeKinetics-Spec.pdf8b-EnzymeKinetics-Spec.pdf
8b-EnzymeKinetics-Spec.pdf
 
UV ray spectrophotometer
UV ray spectrophotometerUV ray spectrophotometer
UV ray spectrophotometer
 
Ultraviolet and visible spectroscopy
Ultraviolet and visible  spectroscopyUltraviolet and visible  spectroscopy
Ultraviolet and visible spectroscopy
 
Spectrophotometry
SpectrophotometrySpectrophotometry
Spectrophotometry
 
Absorbance
AbsorbanceAbsorbance
Absorbance
 
Spectrophotometry.pptx
Spectrophotometry.pptxSpectrophotometry.pptx
Spectrophotometry.pptx
 
Uv/visible spectroscopy
Uv/visible spectroscopyUv/visible spectroscopy
Uv/visible spectroscopy
 
Uv
UvUv
Uv
 
Photometry
PhotometryPhotometry
Photometry
 
Spectrophotometry
SpectrophotometrySpectrophotometry
Spectrophotometry
 
PHOTOMETRY.pptx
PHOTOMETRY.pptxPHOTOMETRY.pptx
PHOTOMETRY.pptx
 
Spectropotometer.08.20 - Copy.ppt
Spectropotometer.08.20 - Copy.pptSpectropotometer.08.20 - Copy.ppt
Spectropotometer.08.20 - Copy.ppt
 
Spectrophotometer
SpectrophotometerSpectrophotometer
Spectrophotometer
 
Spectroscopy
SpectroscopySpectroscopy
Spectroscopy
 
Colorimetry, spectrophotometry and nephelometry.pptx
Colorimetry, spectrophotometry and nephelometry.pptxColorimetry, spectrophotometry and nephelometry.pptx
Colorimetry, spectrophotometry and nephelometry.pptx
 

Recently uploaded

bordetella pertussis.................................ppt
bordetella pertussis.................................pptbordetella pertussis.................................ppt
bordetella pertussis.................................ppt
kejapriya1
 
原版制作(carleton毕业证书)卡尔顿大学毕业证硕士文凭原版一模一样
原版制作(carleton毕业证书)卡尔顿大学毕业证硕士文凭原版一模一样原版制作(carleton毕业证书)卡尔顿大学毕业证硕士文凭原版一模一样
原版制作(carleton毕业证书)卡尔顿大学毕业证硕士文凭原版一模一样
yqqaatn0
 
in vitro propagation of plants lecture note.pptx
in vitro propagation of plants lecture note.pptxin vitro propagation of plants lecture note.pptx
in vitro propagation of plants lecture note.pptx
yusufzako14
 
Orion Air Quality Monitoring Systems - CWS
Orion Air Quality Monitoring Systems - CWSOrion Air Quality Monitoring Systems - CWS
Orion Air Quality Monitoring Systems - CWS
Columbia Weather Systems
 
THE IMPORTANCE OF MARTIAN ATMOSPHERE SAMPLE RETURN.
THE IMPORTANCE OF MARTIAN ATMOSPHERE SAMPLE RETURN.THE IMPORTANCE OF MARTIAN ATMOSPHERE SAMPLE RETURN.
THE IMPORTANCE OF MARTIAN ATMOSPHERE SAMPLE RETURN.
Sérgio Sacani
 
Richard's aventures in two entangled wonderlands
Richard's aventures in two entangled wonderlandsRichard's aventures in two entangled wonderlands
Richard's aventures in two entangled wonderlands
Richard Gill
 
Lateral Ventricles.pdf very easy good diagrams comprehensive
Lateral Ventricles.pdf very easy good diagrams comprehensiveLateral Ventricles.pdf very easy good diagrams comprehensive
Lateral Ventricles.pdf very easy good diagrams comprehensive
silvermistyshot
 
Unveiling the Energy Potential of Marshmallow Deposits.pdf
Unveiling the Energy Potential of Marshmallow Deposits.pdfUnveiling the Energy Potential of Marshmallow Deposits.pdf
Unveiling the Energy Potential of Marshmallow Deposits.pdf
Erdal Coalmaker
 
GBSN - Microbiology (Lab 4) Culture Media
GBSN - Microbiology (Lab 4) Culture MediaGBSN - Microbiology (Lab 4) Culture Media
GBSN - Microbiology (Lab 4) Culture Media
Areesha Ahmad
 
DERIVATION OF MODIFIED BERNOULLI EQUATION WITH VISCOUS EFFECTS AND TERMINAL V...
DERIVATION OF MODIFIED BERNOULLI EQUATION WITH VISCOUS EFFECTS AND TERMINAL V...DERIVATION OF MODIFIED BERNOULLI EQUATION WITH VISCOUS EFFECTS AND TERMINAL V...
DERIVATION OF MODIFIED BERNOULLI EQUATION WITH VISCOUS EFFECTS AND TERMINAL V...
Wasswaderrick3
 
Leaf Initiation, Growth and Differentiation.pdf
Leaf Initiation, Growth and Differentiation.pdfLeaf Initiation, Growth and Differentiation.pdf
Leaf Initiation, Growth and Differentiation.pdf
RenuJangid3
 
BLOOD AND BLOOD COMPONENT- introduction to blood physiology
BLOOD AND BLOOD COMPONENT- introduction to blood physiologyBLOOD AND BLOOD COMPONENT- introduction to blood physiology
BLOOD AND BLOOD COMPONENT- introduction to blood physiology
NoelManyise1
 
Deep Behavioral Phenotyping in Systems Neuroscience for Functional Atlasing a...
Deep Behavioral Phenotyping in Systems Neuroscience for Functional Atlasing a...Deep Behavioral Phenotyping in Systems Neuroscience for Functional Atlasing a...
Deep Behavioral Phenotyping in Systems Neuroscience for Functional Atlasing a...
Ana Luísa Pinho
 
Body fluids_tonicity_dehydration_hypovolemia_hypervolemia.pptx
Body fluids_tonicity_dehydration_hypovolemia_hypervolemia.pptxBody fluids_tonicity_dehydration_hypovolemia_hypervolemia.pptx
Body fluids_tonicity_dehydration_hypovolemia_hypervolemia.pptx
muralinath2
 
Salas, V. (2024) "John of St. Thomas (Poinsot) on the Science of Sacred Theol...
Salas, V. (2024) "John of St. Thomas (Poinsot) on the Science of Sacred Theol...Salas, V. (2024) "John of St. Thomas (Poinsot) on the Science of Sacred Theol...
Salas, V. (2024) "John of St. Thomas (Poinsot) on the Science of Sacred Theol...
Studia Poinsotiana
 
Nucleic Acid-its structural and functional complexity.
Nucleic Acid-its structural and functional complexity.Nucleic Acid-its structural and functional complexity.
Nucleic Acid-its structural and functional complexity.
Nistarini College, Purulia (W.B) India
 
platelets_clotting_biogenesis.clot retractionpptx
platelets_clotting_biogenesis.clot retractionpptxplatelets_clotting_biogenesis.clot retractionpptx
platelets_clotting_biogenesis.clot retractionpptx
muralinath2
 
general properties of oerganologametal.ppt
general properties of oerganologametal.pptgeneral properties of oerganologametal.ppt
general properties of oerganologametal.ppt
IqrimaNabilatulhusni
 
role of pramana in research.pptx in science
role of pramana in research.pptx in sciencerole of pramana in research.pptx in science
role of pramana in research.pptx in science
sonaliswain16
 
erythropoiesis-I_mechanism& clinical significance.pptx
erythropoiesis-I_mechanism& clinical significance.pptxerythropoiesis-I_mechanism& clinical significance.pptx
erythropoiesis-I_mechanism& clinical significance.pptx
muralinath2
 

Recently uploaded (20)

bordetella pertussis.................................ppt
bordetella pertussis.................................pptbordetella pertussis.................................ppt
bordetella pertussis.................................ppt
 
原版制作(carleton毕业证书)卡尔顿大学毕业证硕士文凭原版一模一样
原版制作(carleton毕业证书)卡尔顿大学毕业证硕士文凭原版一模一样原版制作(carleton毕业证书)卡尔顿大学毕业证硕士文凭原版一模一样
原版制作(carleton毕业证书)卡尔顿大学毕业证硕士文凭原版一模一样
 
in vitro propagation of plants lecture note.pptx
in vitro propagation of plants lecture note.pptxin vitro propagation of plants lecture note.pptx
in vitro propagation of plants lecture note.pptx
 
Orion Air Quality Monitoring Systems - CWS
Orion Air Quality Monitoring Systems - CWSOrion Air Quality Monitoring Systems - CWS
Orion Air Quality Monitoring Systems - CWS
 
THE IMPORTANCE OF MARTIAN ATMOSPHERE SAMPLE RETURN.
THE IMPORTANCE OF MARTIAN ATMOSPHERE SAMPLE RETURN.THE IMPORTANCE OF MARTIAN ATMOSPHERE SAMPLE RETURN.
THE IMPORTANCE OF MARTIAN ATMOSPHERE SAMPLE RETURN.
 
Richard's aventures in two entangled wonderlands
Richard's aventures in two entangled wonderlandsRichard's aventures in two entangled wonderlands
Richard's aventures in two entangled wonderlands
 
Lateral Ventricles.pdf very easy good diagrams comprehensive
Lateral Ventricles.pdf very easy good diagrams comprehensiveLateral Ventricles.pdf very easy good diagrams comprehensive
Lateral Ventricles.pdf very easy good diagrams comprehensive
 
Unveiling the Energy Potential of Marshmallow Deposits.pdf
Unveiling the Energy Potential of Marshmallow Deposits.pdfUnveiling the Energy Potential of Marshmallow Deposits.pdf
Unveiling the Energy Potential of Marshmallow Deposits.pdf
 
GBSN - Microbiology (Lab 4) Culture Media
GBSN - Microbiology (Lab 4) Culture MediaGBSN - Microbiology (Lab 4) Culture Media
GBSN - Microbiology (Lab 4) Culture Media
 
DERIVATION OF MODIFIED BERNOULLI EQUATION WITH VISCOUS EFFECTS AND TERMINAL V...
DERIVATION OF MODIFIED BERNOULLI EQUATION WITH VISCOUS EFFECTS AND TERMINAL V...DERIVATION OF MODIFIED BERNOULLI EQUATION WITH VISCOUS EFFECTS AND TERMINAL V...
DERIVATION OF MODIFIED BERNOULLI EQUATION WITH VISCOUS EFFECTS AND TERMINAL V...
 
Leaf Initiation, Growth and Differentiation.pdf
Leaf Initiation, Growth and Differentiation.pdfLeaf Initiation, Growth and Differentiation.pdf
Leaf Initiation, Growth and Differentiation.pdf
 
BLOOD AND BLOOD COMPONENT- introduction to blood physiology
BLOOD AND BLOOD COMPONENT- introduction to blood physiologyBLOOD AND BLOOD COMPONENT- introduction to blood physiology
BLOOD AND BLOOD COMPONENT- introduction to blood physiology
 
Deep Behavioral Phenotyping in Systems Neuroscience for Functional Atlasing a...
Deep Behavioral Phenotyping in Systems Neuroscience for Functional Atlasing a...Deep Behavioral Phenotyping in Systems Neuroscience for Functional Atlasing a...
Deep Behavioral Phenotyping in Systems Neuroscience for Functional Atlasing a...
 
Body fluids_tonicity_dehydration_hypovolemia_hypervolemia.pptx
Body fluids_tonicity_dehydration_hypovolemia_hypervolemia.pptxBody fluids_tonicity_dehydration_hypovolemia_hypervolemia.pptx
Body fluids_tonicity_dehydration_hypovolemia_hypervolemia.pptx
 
Salas, V. (2024) "John of St. Thomas (Poinsot) on the Science of Sacred Theol...
Salas, V. (2024) "John of St. Thomas (Poinsot) on the Science of Sacred Theol...Salas, V. (2024) "John of St. Thomas (Poinsot) on the Science of Sacred Theol...
Salas, V. (2024) "John of St. Thomas (Poinsot) on the Science of Sacred Theol...
 
Nucleic Acid-its structural and functional complexity.
Nucleic Acid-its structural and functional complexity.Nucleic Acid-its structural and functional complexity.
Nucleic Acid-its structural and functional complexity.
 
platelets_clotting_biogenesis.clot retractionpptx
platelets_clotting_biogenesis.clot retractionpptxplatelets_clotting_biogenesis.clot retractionpptx
platelets_clotting_biogenesis.clot retractionpptx
 
general properties of oerganologametal.ppt
general properties of oerganologametal.pptgeneral properties of oerganologametal.ppt
general properties of oerganologametal.ppt
 
role of pramana in research.pptx in science
role of pramana in research.pptx in sciencerole of pramana in research.pptx in science
role of pramana in research.pptx in science
 
erythropoiesis-I_mechanism& clinical significance.pptx
erythropoiesis-I_mechanism& clinical significance.pptxerythropoiesis-I_mechanism& clinical significance.pptx
erythropoiesis-I_mechanism& clinical significance.pptx
 

Visible Spectrophotometry and Colorimetry.pptx

  • 1. VISIBLE SPECTROPHOTOMETRY AND COLORIMETRY BY DR. NEETU SONI ,SHUATS, PRAYAGRAJ
  • 2. Instrumental visible spectroscopy is a logical extension of the color tests and visual observations. It is a sensitive, accurate method of measuring the colors or mixtures of colors that our eyes perceive.
  • 3. Spectrophotometry is the quantitative measurement of how much a chemical substance absorbs light by passing a beam of light through the sample using a spectrophotometer. By measuring the intensity of light detected, this method can be used to determine the concentration of solute in the sample.
  • 4.
  • 5. The visible light spectrum is the segment of the electromagnetic spectrum that the human eye can view. More simply, this range of wavelengths is called visible light. Typically, the human eye can detect wavelengths from 380 to 700 nanometers.
  • 6. Spectrophotometer The spectrophotometer refers to an instrument that measures the absorbance of the test sample at a specific wavelength by measuring the amount of light transmitted by the sample. This device contains several components like a light source, collimator, monochromator, cuvette, light detector, and digital meter.
  • 7. Colorimetry is a scientific technique that is used to determine the concentration of colored compounds in solutions by the application of the Beer–Lambert law, which states that the concentration of a solute is proportional to the absorbance.
  • 8.
  • 9. Theory of spectrophotometry and colorimetry When light (monochromatic or heterogeneous) is incident upon a homogeneous medium, a part of the incident light is reflected, a part is absorbed by the medium, and the remainder is transmitted as such. Color comparison was one of the oldest methods used for quantitative estimation of elements and substances. The variation of a color of a system with change in concentration of some components forms the basis of colorimetric analysis.
  • 10. In visual colorimetry, natural or artificial white light (the whole range of the visible radiation is from 400-760 nm) is generally used as a light source and determinations are usually made with a simple instrument termed as colorimeter or color comparator.
  • 11. Lambert’s and Beer’s law. When light (monochromatic or heterogeneous) is incident upon a homogeneous medium, a part of the incident light is reflected, a part is absorbed by the medium, and the remainder is transmitted as such. If I0 denotes the intensity of the incident light, It, the transmitted light, Ir the reflected light and Ia the absorbed light, then it may be written: I0 = Ia + It + Ir Ir is very small then I0 = Ia + It
  • 12. Lambert’s law: When a monochromatic light passes through a transparent medium, the rate of decrease in intensity (I) with thickness (l) of the medium is proportional to the intensity of light. Mathematically, –dI/dl∞I On deduction it stands to It = I0 × e –kl (k is a proportionality constant) On changing the above equation from natural to common logarithm, It = I0 × 10–0.4343kl or It = I0 × 10–Kl (K is called absorption coefficient) The absorption coefficient is generally defined as the reciprocal of the thickness (l cm.) required to reduce 1/10th of its intensity. It/I0 = 0.1 = 10–Kl or K × l = 1 or K = 1/l So unit of K is cm–1
  • 13. The ratio (It/I0) is termed as Transmittance (T) The ratio (I0/It) is termed as Opacity log(I0/It)is termed as the Absorbance (A) of the medium or Optical density (OD).
  • 14. Beer’s law: When a beam of monochromatic light is allowed to pass through a solution, the intensity of the light beam decreases exponentially with the increase in concentration as well as thickness of the solution. The equation becomes: It = I0 × 10–a.c.l (a is called molar absorption coefficient) The value of ‘a’ depends on the unit of concentration. If c is expressed in gm-moles/litre, l in cm, then a is replaced by ε and is termed as molar extinction coefficient. The equation becomes: It = I0 × 10–ε.c.l A = ε.c.l or, ε = A/c.l The unit of ε thus becomes litre gm-moles–1cm–1 Absorbance per unit path length (l) per unit concentration (c) is known as specific extinction coefficient
  • 15. Instrumentation All spectrophotomete, Photometers and Colorimeters have the following basic components.  Source of continuous radiation over the wavelengths of interest.  A Filter or Monochromator for selecting a narrow band of wavelengths from the source spectrum. Sample cell A container for the sample. A Detector for converting radiant energy into electrical energy, and  A Read out system device to read out the response of the detector.
  • 16. The radiation source Tungsten filament (300–2500 nm) . Filter It can transmit or reflect a specified range of wavelength. Filters are classified into three types Long wave pass filters, Short wave pass filters  Band pass filters
  • 17. Types of filter from the viewpoint of function (1) Absorption filter : a filter which absorbs a specific range of wavelengths, for examples, colored filter glass and gelatin filter. (2) Interference filter : a filter which transmits a specific range of wavelengths by utilizing the interference effect of a thin film.
  • 18. Prisms A prism disperses polychromatic light from the source into its constituent wavelengths by virtue of its ability to reflect different wavelengths to a different extent Two types of Prisms are usually employed in commercial instruments. Namely, 600 cornu quartz prism and 300 Littrow Prism.
  • 19. Grating Gratings are often used in the monochromators of spectrophotometers operating ultraviolet, visible and infrared regions.
  • 20. Monochromator (1) entrance slit, (2) collimating mirror (to form a parallel beam after the slit), (3) diffraction grating (dispersive element), (4) camera mirror (focuses light from the dispersive element onto the exit slit), and (5) exit slit.
  • 21. Detectors Detectors are instruments that measure the amount of ultraviolet or visible light absorbed by the sample molecules. In order to detect radiation three types of photosensitive devices are Photovoltaic cell Phototubes Photomultiplier
  • 22. Photovoltaic cell The Photovoltaic cell is the semiconductor device that converts the light into electrical energy. The voltage induces by the PV cell depends on the intensity of light incident on it.
  • 23. Phototubes Phototube is also known as a photoelectric cell. It is filled with gas under low pressure. It contains a light-sensitive cathode and anode inside an evacuated quartz envelope. A photon entering the tube strikes the cathode and leads to the ejection of an electron.  Electrons strikes the anode and results in the flow of current. The resulting current is of low intensity and requires amplification. The response in the phototube depends on the wavelength of incident light.
  • 25. Photomultiplier tube is used in UV-Vis spectrophotometers.  It has an anode, cathode, and many dynodes. Photon when entering the tube, strikes the cathode, resulting in the emission of electrons. The emitted electrons are accelerated towards the first dynode, An electron striking the first dynode will result in the production of several electrons. The process repeats itself continuously from one dynode to another and after passing to 10 dynodes. Photomultiplier Tube
  • 26.
  • 27.
  • 28. A colorimeter is an instrument that compares the amount of light getting through a solution with the amount that can get through a sample of pure solvent. Visual comparators •Multiple standard method •Duplication Method •Dilution methods •Balancing method Colorimeter
  • 30.
  • 31. Application of colorimetry and spectrophotometry: (i) Determination of molar composition of complexes. (ii) Determination of instability constants of complexes. (iii) Determination of pK value of an indicator. (iv) Elucidation of structures of organic as well as inorganic compounds. (v) Determination of molecular weight of colored substances.