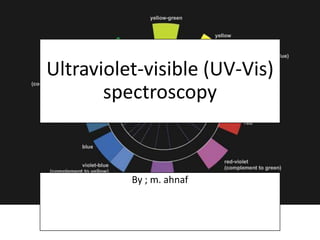
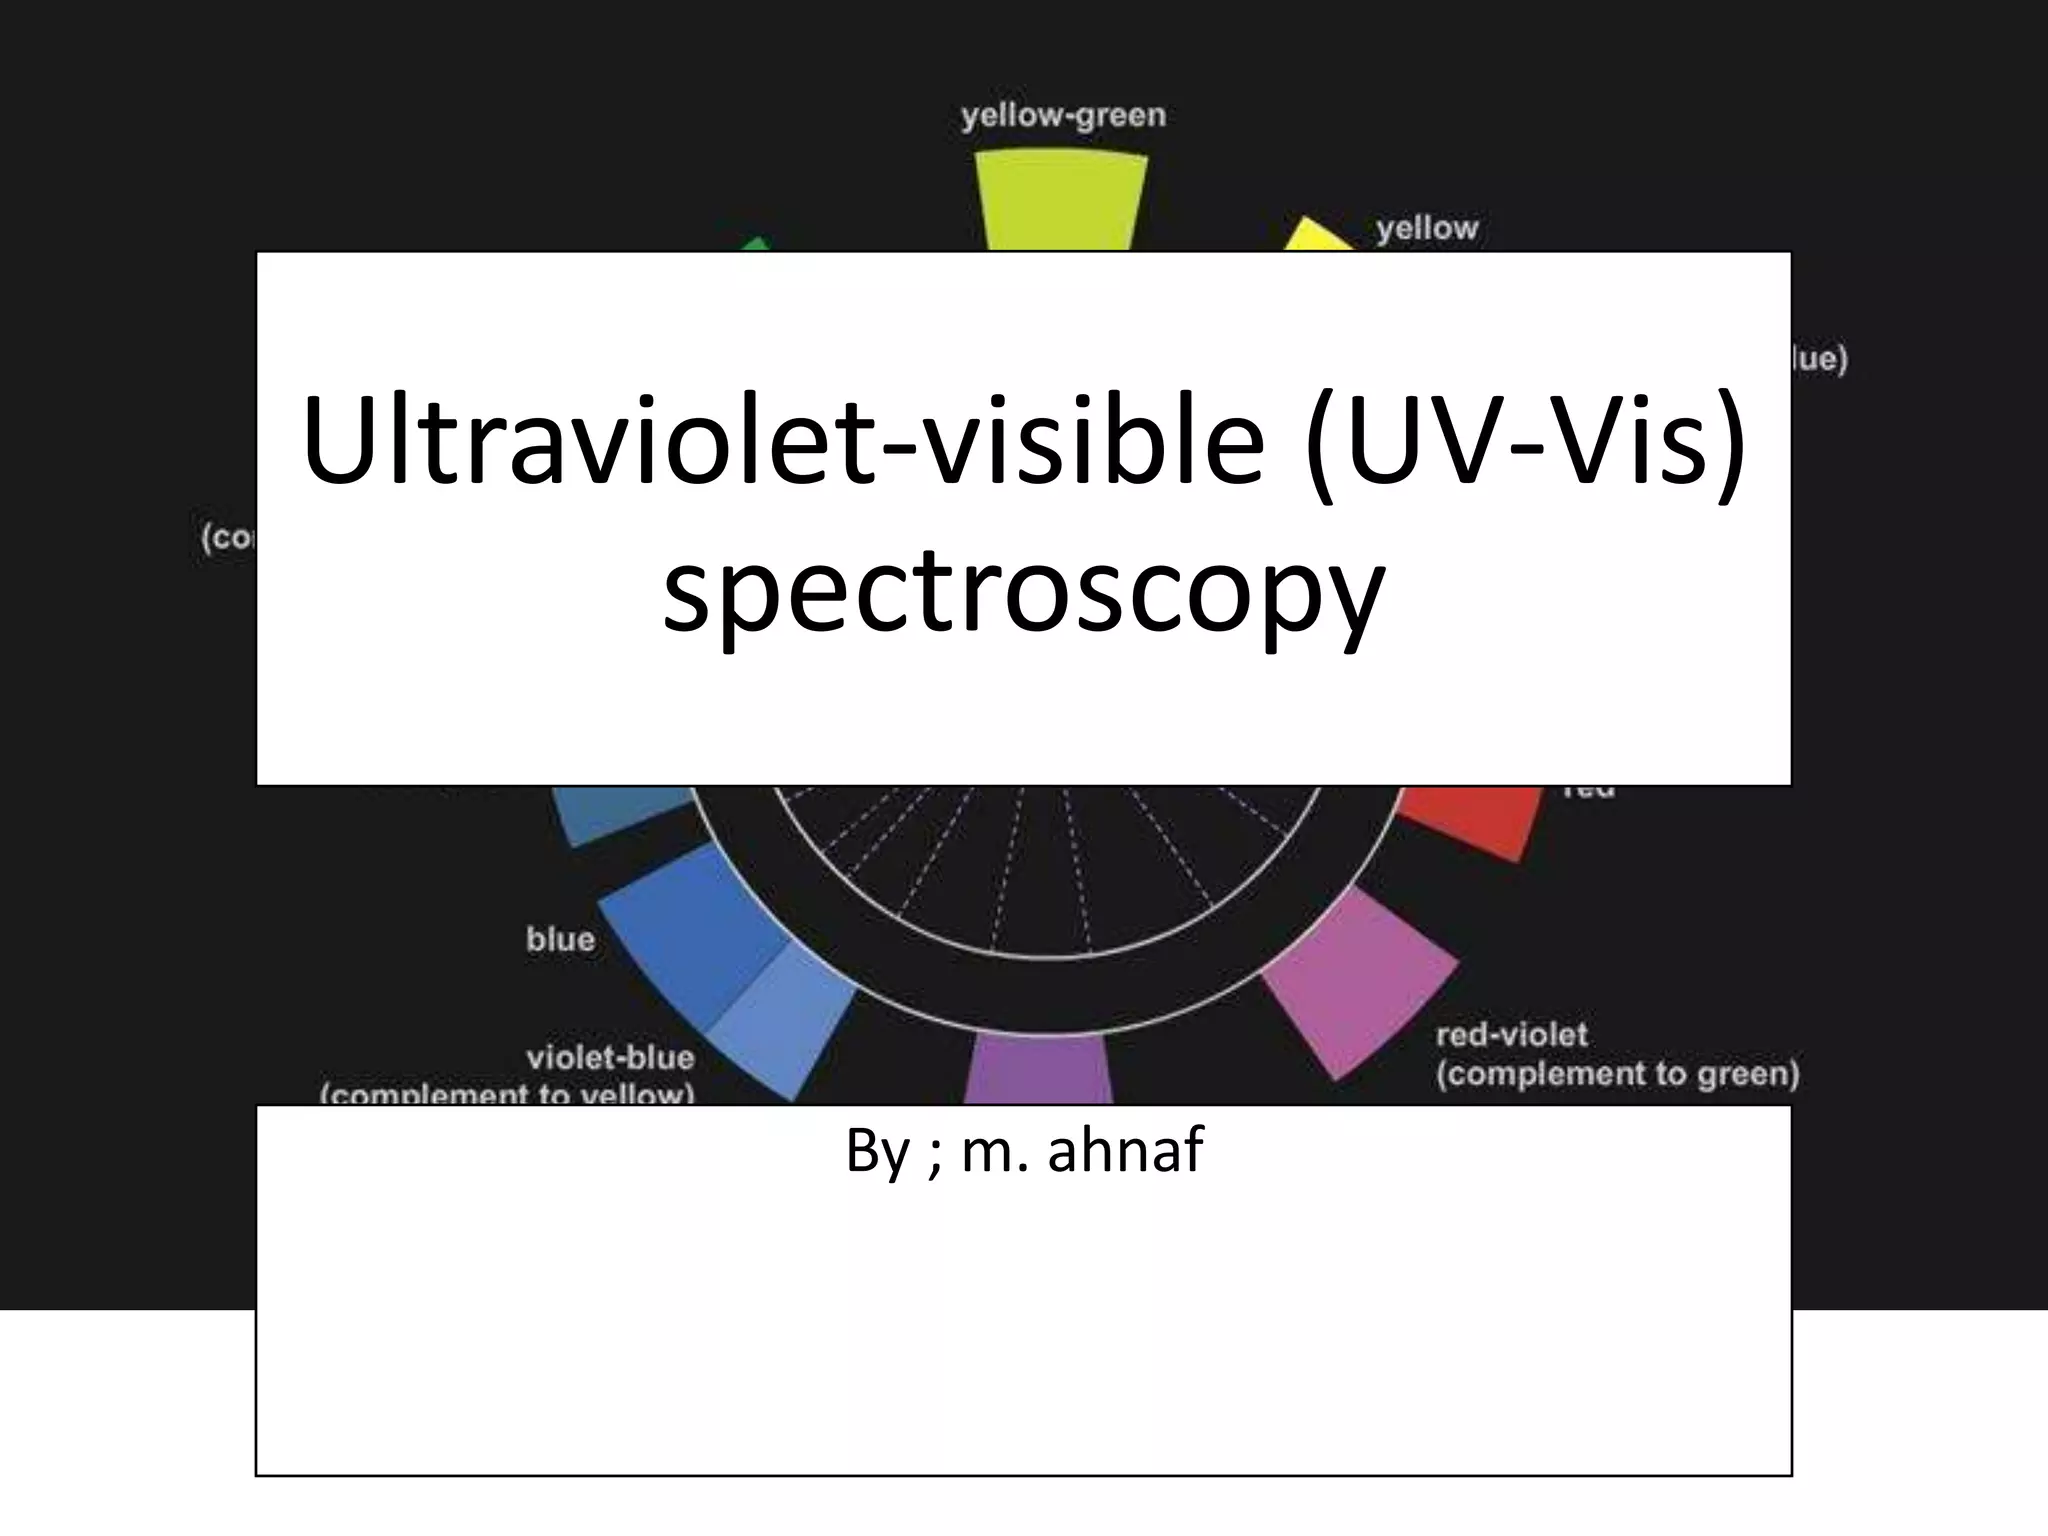
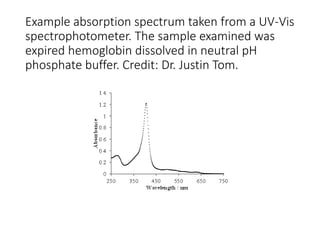
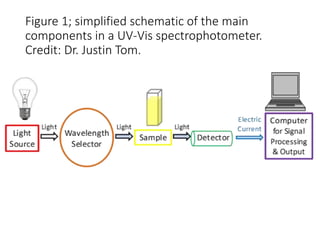
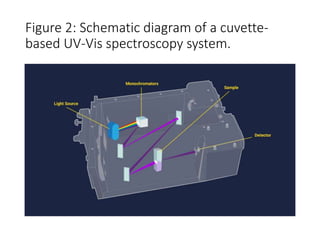
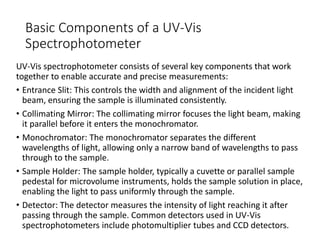
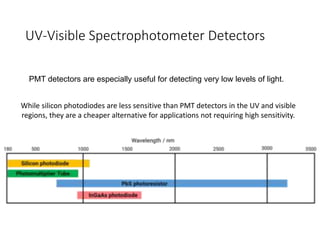
Introduction,Instrumentation, Classification of electronic transitions, Substituent and solvent effects, Classification of electronic transitions
Substituent and solvent effects
Applications of UV Spectroscopy
UV spectral study of alkenes
UV spectral study of poylenes
UV spectral study of α, β-unsaturated carbonyl
UV spectral study of Aromatic compounds
Empirical rules for calculating λmax.
Applications of UV Spectroscopy, Empirical rules for calculating λmax.
Different Sources of radiation used in UV VISIBLE SPECTROSCOPY ANIT Thakur
1. Basics terminology, Transmittance and Absorbance
2. Lamberts Beers Law
3. Advantages and Disadvantages of Lambers Beers Law.
Different Sources of UV Visible spectroscopy,
Hydrogen lamp. deutorium lamp. tugsten filament lamp. mercury lamp. xenon lamp. LEDS. and their advantages and disadvantages.
This presentation gives you thorough knowledge about the IR Spectroscopy. This include basic principle, type of vibrations, factors influencing vibrational frequency, instrumentation and applications of IR Spectroscopy. This is the most widely used technique for identifying unknown functional group depending on the vibrational frequency.
Fourier transform infrared spectroscopy: advantage and disadvantage of conventional infrared spectroscopy, introduction to FTIR ,principle of FTIR, working, advantage, disadvantage and application of FTIR.
Fluorescence , Phosphorescence and photoluminescencePreeti Choudhary
luminescence, fluorescence and example of fluorescence, phosphorescence , Jablonski diagram, Photoluminescence.
https://www.linkedin.com/in/preeti-choudhary-266414182/
https://www.instagram.com/chaudharypreeti1997/
https://www.facebook.com/profile.php?id=100013419194533
https://twitter.com/preetic27018281
Please like, share, comment and follow.
stay connected
If any query then contact:
chaudharypreeti1997@gmail.com
Thanking-You
Preeti Choudhary
A technique to determine concentration of elements in the solution by aspirating this sample into flame. Evaporation, Atomization, Excitation ,Emission and Ionization occur in the flame.
IR SPECTROSCOPY, INTRODUCTION, PRINCIPLE, THEORY, FATE OF ABSORBED RADIATION, FERMI RESONANCE, FINGERPRINT REGION, VIBRATIONS, FACTORS AFFECTING ABSORPTION OF IR RADIATION, SAMPLING TECHNIQUES, APPLICATIONS OF IR SPECTROSCOPY.
details about uv-visible spectroscopy. intoduction to uv-visible spectroscopy with principle,
instrumentation, application, beers lamberts law , detectors. helps to know details about uv-visible spectroscopy. complete notes of uv-visible spectroscopy.
Ultraviolet-visible spectroscopy or ultraviolet-visible spectrophotometry (UV-Vis or UV/Vis) refers to absorption spectroscopy or reflectance spectroscopy in the ultraviolet-visible spectral region. Ultraviolet-Visible (UV-VIS) Spectroscopy is an analytical method that can measure the analyte quantity depending on the amount of light received by the analyte.
http://www.redicals.com
The spectrophotometer technique is to measures light intensity as a function of wavelength.
• Measures the light that passes through a liquid sample
• Spectrophotometer gives readings in Percent Transmittance (%T) and in Absorbance (A)
Spectroscopy is a method which measures the interaction of matter with electromagnetic radiation. it reveals different properties of substances such as absorbance, composition and interaction with other matter
The detailed information of UV Visible Spectroscopy, it includes the information regarding electronic transitions, Electromagnetic radiations, Various shifts.
UV - Visible Spectroscopy detailed information is included .The Spectroscopy study provide the information and the absorbance as well the concentration of the drugs is studied.
Instrumentation of uv visible spectrophotometerTalha Liaqat
A spectrophotometer is an apparatus for measuring the intensity of light in a part of the spectrum, especially as transmitted or emitted by particular substances. The instrumentation of the Spectrophotometer is described in this presentation.
This presentation explores a brief idea about the structural and functional attributes of nucleotides, the structure and function of genetic materials along with the impact of UV rays and pH upon them.
Richard's aventures in two entangled wonderlandsRichard Gill
Since the loophole-free Bell experiments of 2020 and the Nobel prizes in physics of 2022, critics of Bell's work have retreated to the fortress of super-determinism. Now, super-determinism is a derogatory word - it just means "determinism". Palmer, Hance and Hossenfelder argue that quantum mechanics and determinism are not incompatible, using a sophisticated mathematical construction based on a subtle thinning of allowed states and measurements in quantum mechanics, such that what is left appears to make Bell's argument fail, without altering the empirical predictions of quantum mechanics. I think however that it is a smoke screen, and the slogan "lost in math" comes to my mind. I will discuss some other recent disproofs of Bell's theorem using the language of causality based on causal graphs. Causal thinking is also central to law and justice. I will mention surprising connections to my work on serial killer nurse cases, in particular the Dutch case of Lucia de Berk and the current UK case of Lucy Letby.
THE IMPORTANCE OF MARTIAN ATMOSPHERE SAMPLE RETURN.Sérgio Sacani
The return of a sample of near-surface atmosphere from Mars would facilitate answers to several first-order science questions surrounding the formation and evolution of the planet. One of the important aspects of terrestrial planet formation in general is the role that primary atmospheres played in influencing the chemistry and structure of the planets and their antecedents. Studies of the martian atmosphere can be used to investigate the role of a primary atmosphere in its history. Atmosphere samples would also inform our understanding of the near-surface chemistry of the planet, and ultimately the prospects for life. High-precision isotopic analyses of constituent gases are needed to address these questions, requiring that the analyses are made on returned samples rather than in situ.
Nutraceutical market, scope and growth: Herbal drug technologyLokesh Patil
As consumer awareness of health and wellness rises, the nutraceutical market—which includes goods like functional meals, drinks, and dietary supplements that provide health advantages beyond basic nutrition—is growing significantly. As healthcare expenses rise, the population ages, and people want natural and preventative health solutions more and more, this industry is increasing quickly. Further driving market expansion are product formulation innovations and the use of cutting-edge technology for customized nutrition. With its worldwide reach, the nutraceutical industry is expected to keep growing and provide significant chances for research and investment in a number of categories, including vitamins, minerals, probiotics, and herbal supplements.
Seminar of U.V. Spectroscopy by SAMIR PANDASAMIR PANDA
Spectroscopy is a branch of science dealing the study of interaction of electromagnetic radiation with matter.
Ultraviolet-visible spectroscopy refers to absorption spectroscopy or reflect spectroscopy in the UV-VIS spectral region.
Ultraviolet-visible spectroscopy is an analytical method that can measure the amount of light received by the analyte.
Richard's entangled aventures in wonderlandRichard Gill
Since the loophole-free Bell experiments of 2020 and the Nobel prizes in physics of 2022, critics of Bell's work have retreated to the fortress of super-determinism. Now, super-determinism is a derogatory word - it just means "determinism". Palmer, Hance and Hossenfelder argue that quantum mechanics and determinism are not incompatible, using a sophisticated mathematical construction based on a subtle thinning of allowed states and measurements in quantum mechanics, such that what is left appears to make Bell's argument fail, without altering the empirical predictions of quantum mechanics. I think however that it is a smoke screen, and the slogan "lost in math" comes to my mind. I will discuss some other recent disproofs of Bell's theorem using the language of causality based on causal graphs. Causal thinking is also central to law and justice. I will mention surprising connections to my work on serial killer nurse cases, in particular the Dutch case of Lucia de Berk and the current UK case of Lucy Letby.
Introduction:
RNA interference (RNAi) or Post-Transcriptional Gene Silencing (PTGS) is an important biological process for modulating eukaryotic gene expression.
It is highly conserved process of posttranscriptional gene silencing by which double stranded RNA (dsRNA) causes sequence-specific degradation of mRNA sequences.
dsRNA-induced gene silencing (RNAi) is reported in a wide range of eukaryotes ranging from worms, insects, mammals and plants.
This process mediates resistance to both endogenous parasitic and exogenous pathogenic nucleic acids, and regulates the expression of protein-coding genes.
What are small ncRNAs?
micro RNA (miRNA)
short interfering RNA (siRNA)
Properties of small non-coding RNA:
Involved in silencing mRNA transcripts.
Called “small” because they are usually only about 21-24 nucleotides long.
Synthesized by first cutting up longer precursor sequences (like the 61nt one that Lee discovered).
Silence an mRNA by base pairing with some sequence on the mRNA.
Discovery of siRNA?
The first small RNA:
In 1993 Rosalind Lee (Victor Ambros lab) was studying a non- coding gene in C. elegans, lin-4, that was involved in silencing of another gene, lin-14, at the appropriate time in the
development of the worm C. elegans.
Two small transcripts of lin-4 (22nt and 61nt) were found to be complementary to a sequence in the 3' UTR of lin-14.
Because lin-4 encoded no protein, she deduced that it must be these transcripts that are causing the silencing by RNA-RNA interactions.
Types of RNAi ( non coding RNA)
MiRNA
Length (23-25 nt)
Trans acting
Binds with target MRNA in mismatch
Translation inhibition
Si RNA
Length 21 nt.
Cis acting
Bind with target Mrna in perfect complementary sequence
Piwi-RNA
Length ; 25 to 36 nt.
Expressed in Germ Cells
Regulates trnasposomes activity
MECHANISM OF RNAI:
First the double-stranded RNA teams up with a protein complex named Dicer, which cuts the long RNA into short pieces.
Then another protein complex called RISC (RNA-induced silencing complex) discards one of the two RNA strands.
The RISC-docked, single-stranded RNA then pairs with the homologous mRNA and destroys it.
THE RISC COMPLEX:
RISC is large(>500kD) RNA multi- protein Binding complex which triggers MRNA degradation in response to MRNA
Unwinding of double stranded Si RNA by ATP independent Helicase
Active component of RISC is Ago proteins( ENDONUCLEASE) which cleave target MRNA.
DICER: endonuclease (RNase Family III)
Argonaute: Central Component of the RNA-Induced Silencing Complex (RISC)
One strand of the dsRNA produced by Dicer is retained in the RISC complex in association with Argonaute
ARGONAUTE PROTEIN :
1.PAZ(PIWI/Argonaute/ Zwille)- Recognition of target MRNA
2.PIWI (p-element induced wimpy Testis)- breaks Phosphodiester bond of mRNA.)RNAse H activity.
MiRNA:
The Double-stranded RNAs are naturally produced in eukaryotic cells during development, and they have a key role in regulating gene expression .
This pdf is about the Schizophrenia.
For more details visit on YouTube; @SELF-EXPLANATORY;
https://www.youtube.com/channel/UCAiarMZDNhe1A3Rnpr_WkzA/videos
Thanks...!
3. What is UV-Vis spectroscopy?
• An analytical technique that measures the amount of discrete
wavelengths of UV or visible light that are absorbed by or transmitted
through a sample in comparison to a reference or blank sample.
• This property is influenced by the sample composition, potentially
providing information on what is in the sample and at what
concentration.
• Light has a certain amount of energy which is inversely proportional
to its wavelength. Thus, shorter wavelengths of light carry more
energy and longer wavelengths carry less energy. A specific amount
of energy is needed to promote electrons in a substance to a higher
energy state which we can detect as absorption.
• Therefore, light can be described by its wavelength, which can be
useful in UV-Vis spectroscopy to analyze or identify different
substances by locating the specific wavelengths corresponding to
maximum absorbance
4. UV-Vis spectroscopy analysis, absorption
spectrum and absorbance units
• UV-Vis spectroscopy information may be presented as a
graph of absorbance, optical density or transmittance as a
function of wavelength. However, the information is more
often presented as a graph of absorbance on the vertical y
axis and wavelength on the horizontal x axis.
• Based on the UV-Vis spectrophotometer instrumentation,
the intensity of light can be reasonably expected to be
quantitatively related to the amount of light absorbed by the
sample.
5. • The absorbance (A) is equal to the logarithm of a fraction
involving the intensity of light before passing through the
sample (Io) divided by the intensity of light after passing
through the sample (I). The fraction I divided by Io is also
called transmittance (T), which expresses how much light
has passed through a sample.
• However, Beer–Lambert's law is often applied to obtain the
concentration of the sample (c) after measuring the
absorbance (A) when the molar absorptivity (ε) and the path
length (L) are known. Typically, ε is expressed with units of L
mol-1 cm-1, L has units of cm, and c is expressed with units
of mol L-1. As a consequence, A has no units.
6. Equation 1: A set of equations showing the relationships
between absorbance A, Beer–Lambert's law, the light
intensities measured in the instrument, and transmittance.
• Beer–Lambert's law is especially useful for obtaining the
concentration of a substance if a linear relationship exists using a
measured set of standard solutions containing the same substance.
Equation 1 shows the mathematical relationships between
absorbance, Beer–Lambert's law, the light intensities measured in
the instrument, and transmittance
Relationships between absorbance, Beer–Lambert's law, the light
intensities
7. Beer-Lambert law is a linear relationship between
the absorbance and the concentration, molar
absorption coefficient and optical path length of a
solution:
8.
9.
10. Example absorption spectrum taken from a UV-Vis
spectrophotometer. The sample examined was
expired hemoglobin dissolved in neutral pH
phosphate buffer. Credit: Dr. Justin Tom.
11. How does a UV-Vis spectrophotometer work?
1. When incident light hits an object, it can be absorbed, reflected, or
transmitted.
2. The spectrophotometer measures the intensity of light absorbed
across the UV and Vis ranges.
3. Light transmitted through the sample is measured and compared
to a reference measurement of the incident light source.
4. By applying the Beer-Lambert Law, which states that the amount
of light absorbed is directly proportional to the concentration of
the sample and the path length, the spectrophotometer can
determine the concentration of specific analytes in the sample.
12. What is a UV-Vis spectrophotometer and how
does it work?
From the spectrum obtained, it is possible to determine the
chemical or physical properties of the sample. In general, it is
possible to:
• Identify molecules in a solid or liquid sample
• Determine the concentration of a particular molecule in
solution
• Characterize the absorbance or transmittance through a
liquid or solid—over a range of wavelengths
• Characterize the reflectance properties of a surface or
measure the color of a material
• Study chemical reactions or biological processes
13. Instrumentation of a UV-Visible
Spectrophotometer
Ultraviolet-visible (UV-Vis) spectrophotometers
use a light source to illuminate a sample with
light across the UV to the visible wavelength
range (typically 190 to 900 nm)
14. Figure 1; simplified schematic of the main
components in a UV-Vis spectrophotometer.
Credit: Dr. Justin Tom.
17. What are the main components of a
UV-Vis spectrophotometer?
The key components of a UV-Vis spectrophotometer are:
1.A light source that generates a broadband of electromagnetic
radiation across the UV-visible spectrum
2.A dispersion device that separates the broadband radiation into
wavelengths
3.A sample area, where the light passes through or reflects off a
sample
4.One or more detectors to measure the intensity of the reflected or
transmitted radiation
18. Basic Components of a UV-Vis
Spectrophotometer
UV-Vis spectrophotometer consists of several key components that work
together to enable accurate and precise measurements:
• Entrance Slit: This controls the width and alignment of the incident light
beam, ensuring the sample is illuminated consistently.
• Collimating Mirror: The collimating mirror focuses the light beam, making
it parallel before it enters the monochromator.
• Monochromator: The monochromator separates the different
wavelengths of light, allowing only a narrow band of wavelengths to pass
through to the sample.
• Sample Holder: The sample holder, typically a cuvette or parallel sample
pedestal for microvolume instruments, holds the sample solution in place,
enabling the light to pass uniformly through the sample.
• Detector: The detector measures the intensity of light reaching it after
passing through the sample. Common detectors used in UV-Vis
spectrophotometers include photomultiplier tubes and CCD detectors.
19. Light Sources for a UV-Visible
Spectrophotometer
•When selecting and evaluating an instrument, the
type of light source used will have an effect on UV-
Visible/NIR measurements.
•A few things to consider are:
(1) the operational wavelength range required for
the application or where the sample’s chromophore
absorbs,
(2) the required light throughput,
(3) the stability of the source, and
(4) the cost and lifetime of the source.
20.
21. Light source
• As a light-based technique, a steady source able to emit light
across a wide range of wavelengths is essential. A single
xenon lamp is commonly used as a high intensity light source
for both UV and visible ranges. Xenon lamps are, however,
associated with higher costs and are less stable in
comparison to tungsten and halogen lamps.
• For instruments employing two lamps, a tungsten or halogen
lamp is commonly used for visible light,2 whilst a deuterium
lamp is the common source of UV light.
• Deuterium lamp is used for the UV region from 190 to 350
nm while the halogen lamp covers a much broader spectral
range from 330 and 3200 nm.
22. Grating - Monochromators
• All the light sources produce a broad-spectrum white light. To
narrow the light down to a selected wavelength band, the light
is passed through a monochromator, which consists of:
1. An entrance slit
2. A dispersion device, to spread the light into different
wavelengths (like a rainbow) and allow the selection of a
nominated band of wavelengths
3. An exit slit where the light of the nominated wavelengths
passes through and onto the sample
• A single monochromator spectrophotometer is used for
general-purpose spectroscopy and can be integrated into a
compact optical system. A double monochromator is typically
found in high-performance instruments.
23. Sample compartments
• Typically a black-colored box with a closing lid. The matt
black inside the compartment helps to absorb stray light that
may enter the compartment.
• In the sample compartment, the sample is positioned to
allow the beam from the monochromator to pass through
the sample. Glass, plastic, or quartz cuvettes are used for
liquid samples.
• Solid samples are held in position by a holder attached to
the floor of the sample compartment. The light can also be
taken out of the sample compartment using fiber optics.
24. Sample container/cells or cuvettes
• Sample containers or cuvettes may be made up of :
1. Quartz
2. Borosilicate
3. Plastic
Only quartz is transparent in both UV & visible regions (200-700nm
range). Glass can act as a filter, often absorbing the majority of UVC
(100-280 nm) and UVB (280-315 nm) but allowing some UVA
(315-400 nm) to pass through.
Glass & plastic are suitable for the visible region only.
Glass is not suitable for the UV region because it absorbs UV
radiation i.e. it is not transparent in the UV region.
Plastic cells are not used for organic solvents. Majority of plastic
cuvettes are inappropriate for UV absorption studies because plastic
generally absorbs UV light.
25. Cuvette size
The most common cuvette size is 1 cm, although it can vary
from 0.1-10 cm.
26. Detectors
• A detector converts the light from the sample into an electrical signal. Like
the light source, it should give a linear response over a wide wavelength
range, with low noise and high sensitivity.
• Generally, detectors are based on photoelectric coating such as
sphotomultiplier tube (PMT) or semiconductors. Photodiodes and
charge-coupled devices (CCDs) are two of the most common detectors
based on semiconductor technology.
• Each detector has a different sensitivity and wavelength range. For systems
with multiple detectors, the system will switch to the detector
corresponding to the required wavelength range for the measurement. UV-
Vis spectrophotometer detectors include photomultiplier tubes (PMT) and
silicon diodes (Si). Indium gallium arsenide (InGaAs) photodiodes and lead
sulfide (PbS) detectors are found on high-performance UV-Vis-NIR systems
to improve wavelength coverage or sensitivity.
30. Charge Coupled Device (CCD)
Charge-coupled devices (CCDs) are
silicon-based integrated circuits consisting
of a dense matrix of photodiodes that
operate by converting light energy in the
form of photons into an electronic charge.
Electrons generated by the interaction of
photons with silicon atoms are stored in a
potential well and can subsequently be
transferred across the chip through
registers and output to an amplifier.
31. UV-Visible Spectrophotometer Detectors
PMT detectors are especially useful for detecting very low levels of light.
While silicon photodiodes are less sensitive than PMT detectors in the UV and visible
regions, they are a cheaper alternative for applications not requiring high sensitivity.
33. Applications of UV-Vis Spectrophotometry
1. Chemical Analysis
• UV-Vis spectrophotometry is widely used in teaching and industrial materials
science labs to quantify biomolecules, organic compounds, and inorganic
metals. It is a favored method due to its ease and speed of use.
2. Microvolume Analysis
• With advancements in technology, modern UV-Vis spectrophotometers are
capable of analyzing microvolume samples as small as 0.5 microliters,
making them suitable for limited sample volumes.
3. Nucleic Acid and Protein Analysis
• The concentration of nucleic acids and proteins can be accurately
determined using UV-Vis spectrophotometry, enabling essential applications
in genetics, molecular biology, and biochemistry. Many instruments come
with preconfigured or defined dyes and protein types for ease of use.
34. Applications of UV-Vis Spectrophotometry…
4. Pharmaceutical Research
• In the pharmaceutical industry, UV-Vis spectrophotometry plays a
crucial role in identifying and quantifying compounds in
pharmaceutical products, ensuring their quality and efficacy.
5. Purity Testing
• UV-Vis spectrophotometry is employed to assess the purity of DNA
samples, ensuring their suitability for various downstream
applications such as PCR and DNA sequencing.
6. Quality Control and Analysis
• The technique is widely used in industries such as pharmaceuticals,
food, and cosmetics to ensure the quality and consistency of
materials and products.
36. UV-Vis spectrophotometry offers several
advantages
Easy-to-Use Nature;
• The technique is relatively straightforward, and modern
spectrophotometers often come with user-friendly software
interfaces, making them accessible even to non-experts.
Non-destructive;
• UV-Vis allows for non-destructive analysis and can be applied to a
wide range of chemical species. This allows samples to be studied
repeatedly as they will not be damaged, a benefit highly important
for quality assurance and quality control purposes.
Quick Analysis;
• UV-Vis spectrophotometers provide fast and efficient analysis,
allowing researchers to obtain results within a few seconds. It is used
to quantify nucleic acid and protein content in biological samples and
for quality control in drugs and food industries.
37. Strengths and limitations of UV-Vis
spectroscopy
1. The technique is non-destructive, allowing the sample to be
reused or proceed to further processing or analyses.
2. Measurements can be made quickly, allowing easy integration into
experimental protocols.
3. Instruments are easy to use, requiring little user training prior to
use.
4. Data analysis generally requires minimal processing, again
meaning little user training is required.
5. The instrument is generally inexpensive to acquire and operate,
making it accessible for many laboratories.
38. Disadvantages/limitation UV-Vis spectroscopy
1. Stray light - In a real instrument, wavelength selectors are not
perfect and a small amount of light from a wide wavelength range may
still be transmitted from the light source,1 possibly causing serious
measurement errors.9 Stray light may also come from the environment
or a loosely fitted compartment in the instrument.1
2. Light scattering - Light scattering is often caused by suspended
solids in liquid samples, which may cause serious measurement errors.
The presence of bubbles in the cuvette or sample will scatter light,
resulting in irreproducible results.
39. Disadvantages/limitation UV-Vis
spectroscopy…
3. Interference from multiple absorbing species - A sample may, for
example, have multiple types of the green pigment chlorophyll. The
different chlorophylls will have overlapping spectra when examined
together in the same sample. For a proper quantitative analysis, each
chemical species should be separated from the sample and examined
individually.
4. Geometrical considerations - Misaligned positioning of any one of
the instrument's components, especially the cuvette holding the
sample, may yield irreproducible and inaccurate results. Therefore, it is
important that every component in the instrument is aligned in the
same orientation and is placed in the same position for every
measurement. Some basic user training is therefore generally
recommended to avoid misuse.
40.
41. References
• UV-Vis Spectroscopy: Principle, Strengths and Limitations and
Applications
• https://www.technologynetworks.com/analysis/articles/uv-vis-
spectroscopy-principle-strengths-and-limitations-and-applications-
349865
• What is a UV-Vis Spectrophotometer?
• https://www.denovix.com/blog/what-is-a-uv-vis-spectrophotometer/
• UV-Vis Spectroscopy & Spectrophotometer FAQs
• https://www.agilent.com/en/support/molecular-spectroscopy/uv-
vis-uv-vis-nir-spectroscopy/uv-vis-spectroscopy-spectrophotometer-
basics