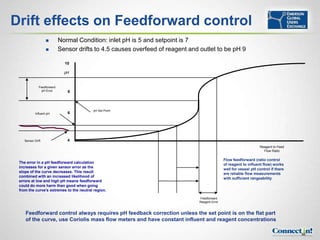
Downloaded 354 times


![The definition of pH
pH is the unit of measurement for determining
the acidity or alkalinity of a solution.
The mathematical definition of pH is the
negative logarithm of the molar hydrogen ion
concentration, pH = - log([H+])
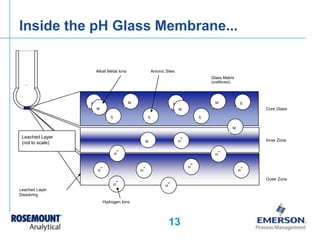
pH is measured by various different sensors, H2O
most common and economical is the glass H+ OH-
OH- H+
electrode/silver reference system.
pH measurement requires periodic
maintenance to maintain accuracy.](https://image.slidesharecdn.com/adventures-in-ph-control-greg-mcmillan-dave-joseph-121017142825-phpapp01/85/Adventures-in-pH-Control-7-320.jpg)
![pH Scale vs Moles/Liter Ion
Concentration
pH Hydrogen Ion [H+] Hydroxyl Ion [OH-]
0 Acidic 1.0 0.00000000000001
1 0.1 0.0000000000001
2 0.01 0.000000000001
3 0.001 0.00000000001
4 0.0001 0.0000000001
5 0.00001 0.000000001
6 0.000001 0.00000001
7 Neutral 0.0000001 0.0000001
8 0.00000001 0.000001
9 0.000000001 0.00001
10 0.0000000001 0.0001
11 0.00000000001 0.001
12 0.000000000001 0.01
13 0.0000000000001 0.1
14 Basic 0.00000000000001 1.0](https://image.slidesharecdn.com/adventures-in-ph-control-greg-mcmillan-dave-joseph-121017142825-phpapp01/85/Adventures-in-pH-Control-8-320.jpg)

![What is pH? – technical stuff
pH = - log([H+])
Kw = [H+]*[OH-] = 1.0x10⁻¹⁴ at 25ºC
pH + pOH = pKw
pH is measured using the Nernst equation
E(mV) = Ex + 2.3(RT/F)*log aH+
~ Ex – (S)*pH in simple form
Where Ex = calibration constant
2.3(RT/F) ~ slope (S) in mV/pH units
aH+ = activity of hydrogen ion ~ [H+]](https://image.slidesharecdn.com/adventures-in-ph-control-greg-mcmillan-dave-joseph-121017142825-phpapp01/85/Adventures-in-pH-Control-10-320.jpg)


![Rules of thumb: multiple stages
When the process pH must
be changed by more than 2 pH Hydrogen Ion [H+] Hydroxyl Ion [OH-]
units: 0 Acidic 1.0 0.00000000000001
1 0.1 0.0000000000001
2 0.01 0.000000000001
Use Multiple Stages! 3
4
0.001
0.0001
0.00000000001
0.0000000001
5 0.00001 0.000000001
6 0.000001 0.00000001
Remember that 2 pH units 7 Neutral 0.0000001 0.0000001
8 0.00000001 0.000001
is a factor of 100 in 9 0.000000001 0.00001
concentration. 10 0.0000000001 0.0001
11 0.00000000001 0.001
12 0.000000000001 0.01
13 0.0000000000001 0.1
Can you accurately dilute a 14 Basic 0.00000000000001 1.0
concentrated acid by a factor of
500 in one step?](https://image.slidesharecdn.com/adventures-in-ph-control-greg-mcmillan-dave-joseph-121017142825-phpapp01/85/Adventures-in-pH-Control-71-320.jpg)


The document discusses pH control and measurement. It provides an overview of pH concepts including: - The definition of pH and how it relates to hydrogen and hydroxyl ion concentrations - Details of how a pH sensor works including the glass electrode, reference electrode, and liquid junction - Benefits of smart pH sensors which store calibration data to enable sensor diagnostics and trending - Examples of sensor diagnostics provided by smart sensors such as detecting broken glass, coated sensors, and non-immersed sensors - How sensor parameters change over time and smart sensor trending can identify sensors needing replacement before measurements are compromised