Downloaded 503 times


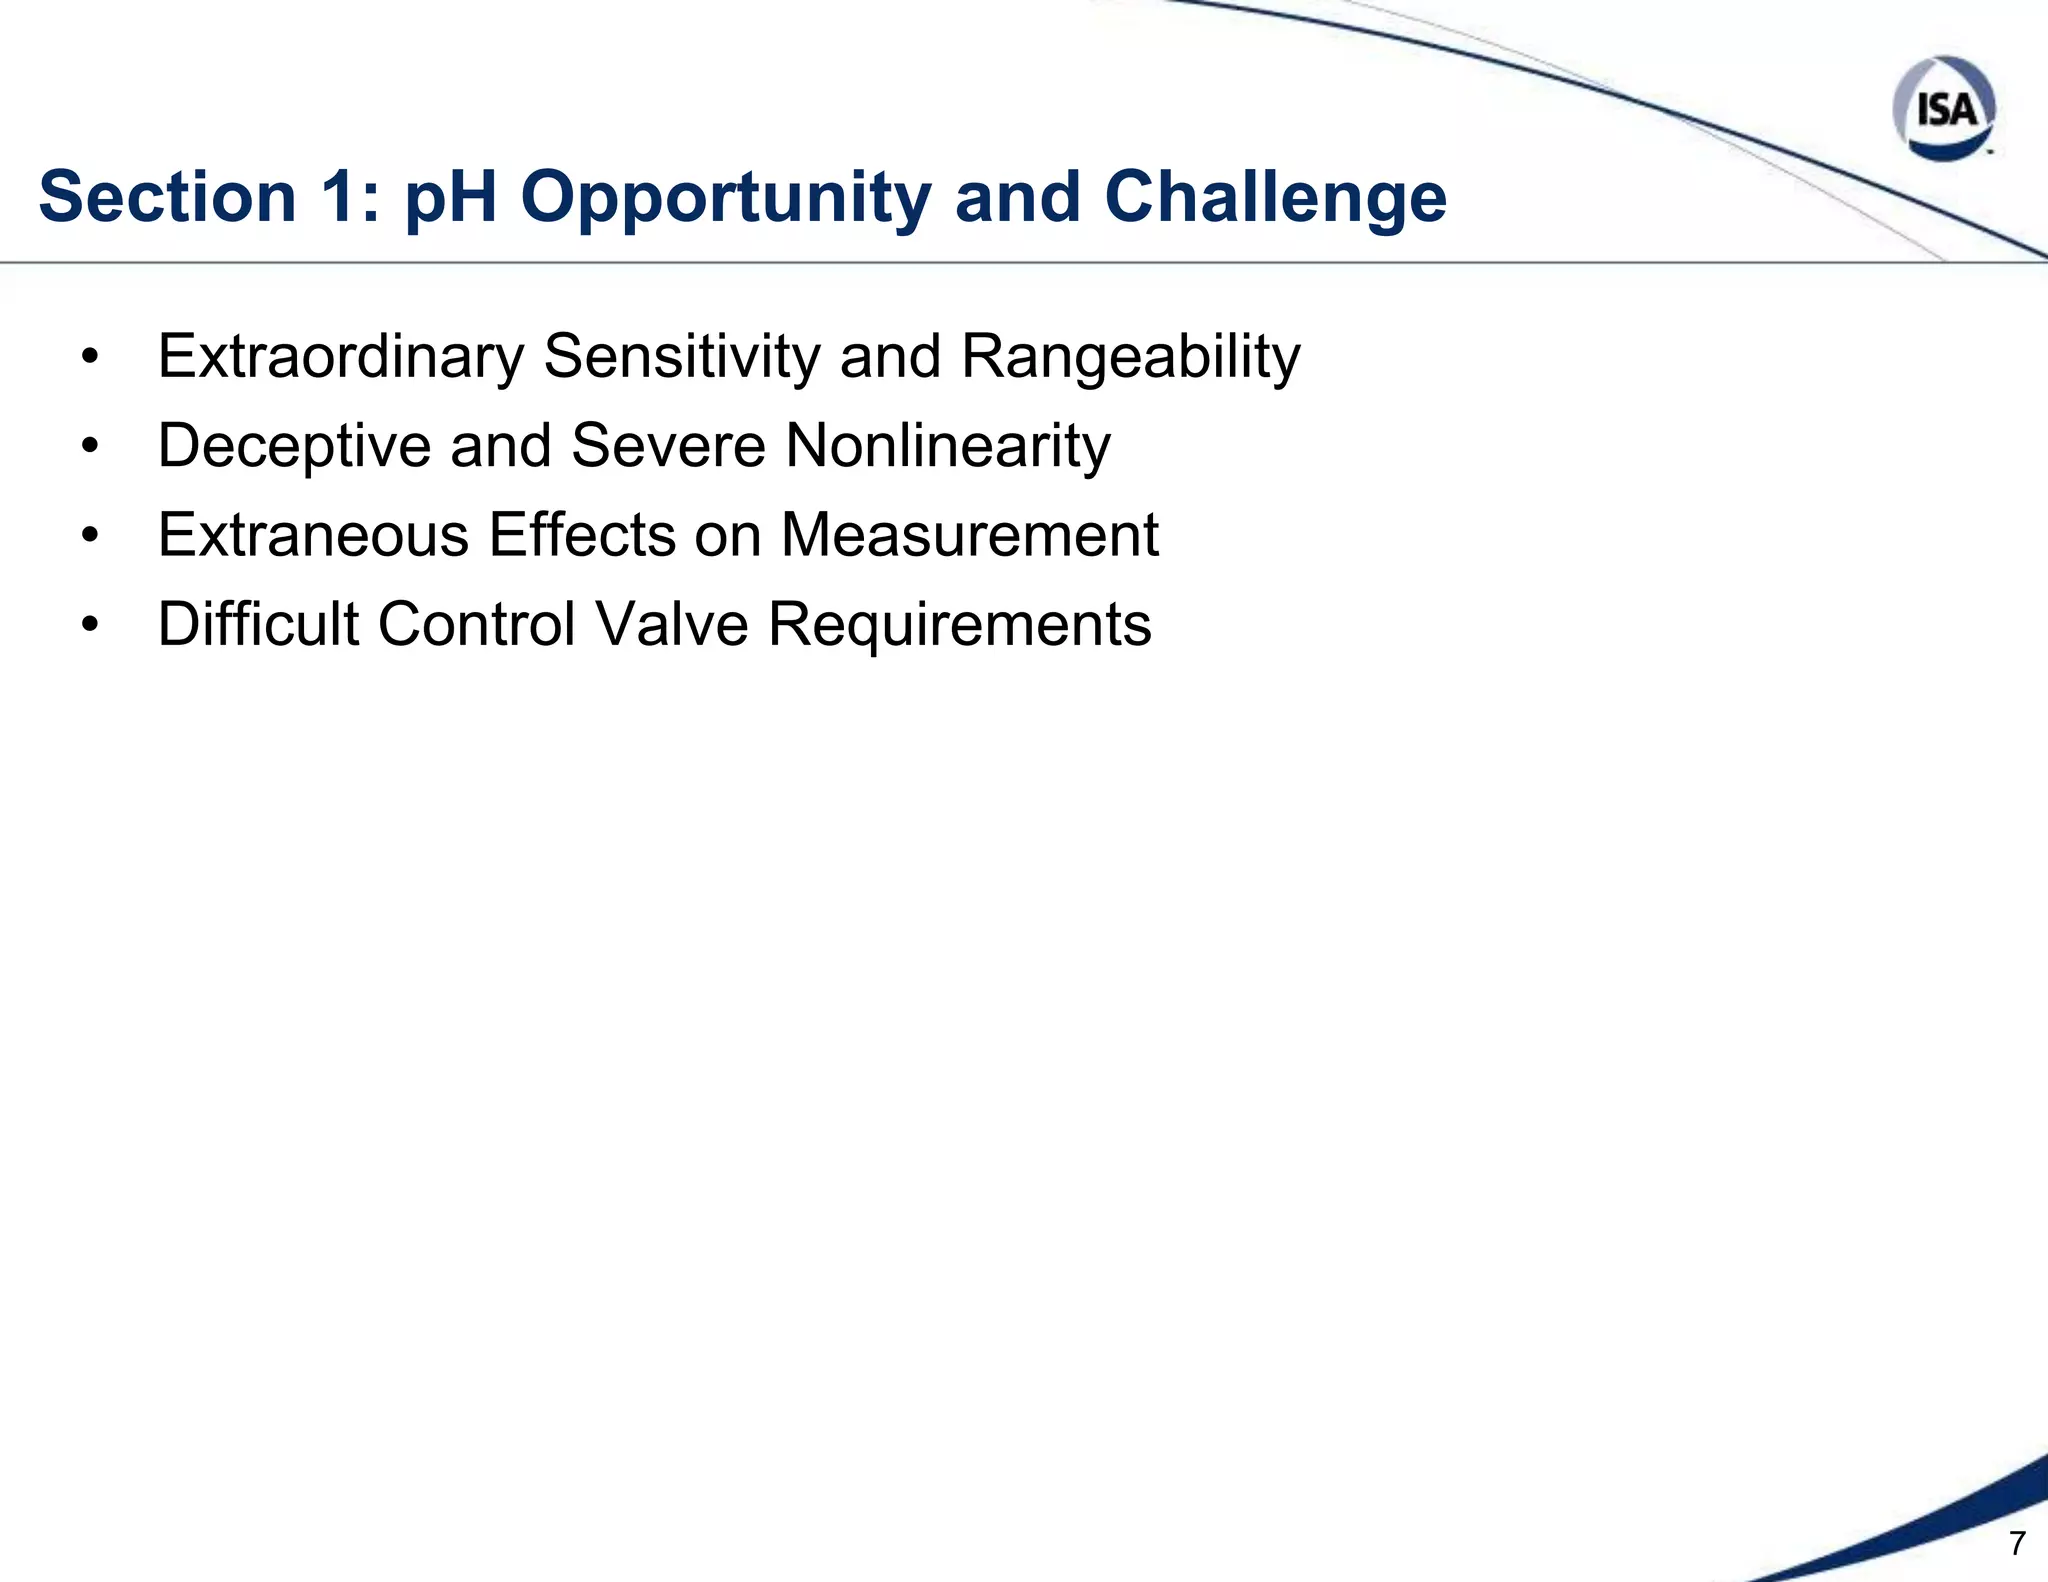

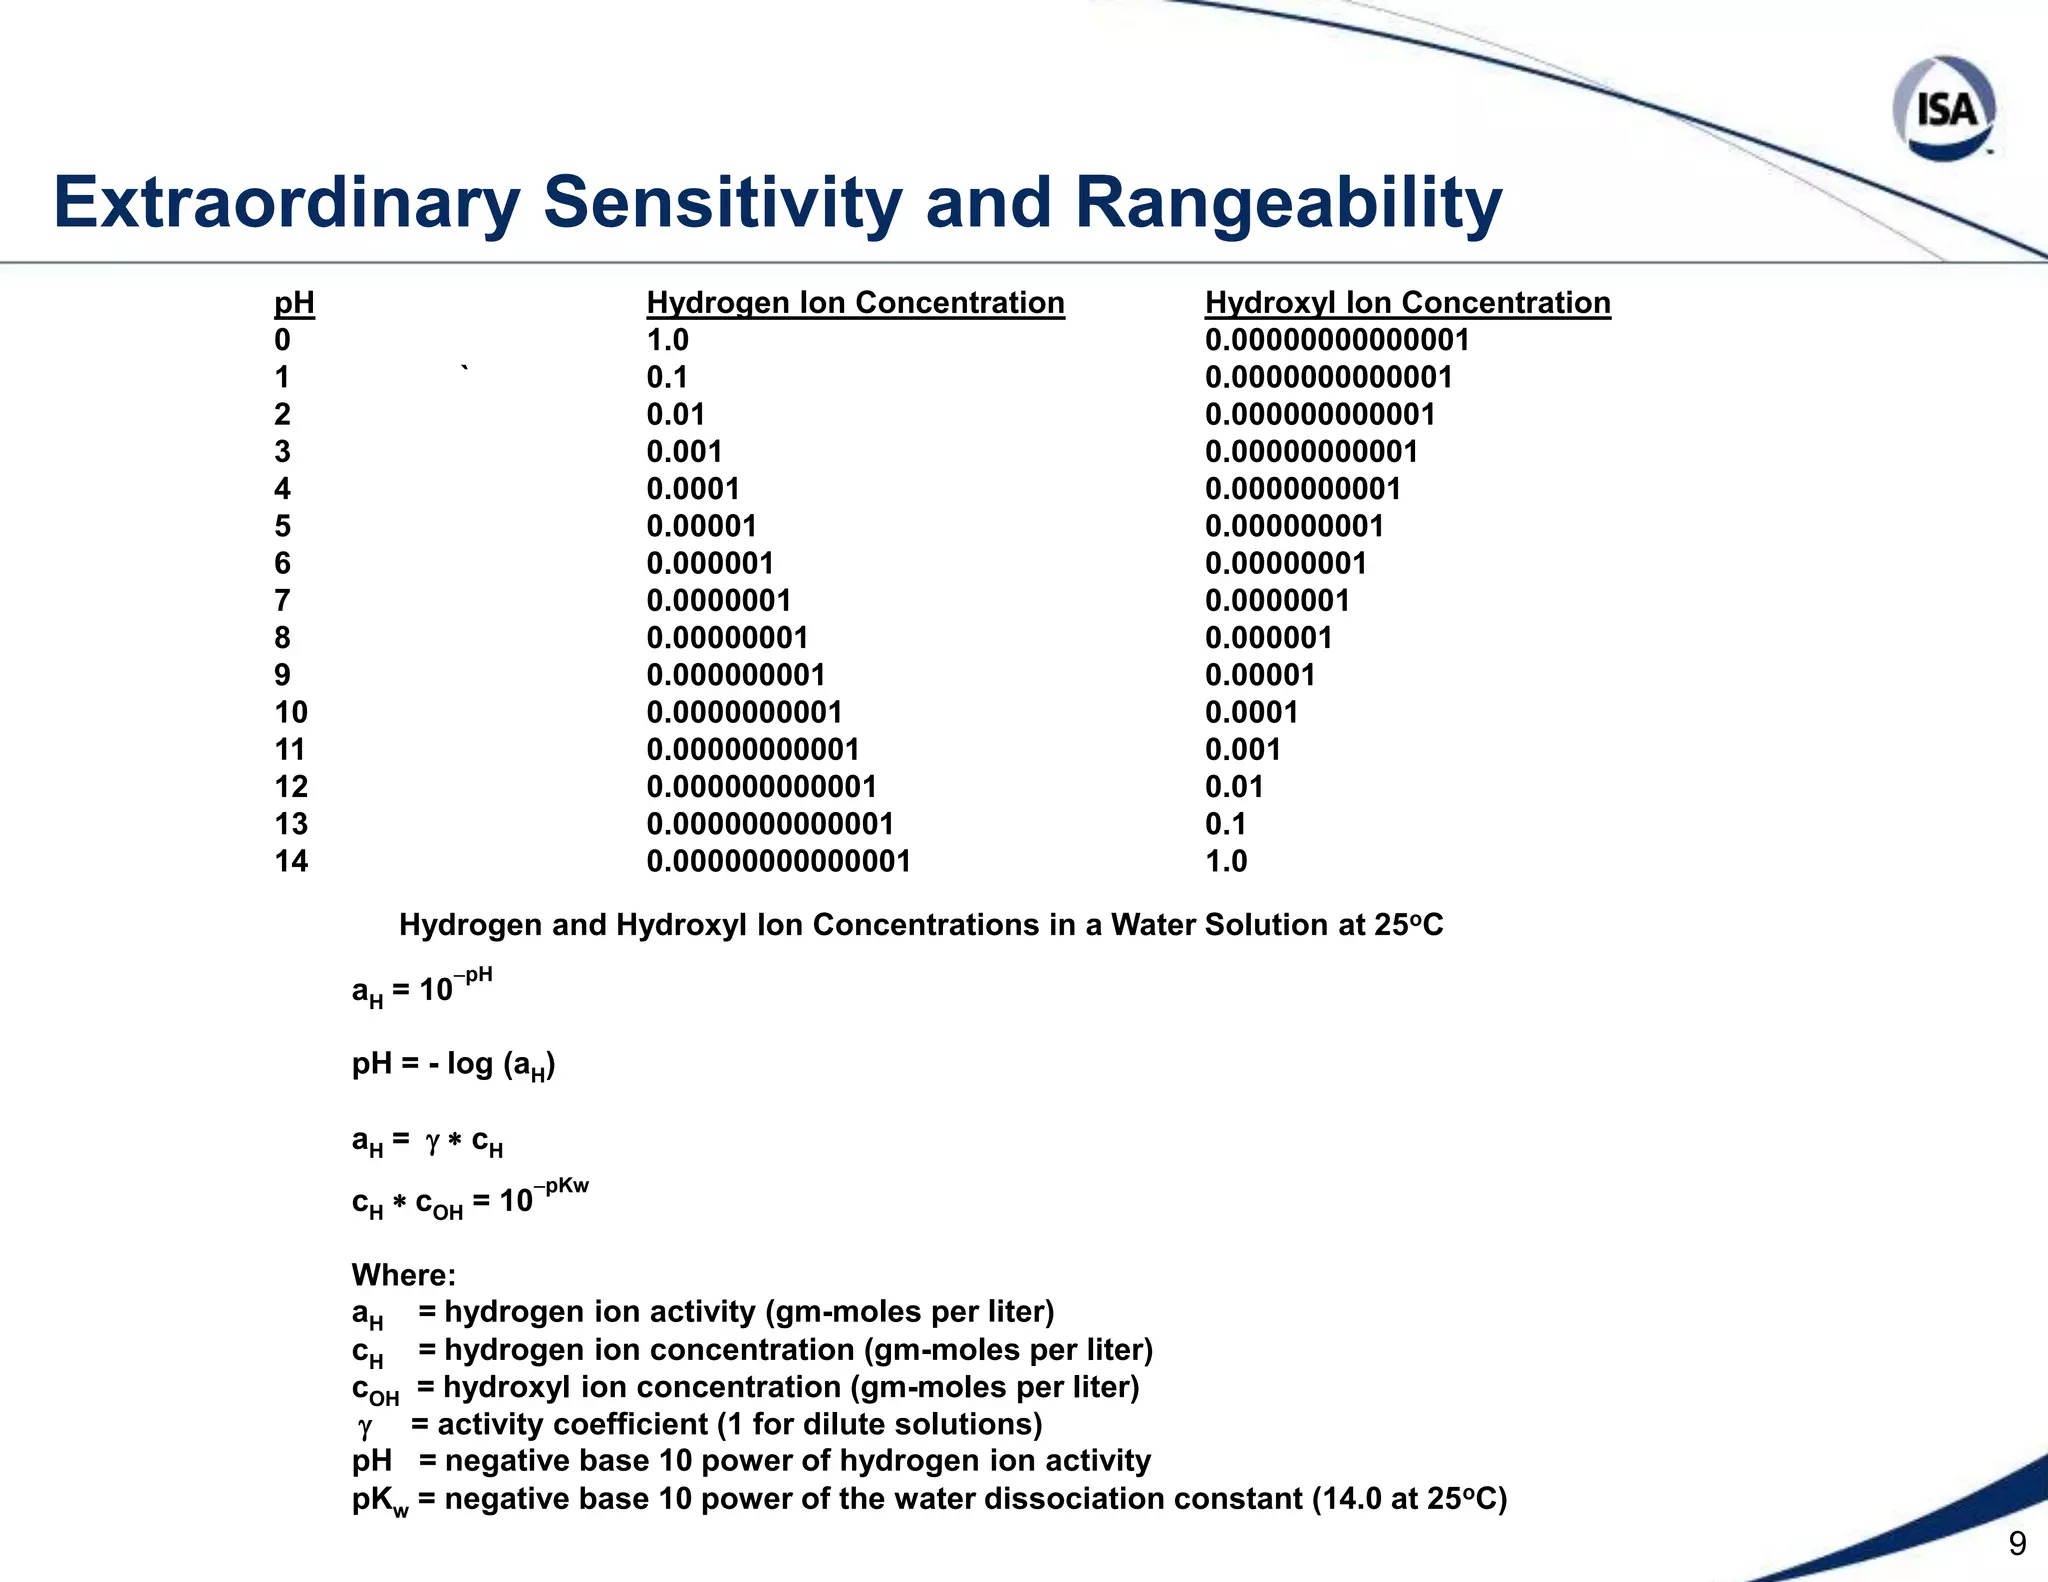
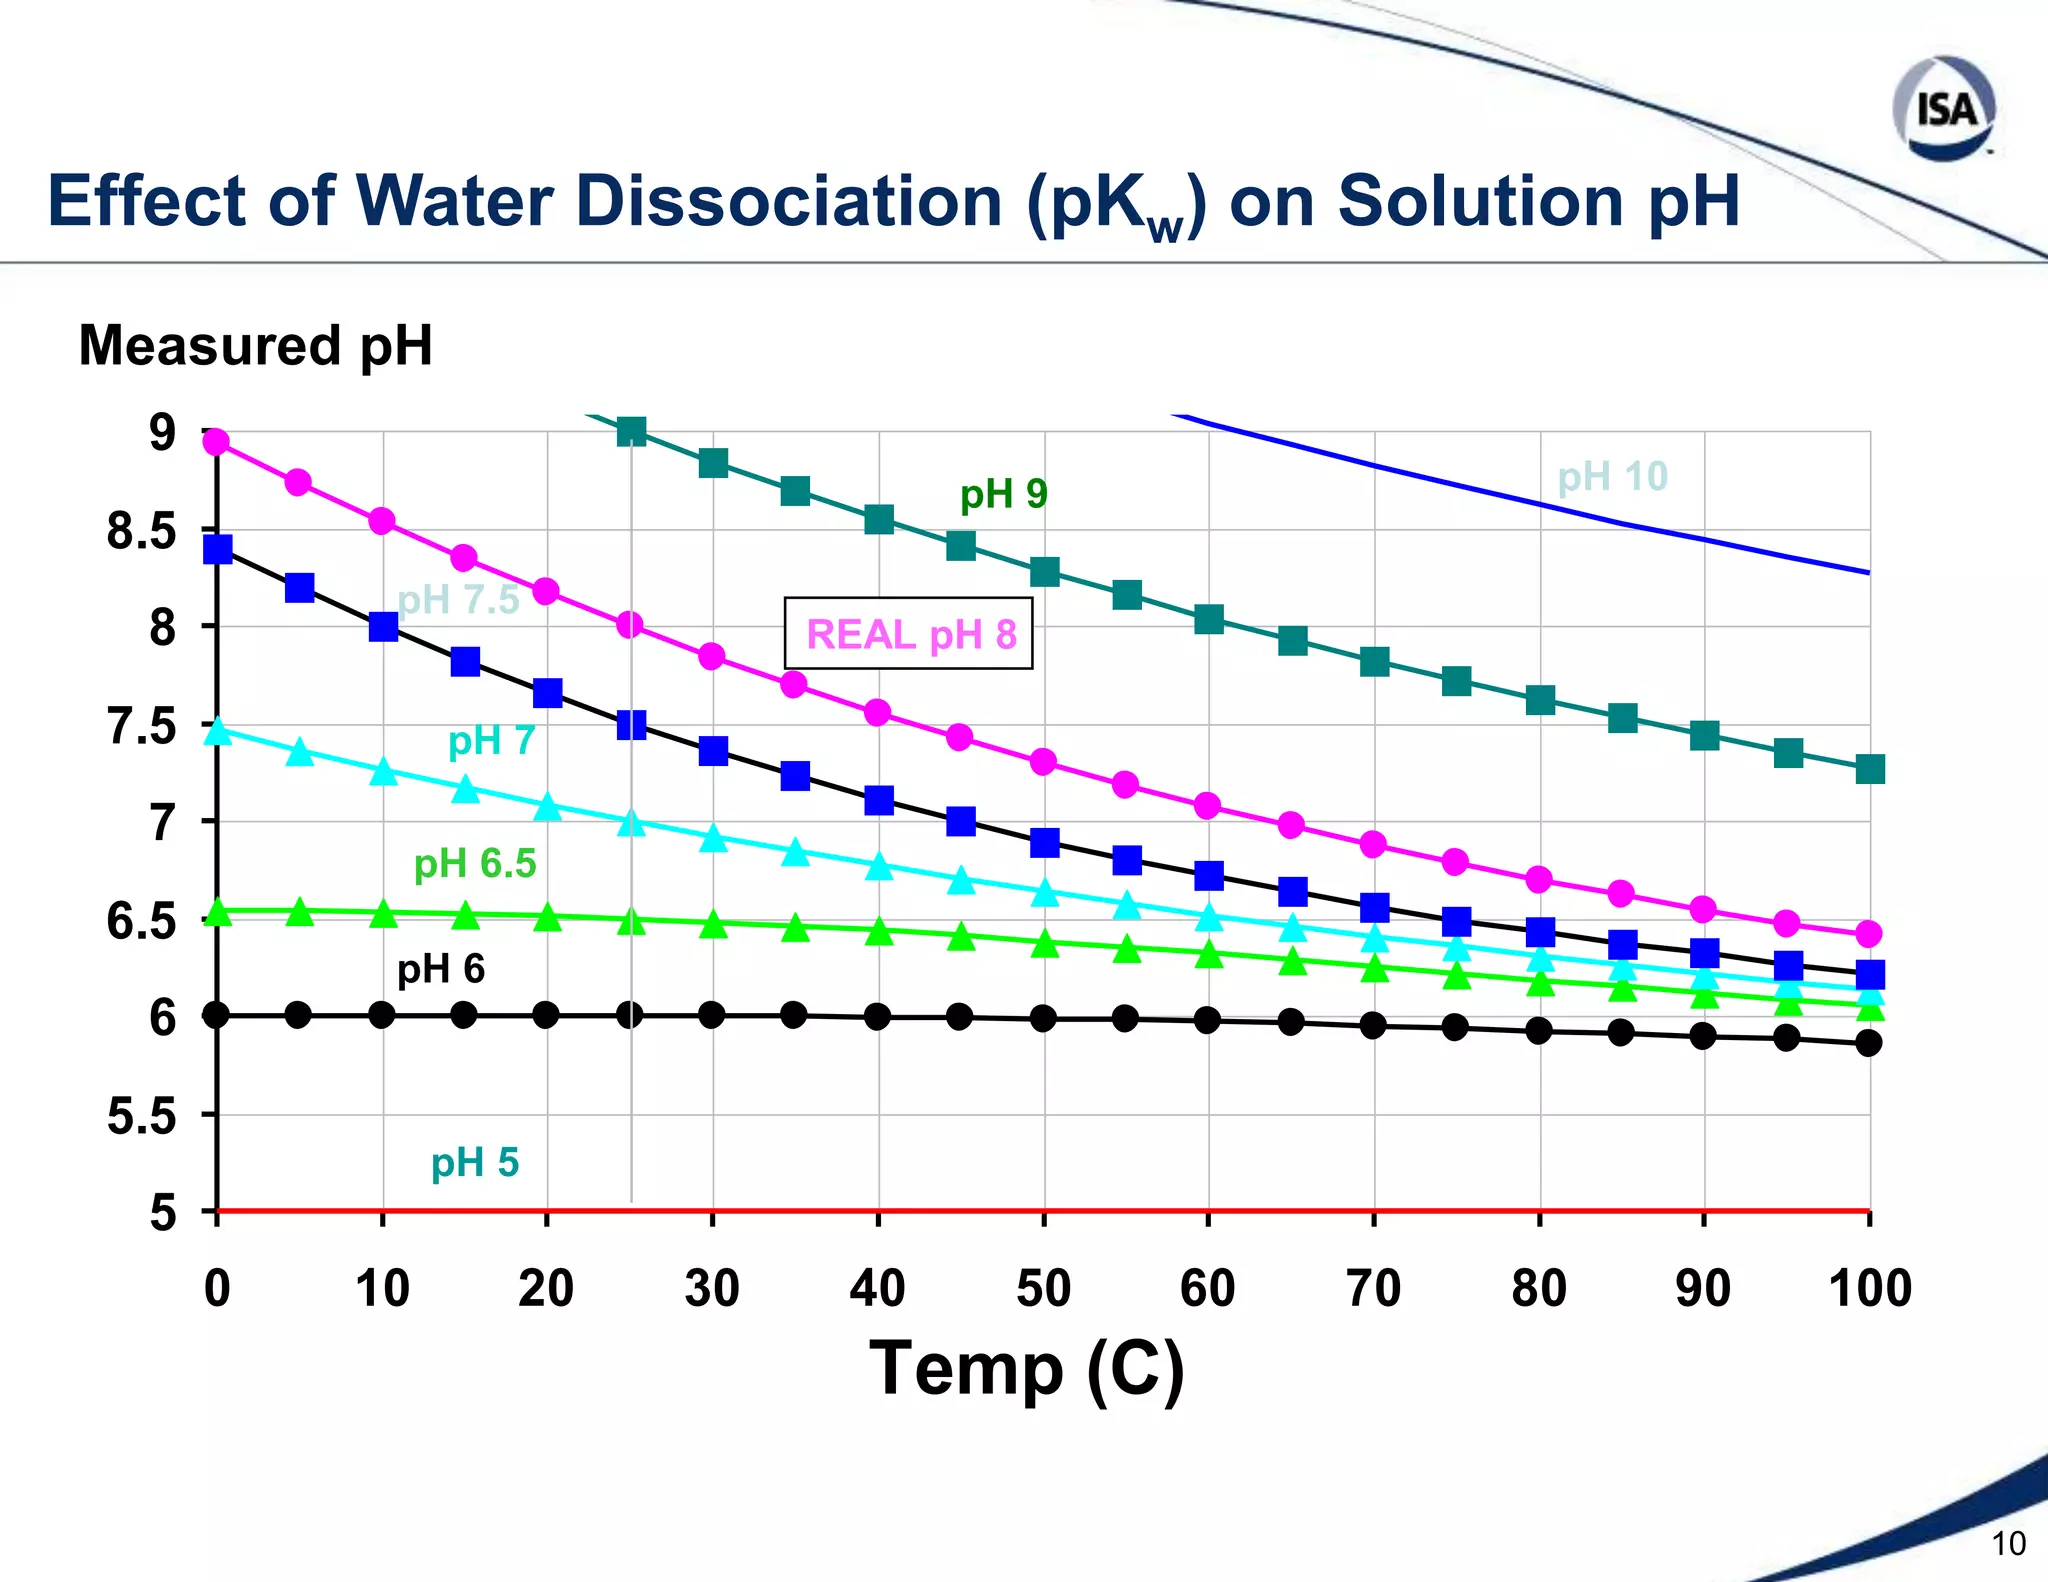
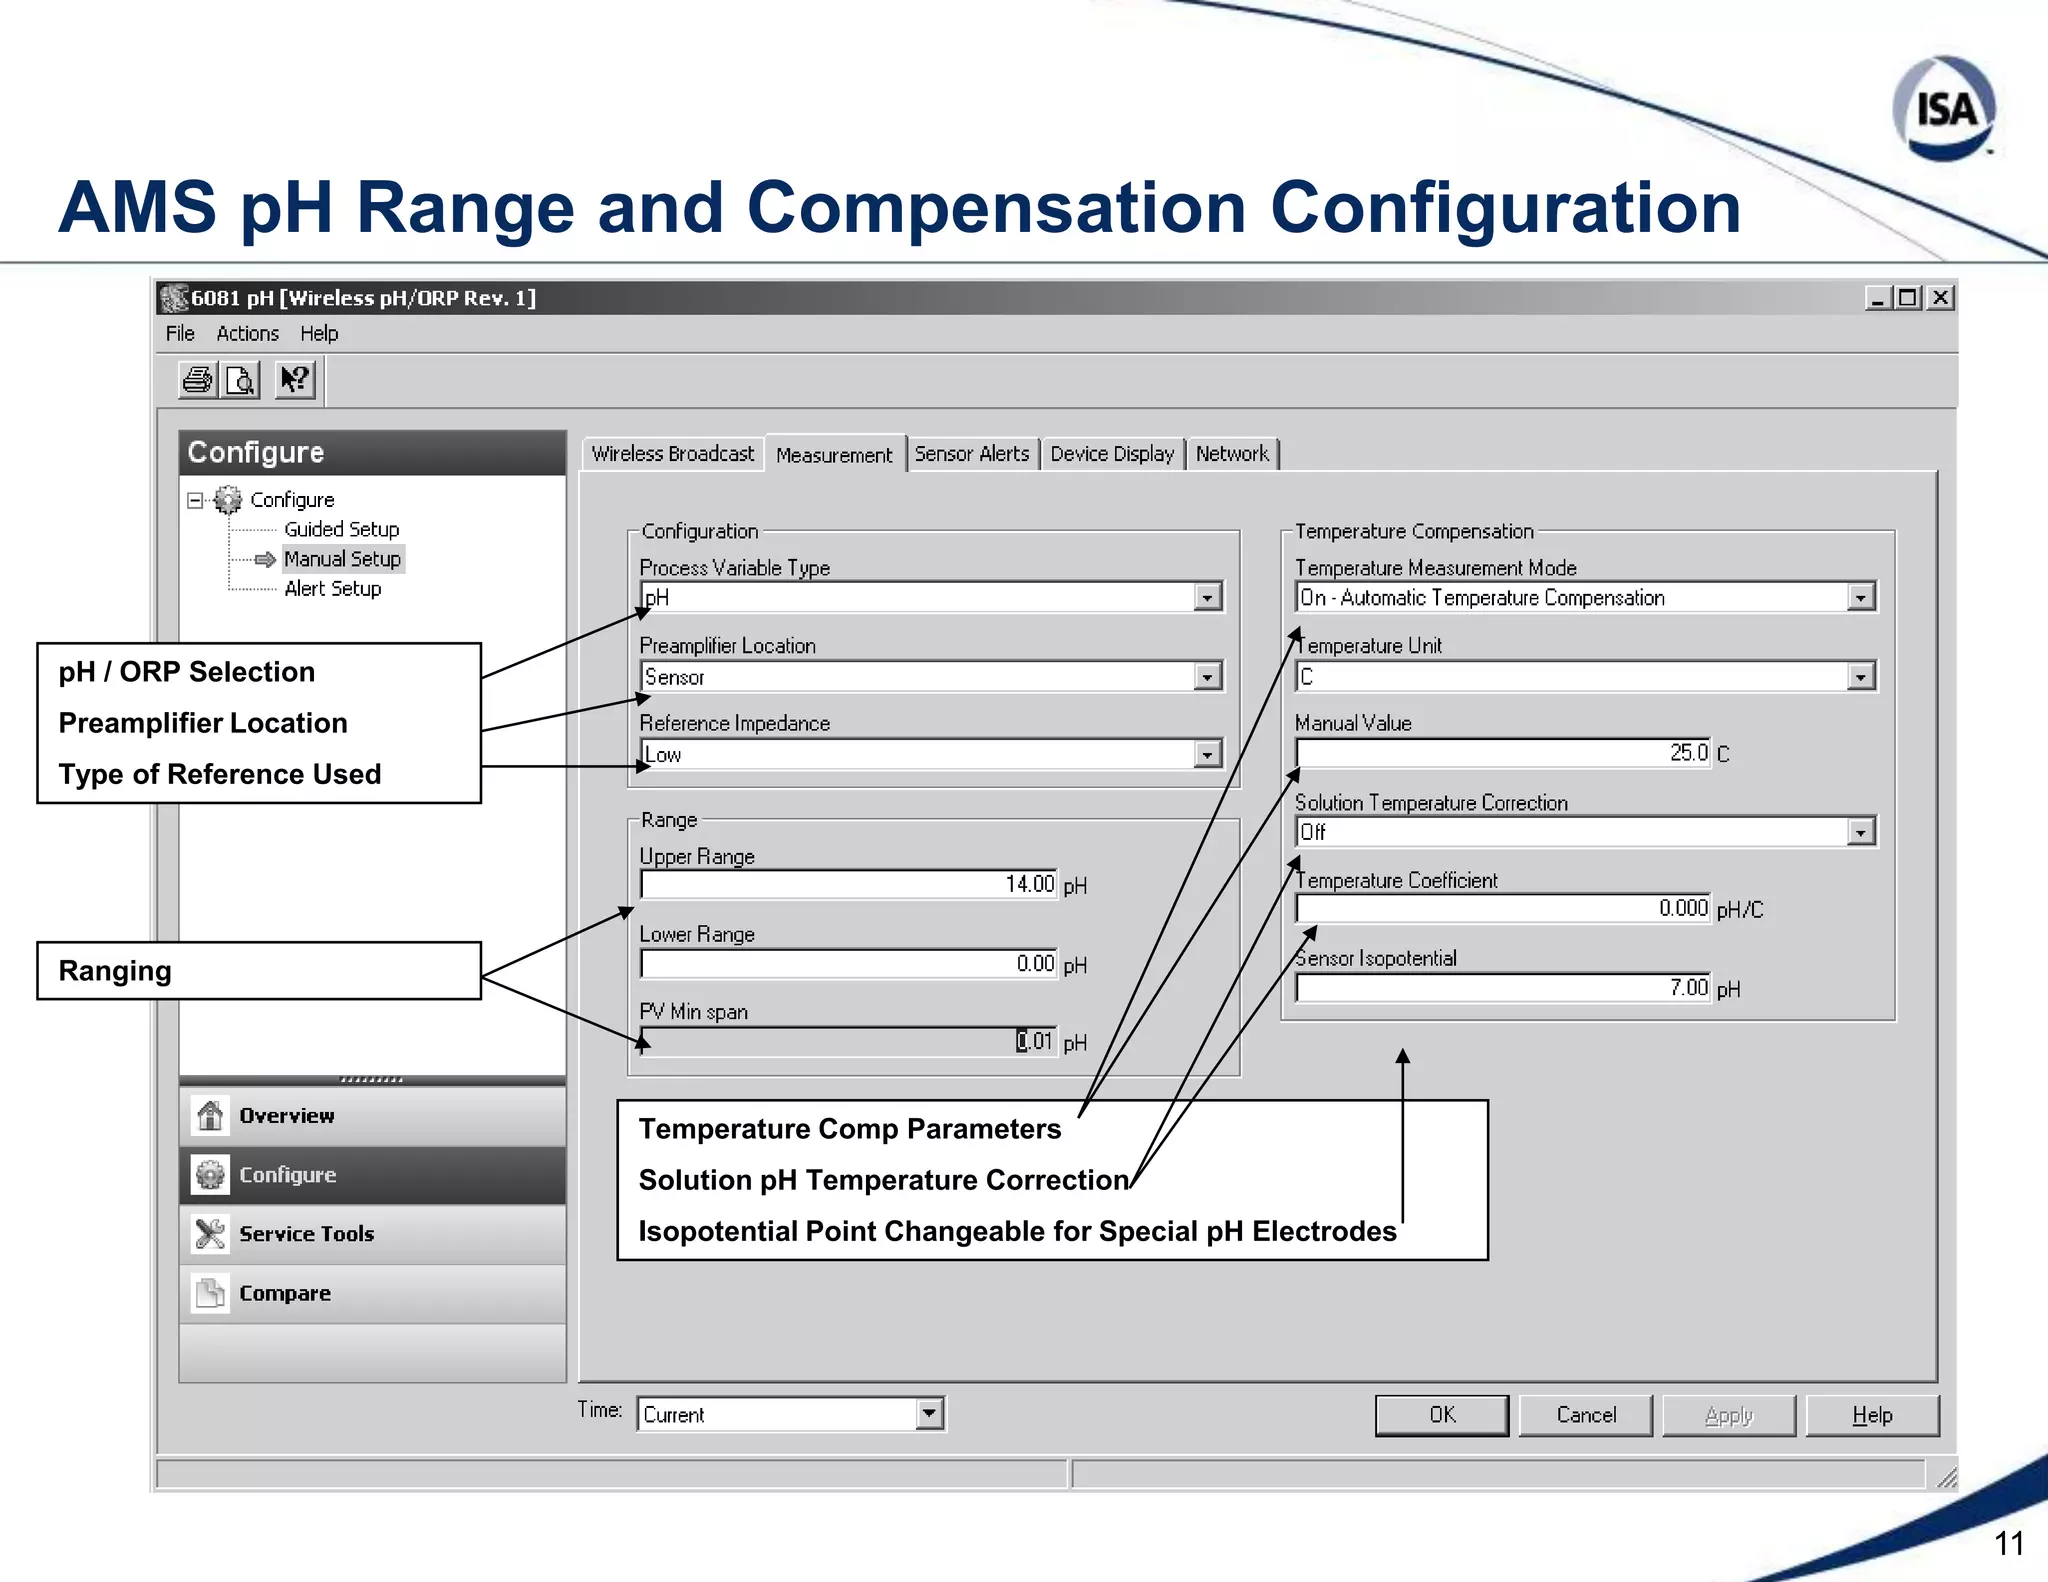
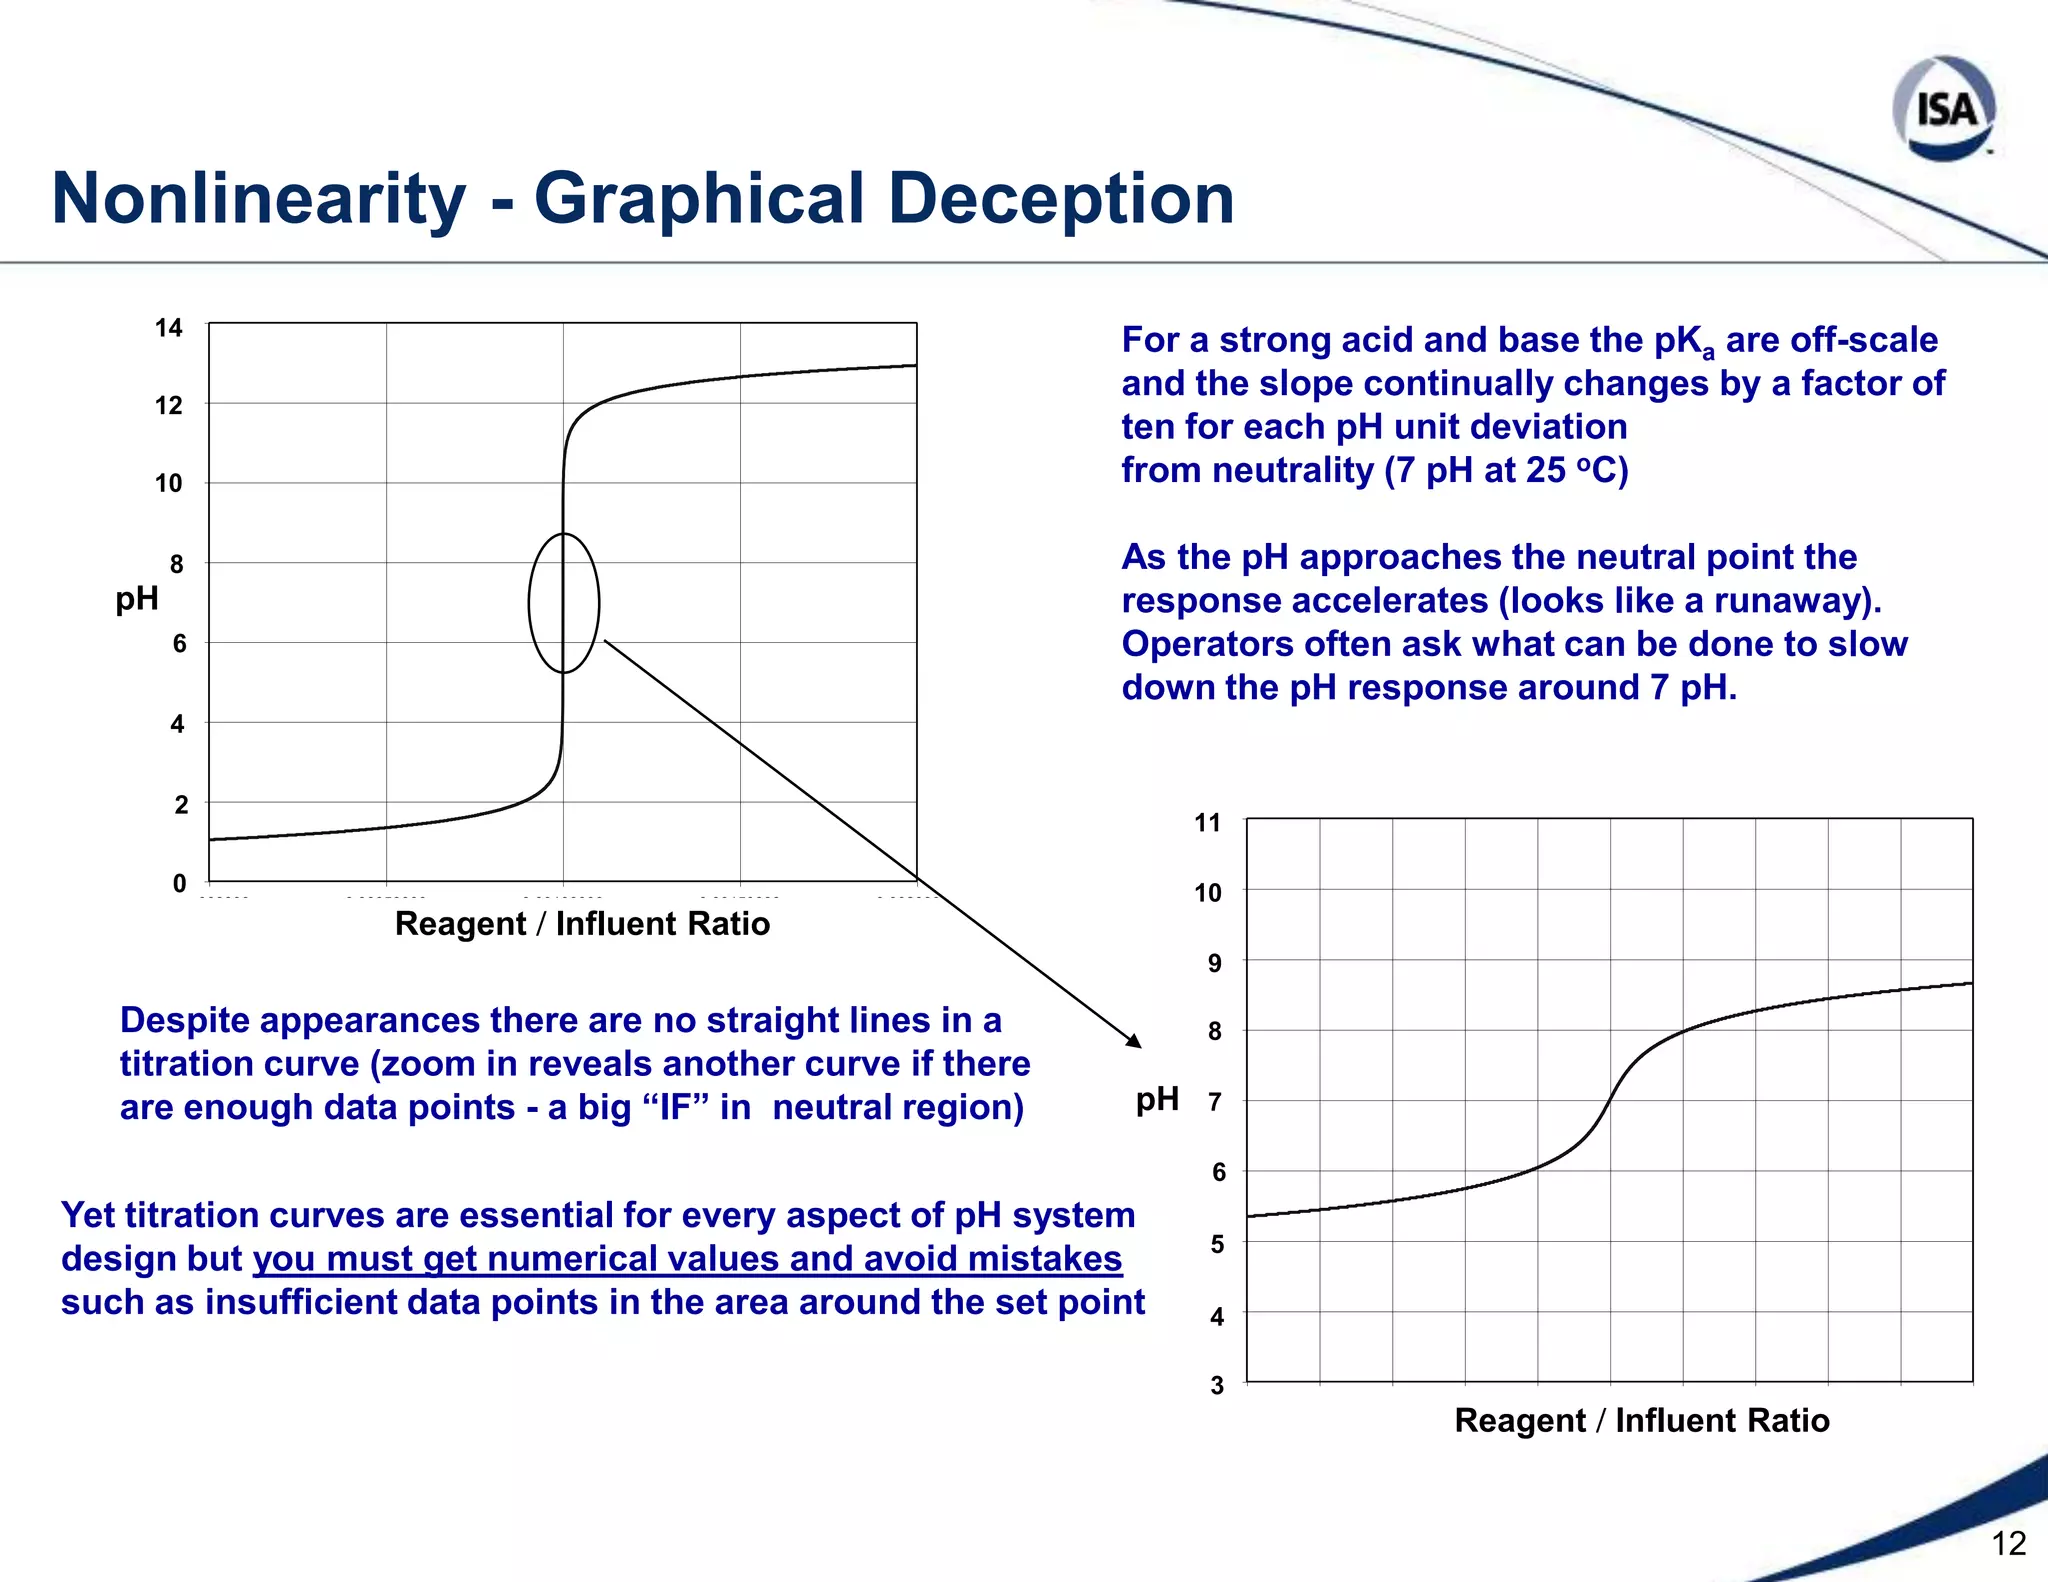
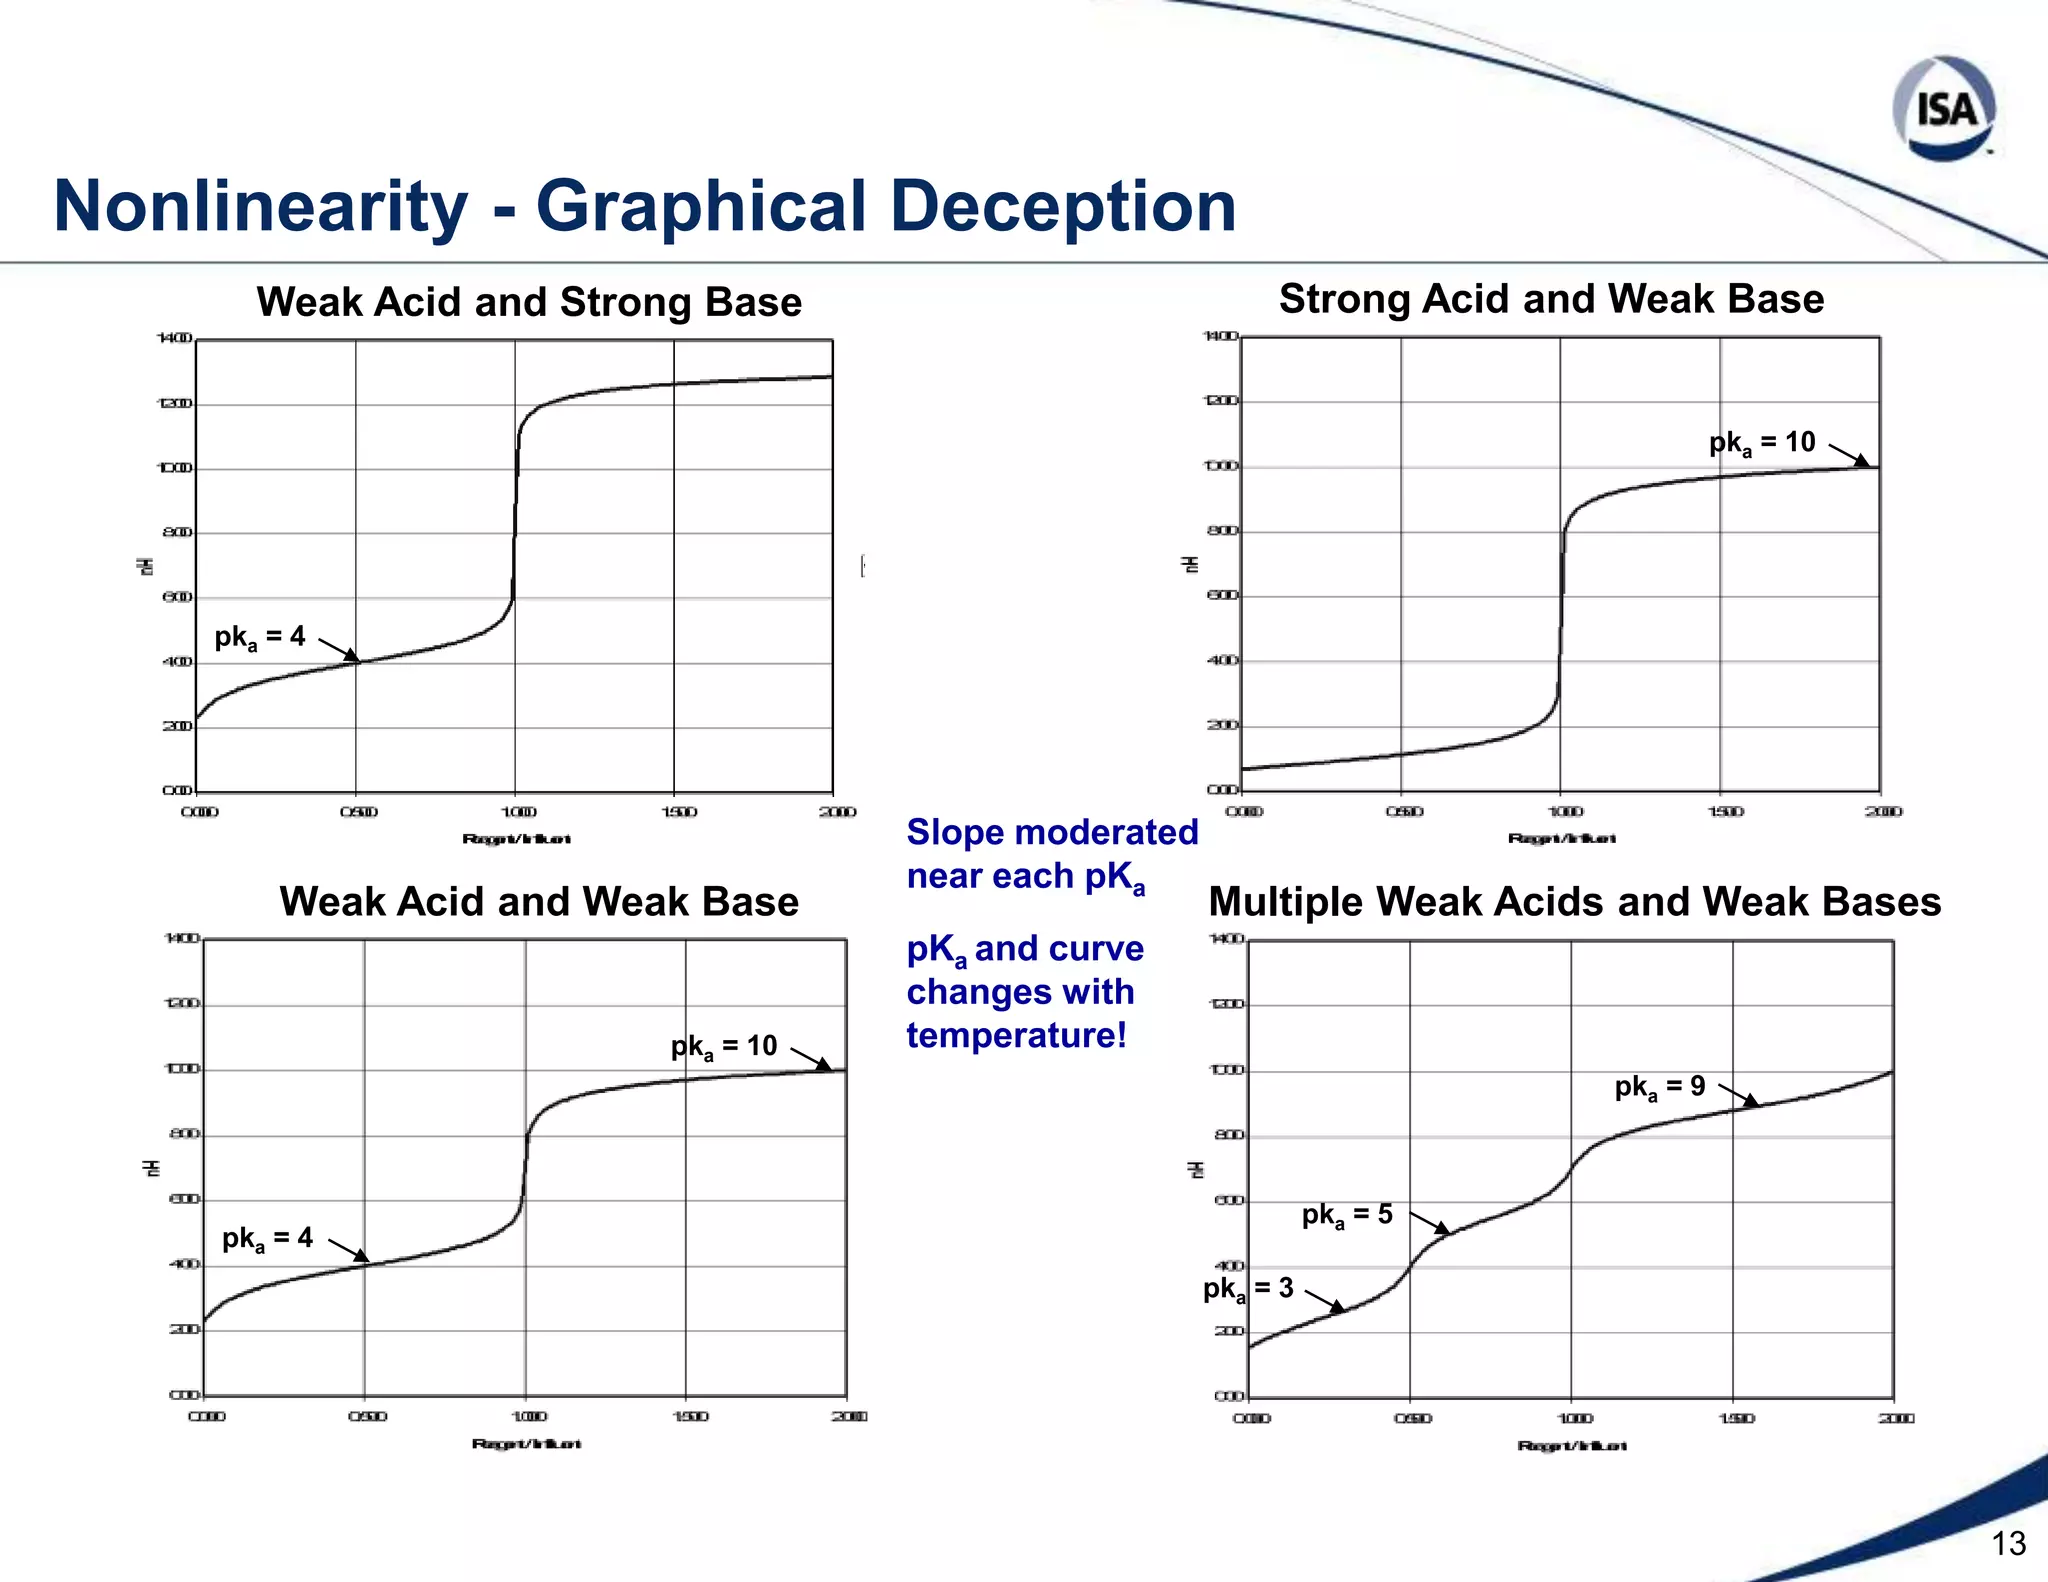
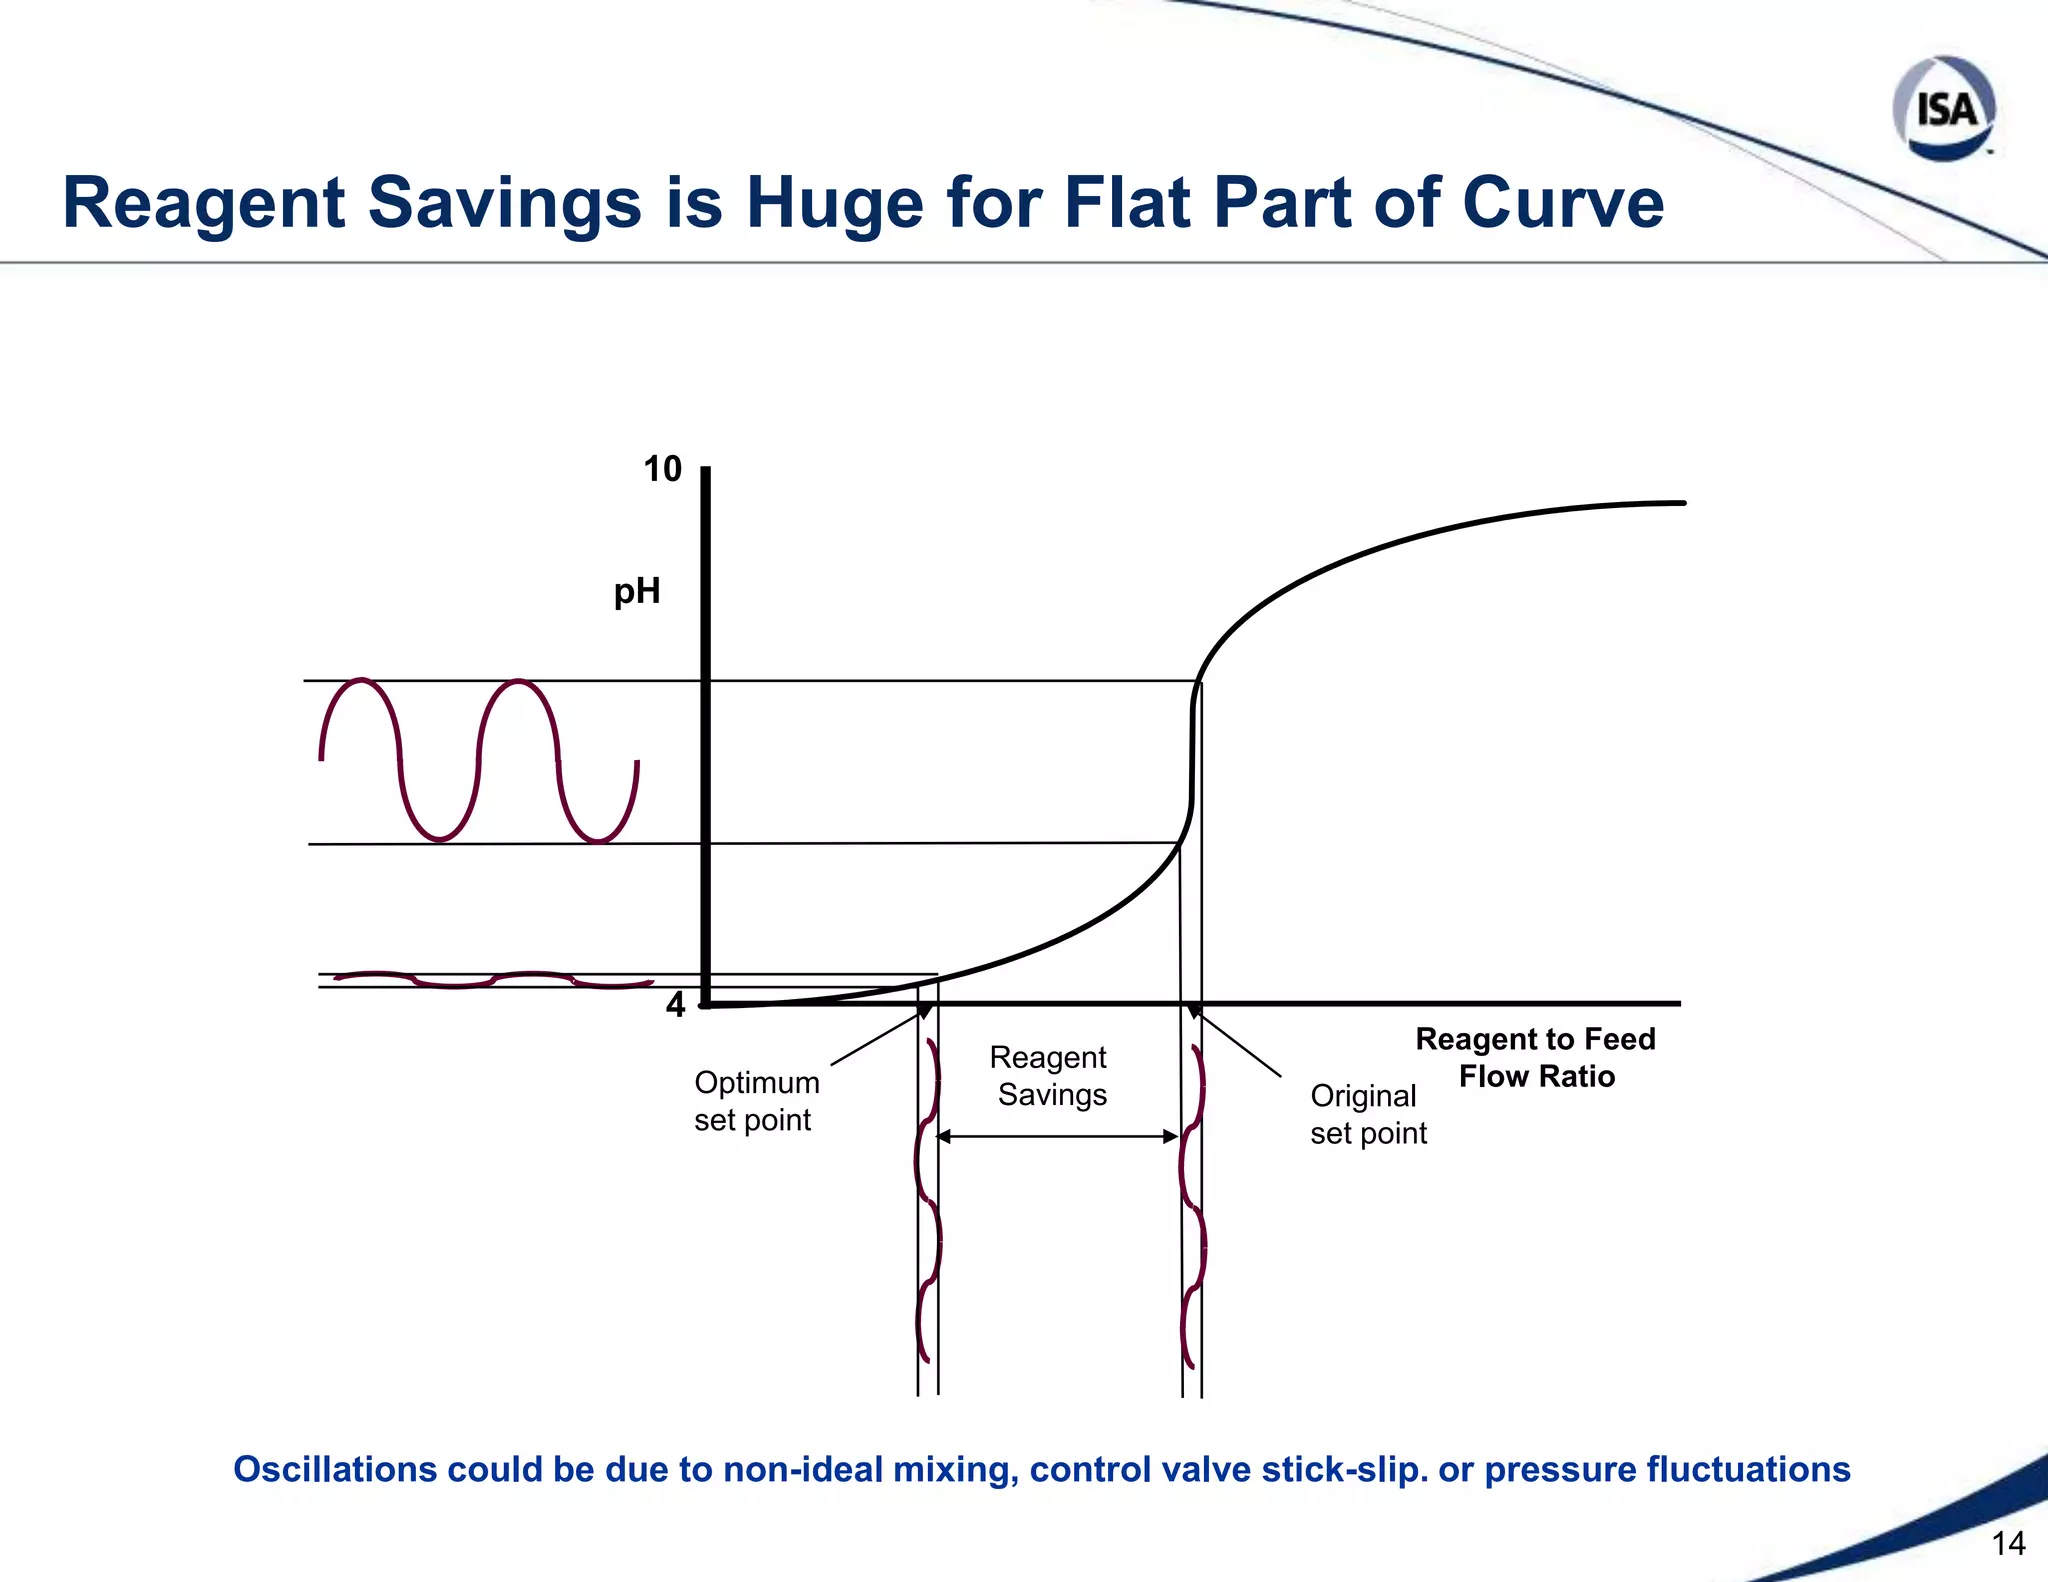
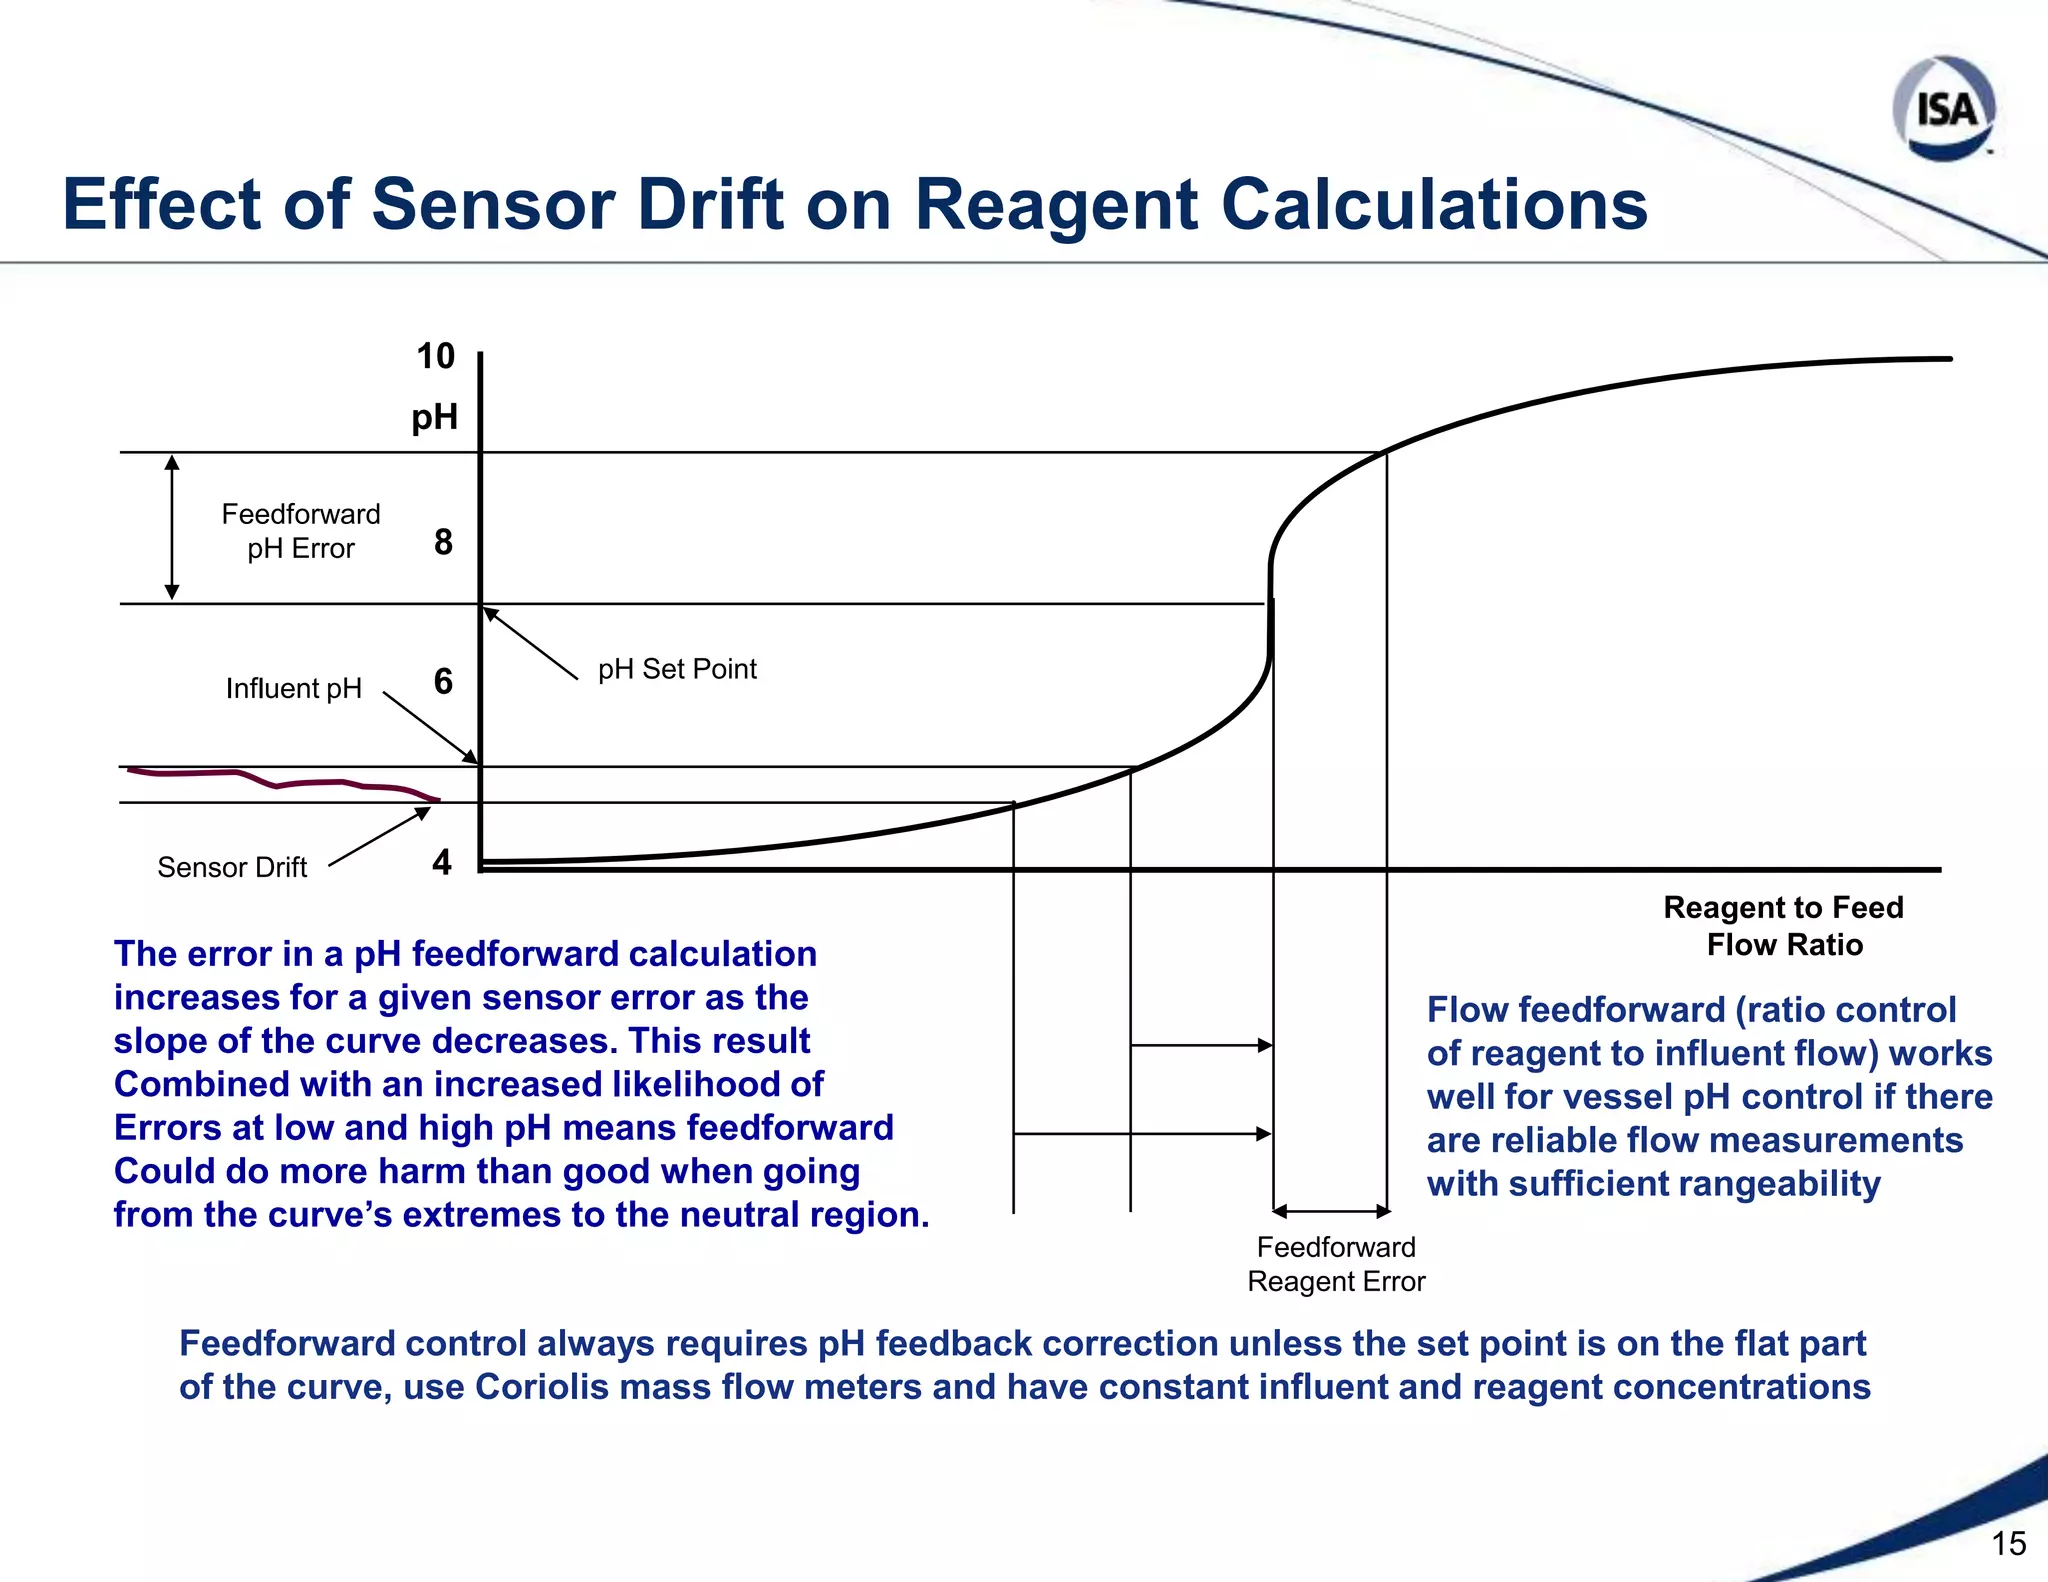
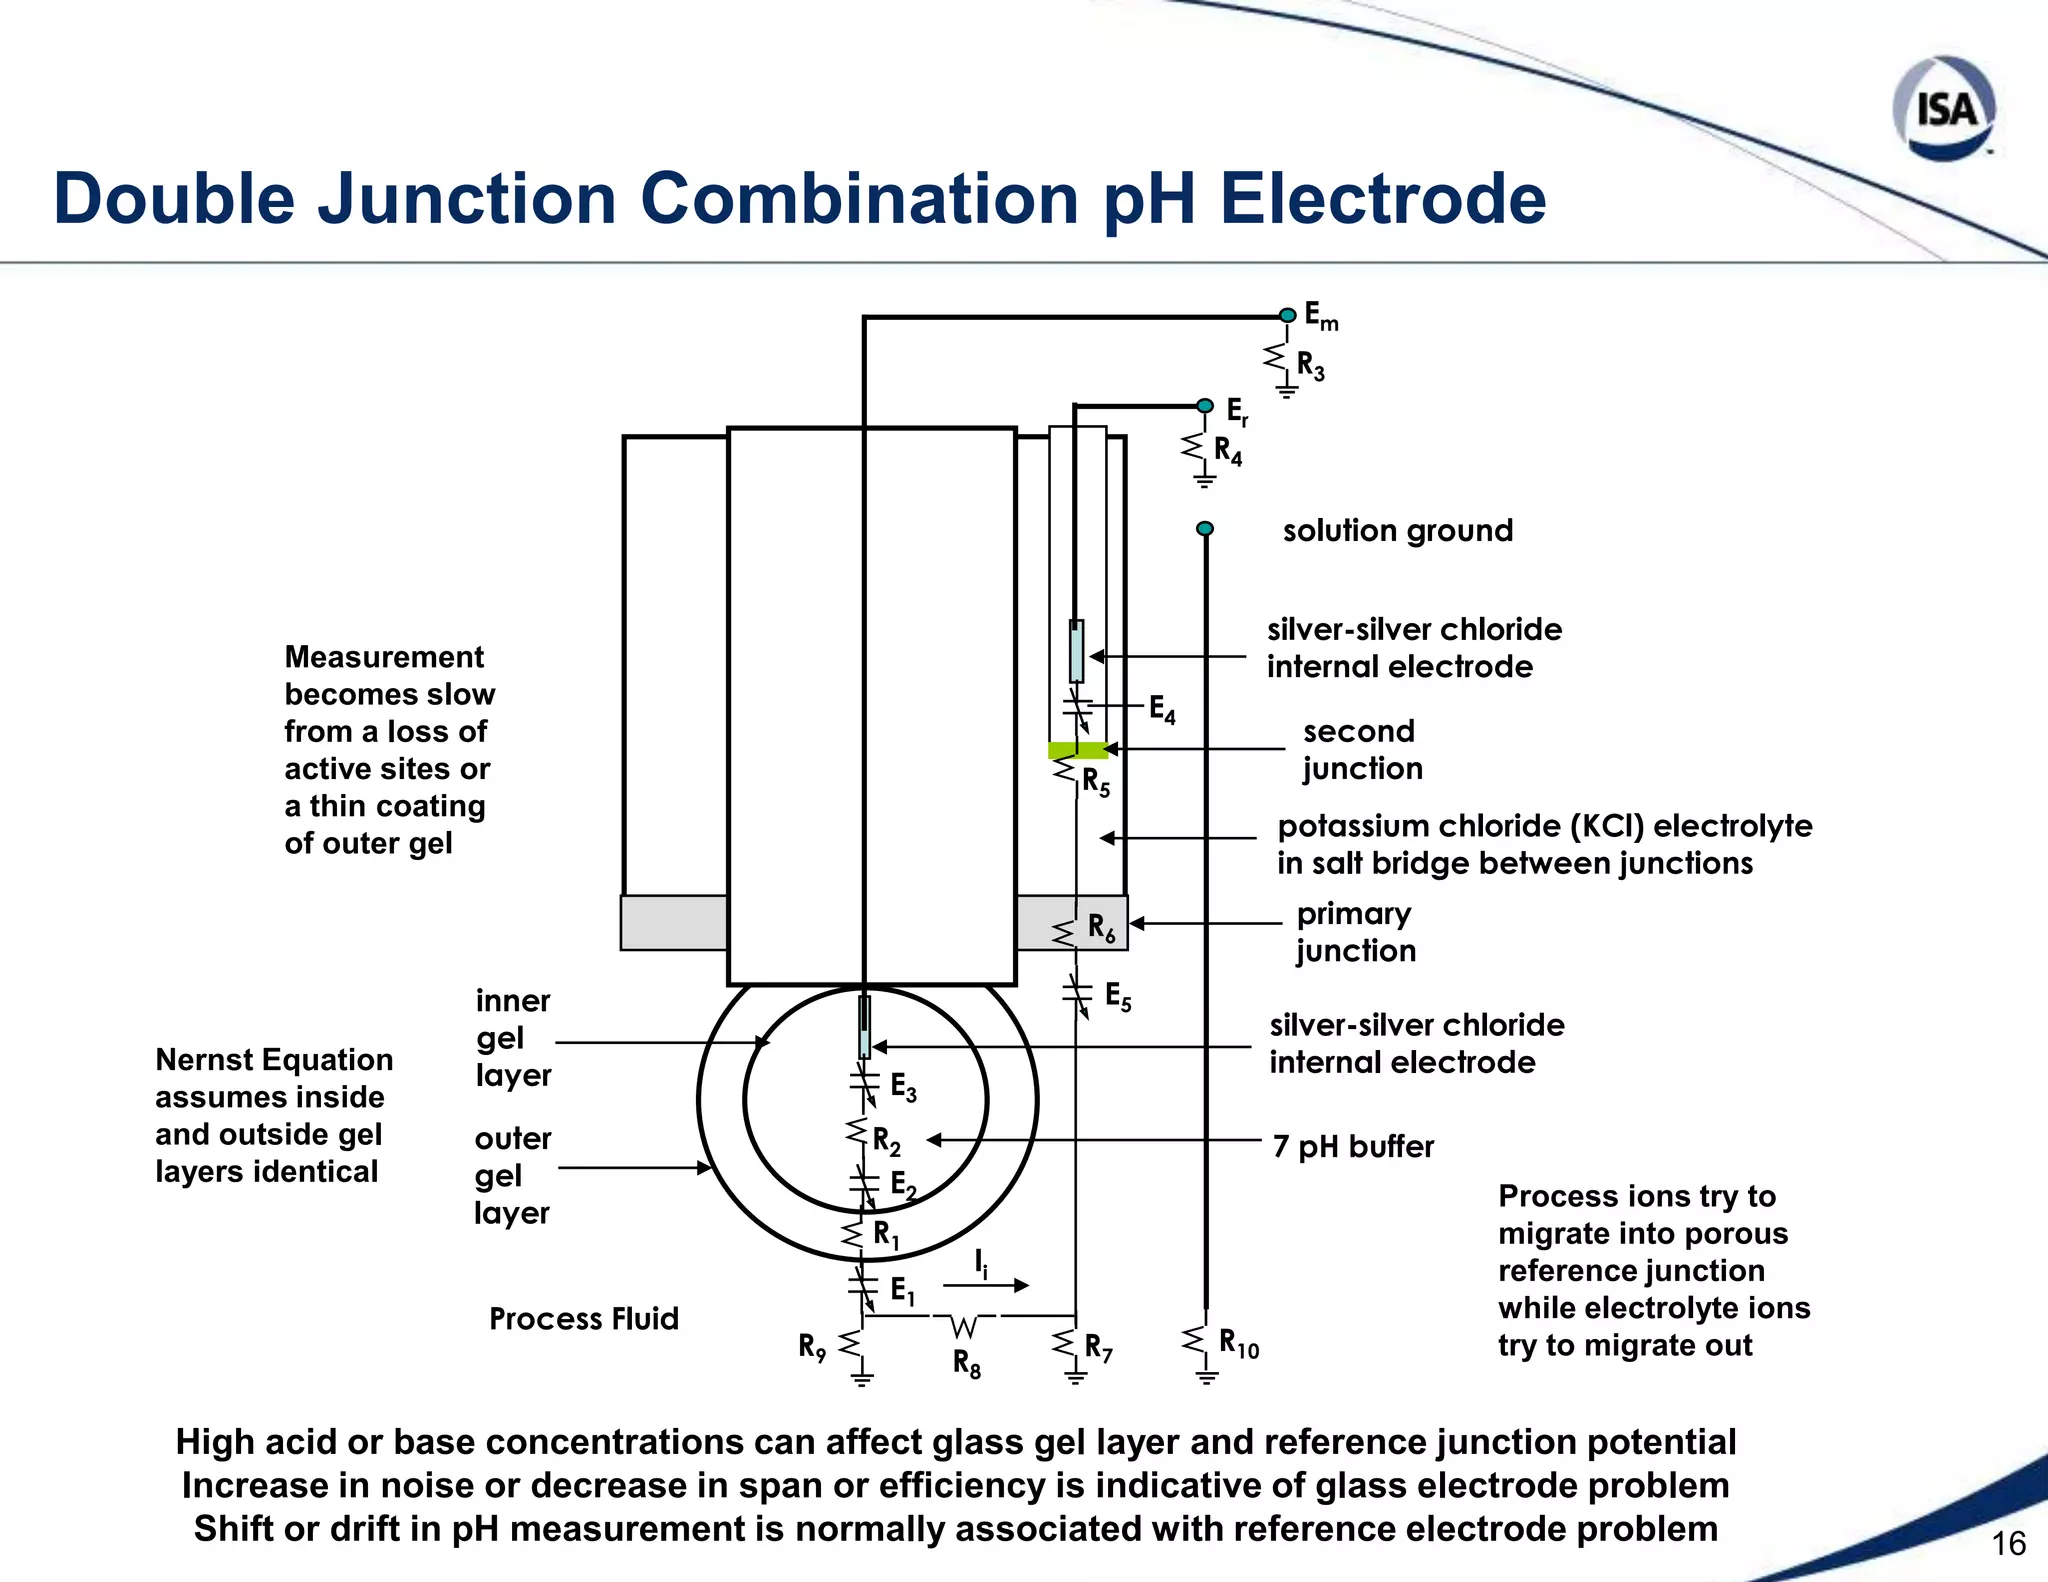
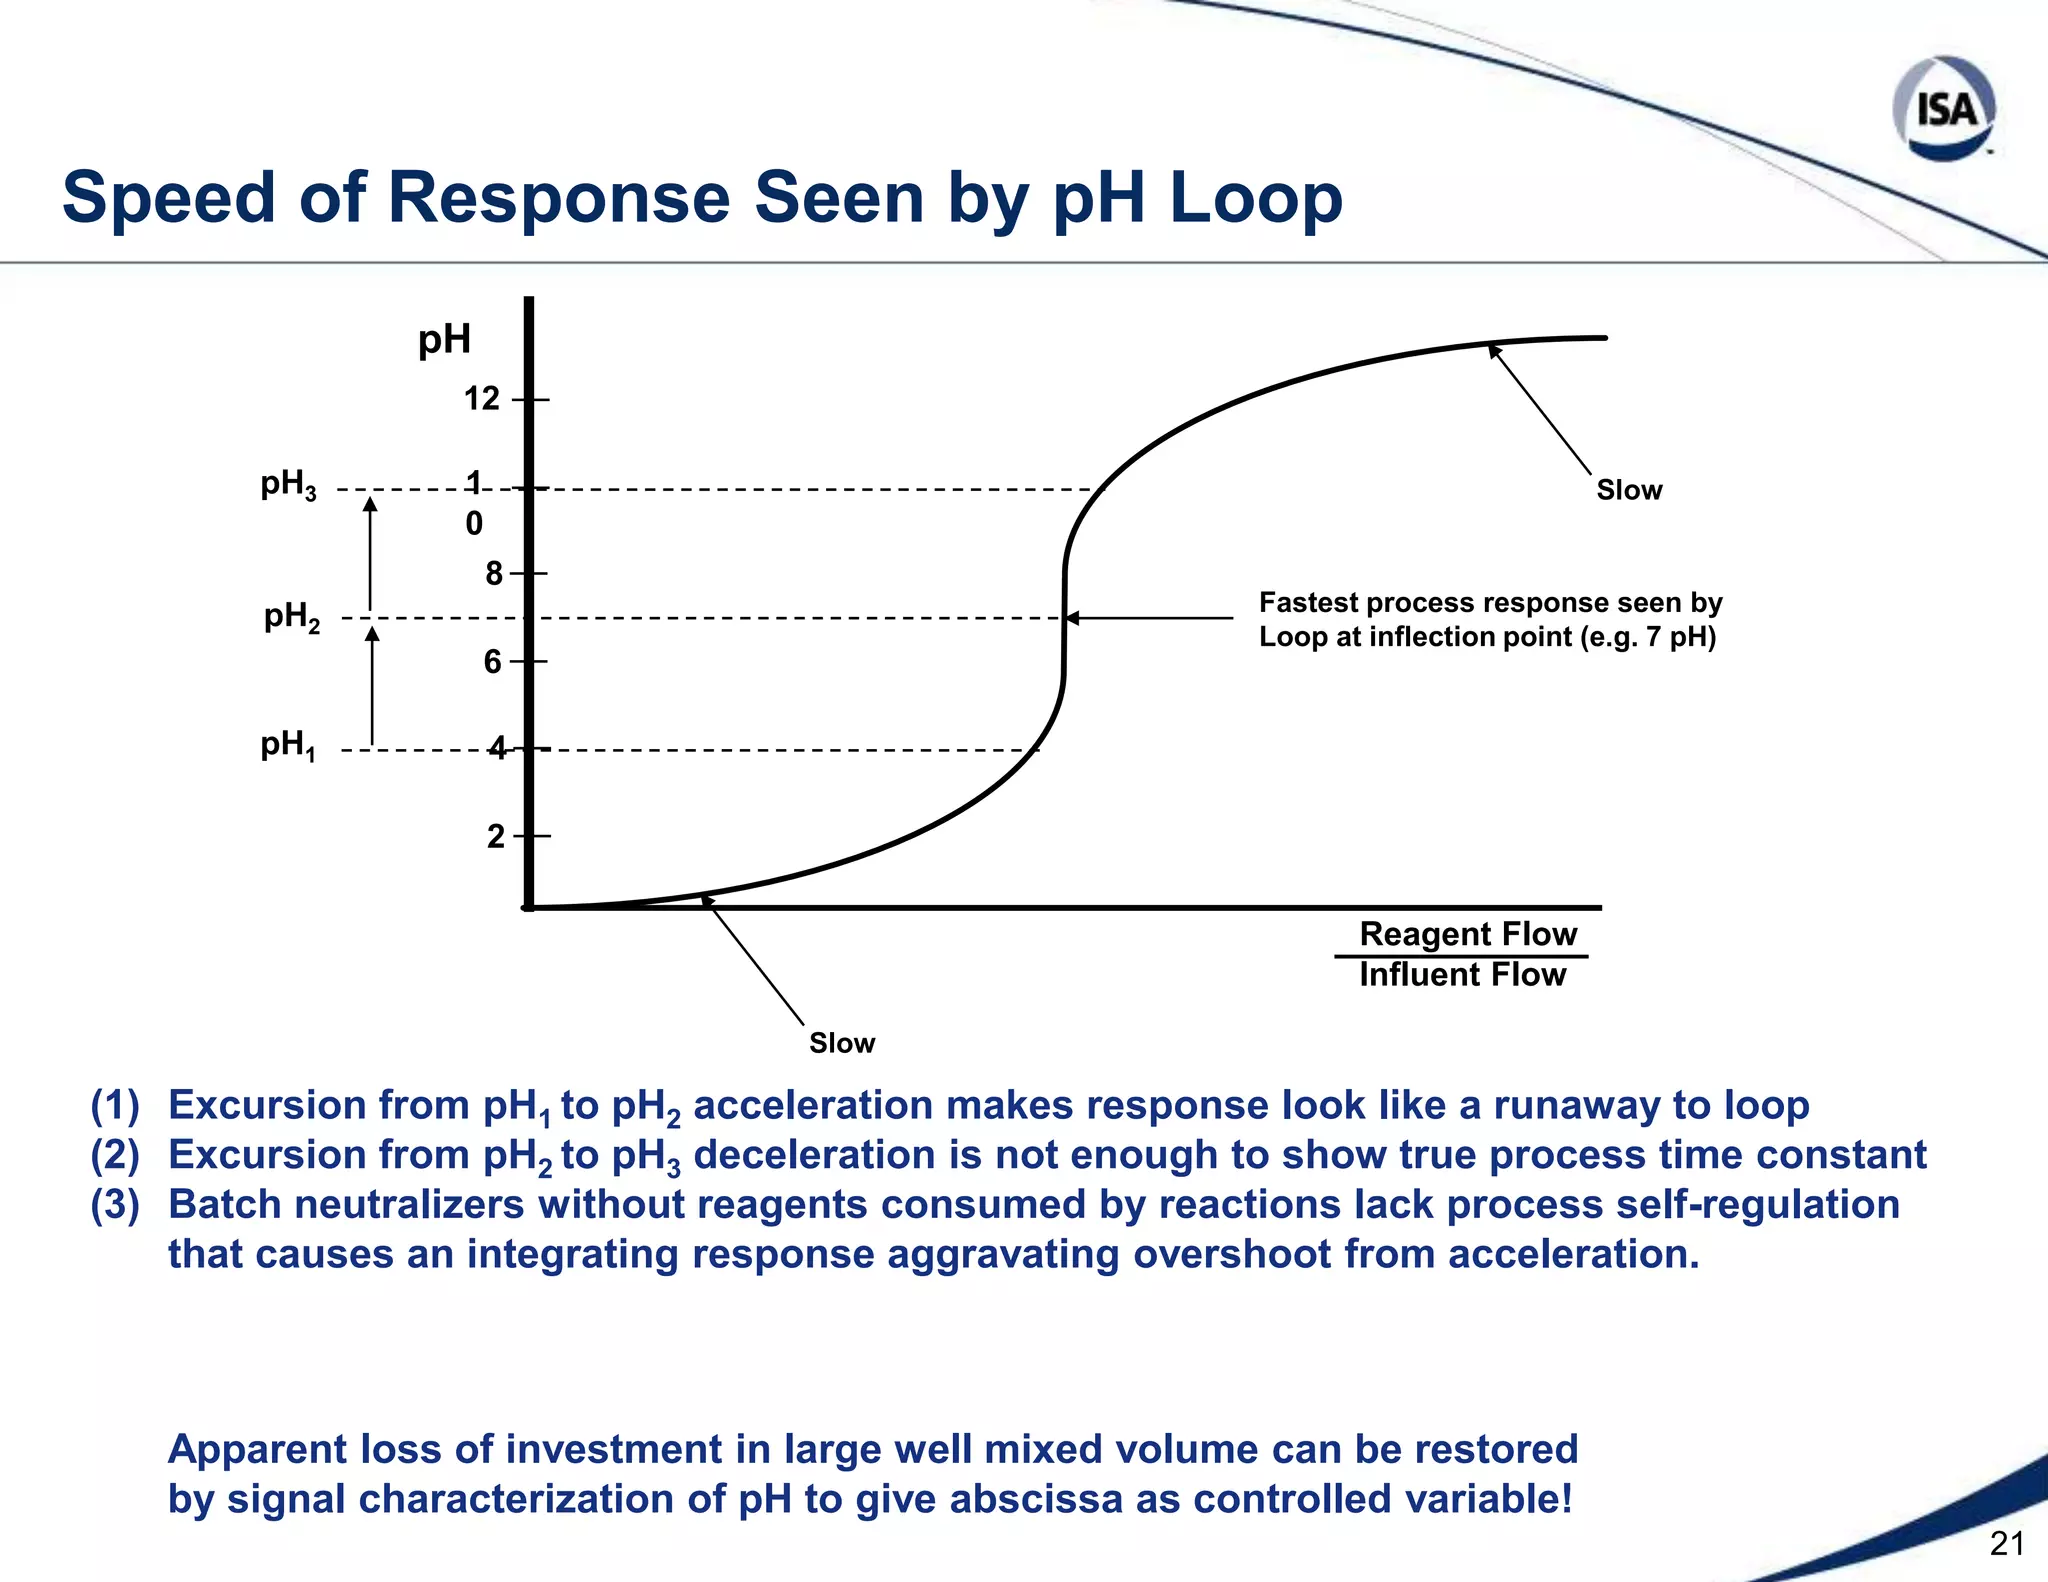
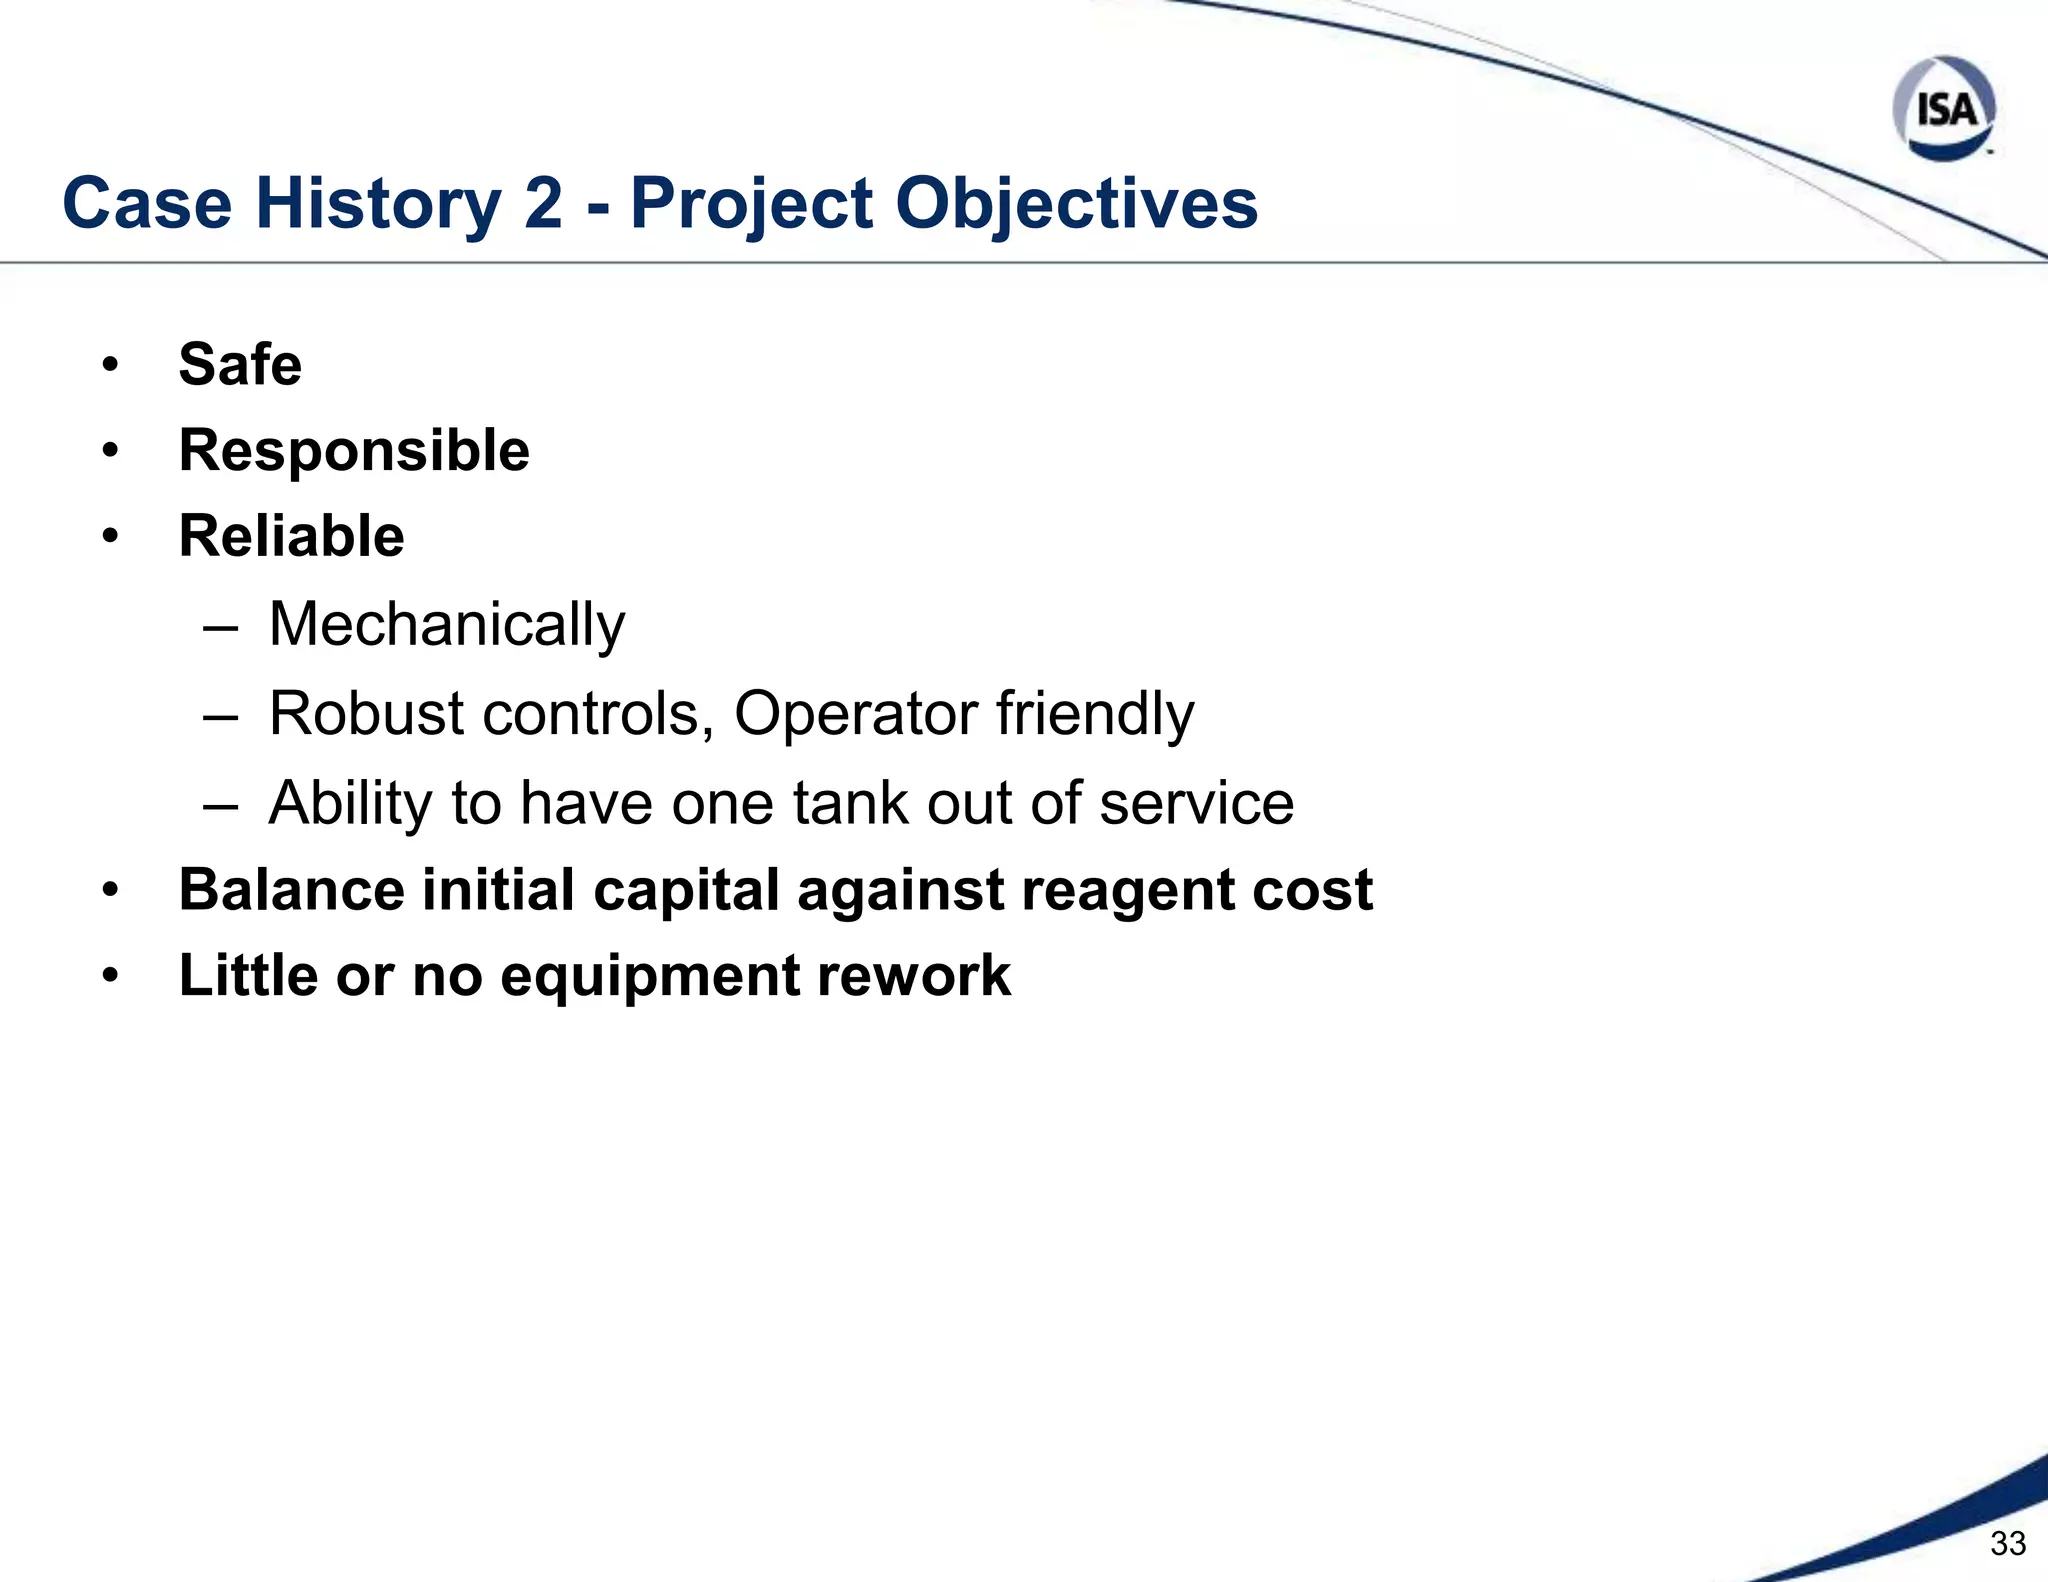
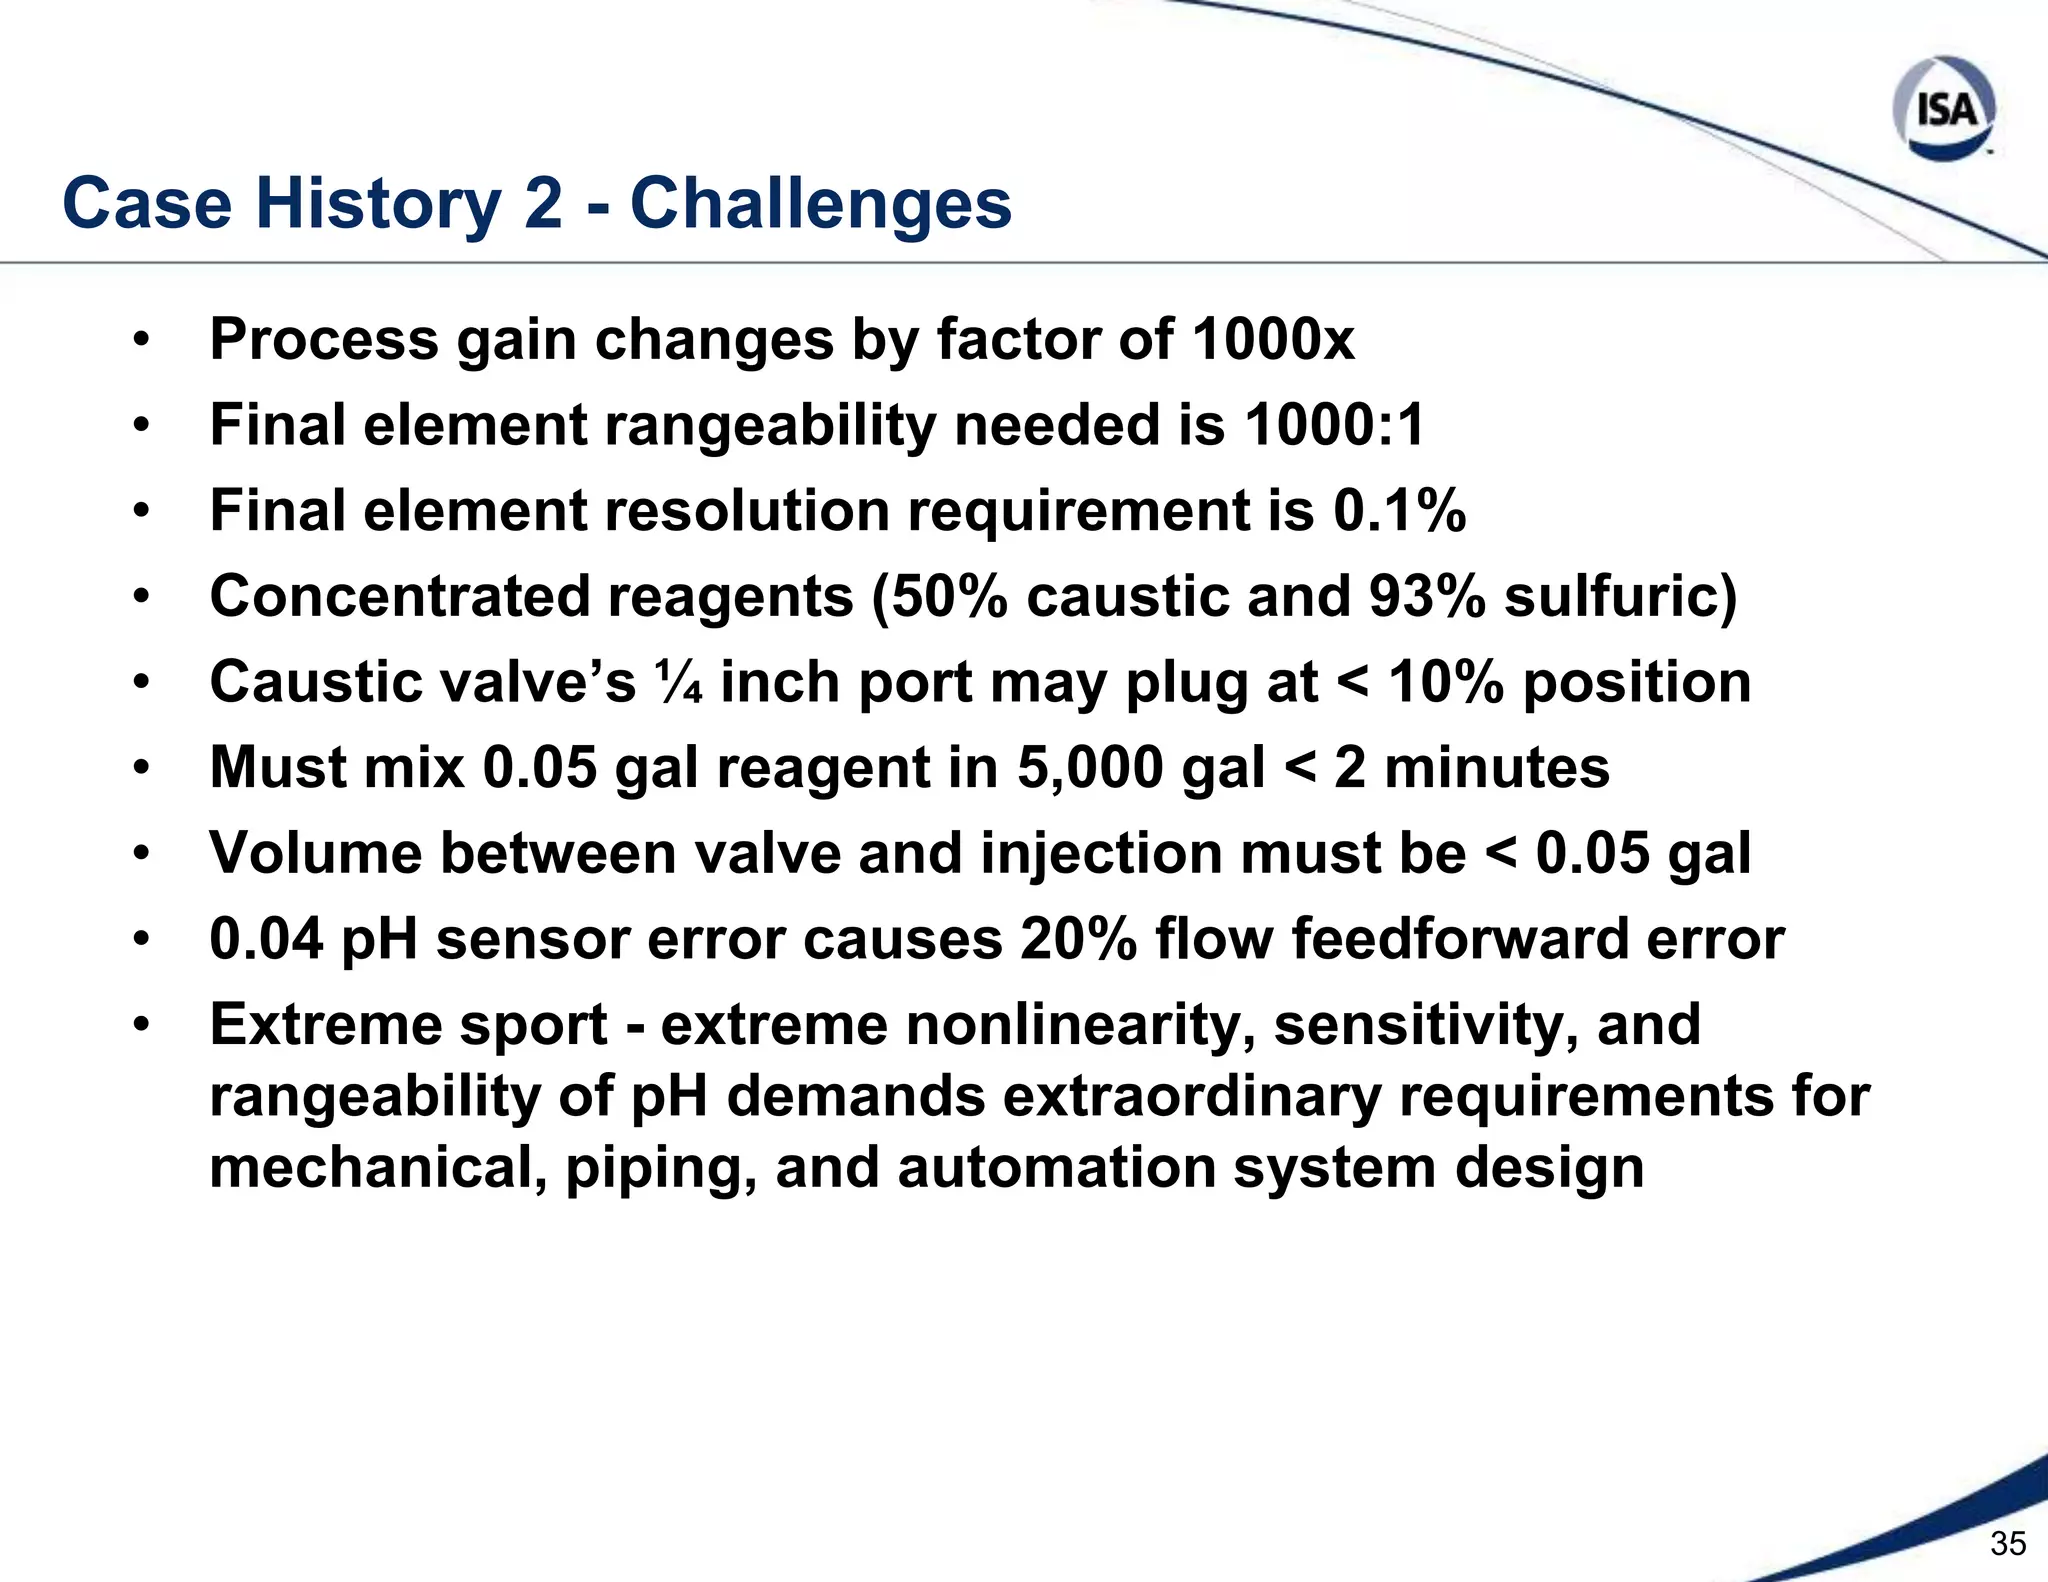
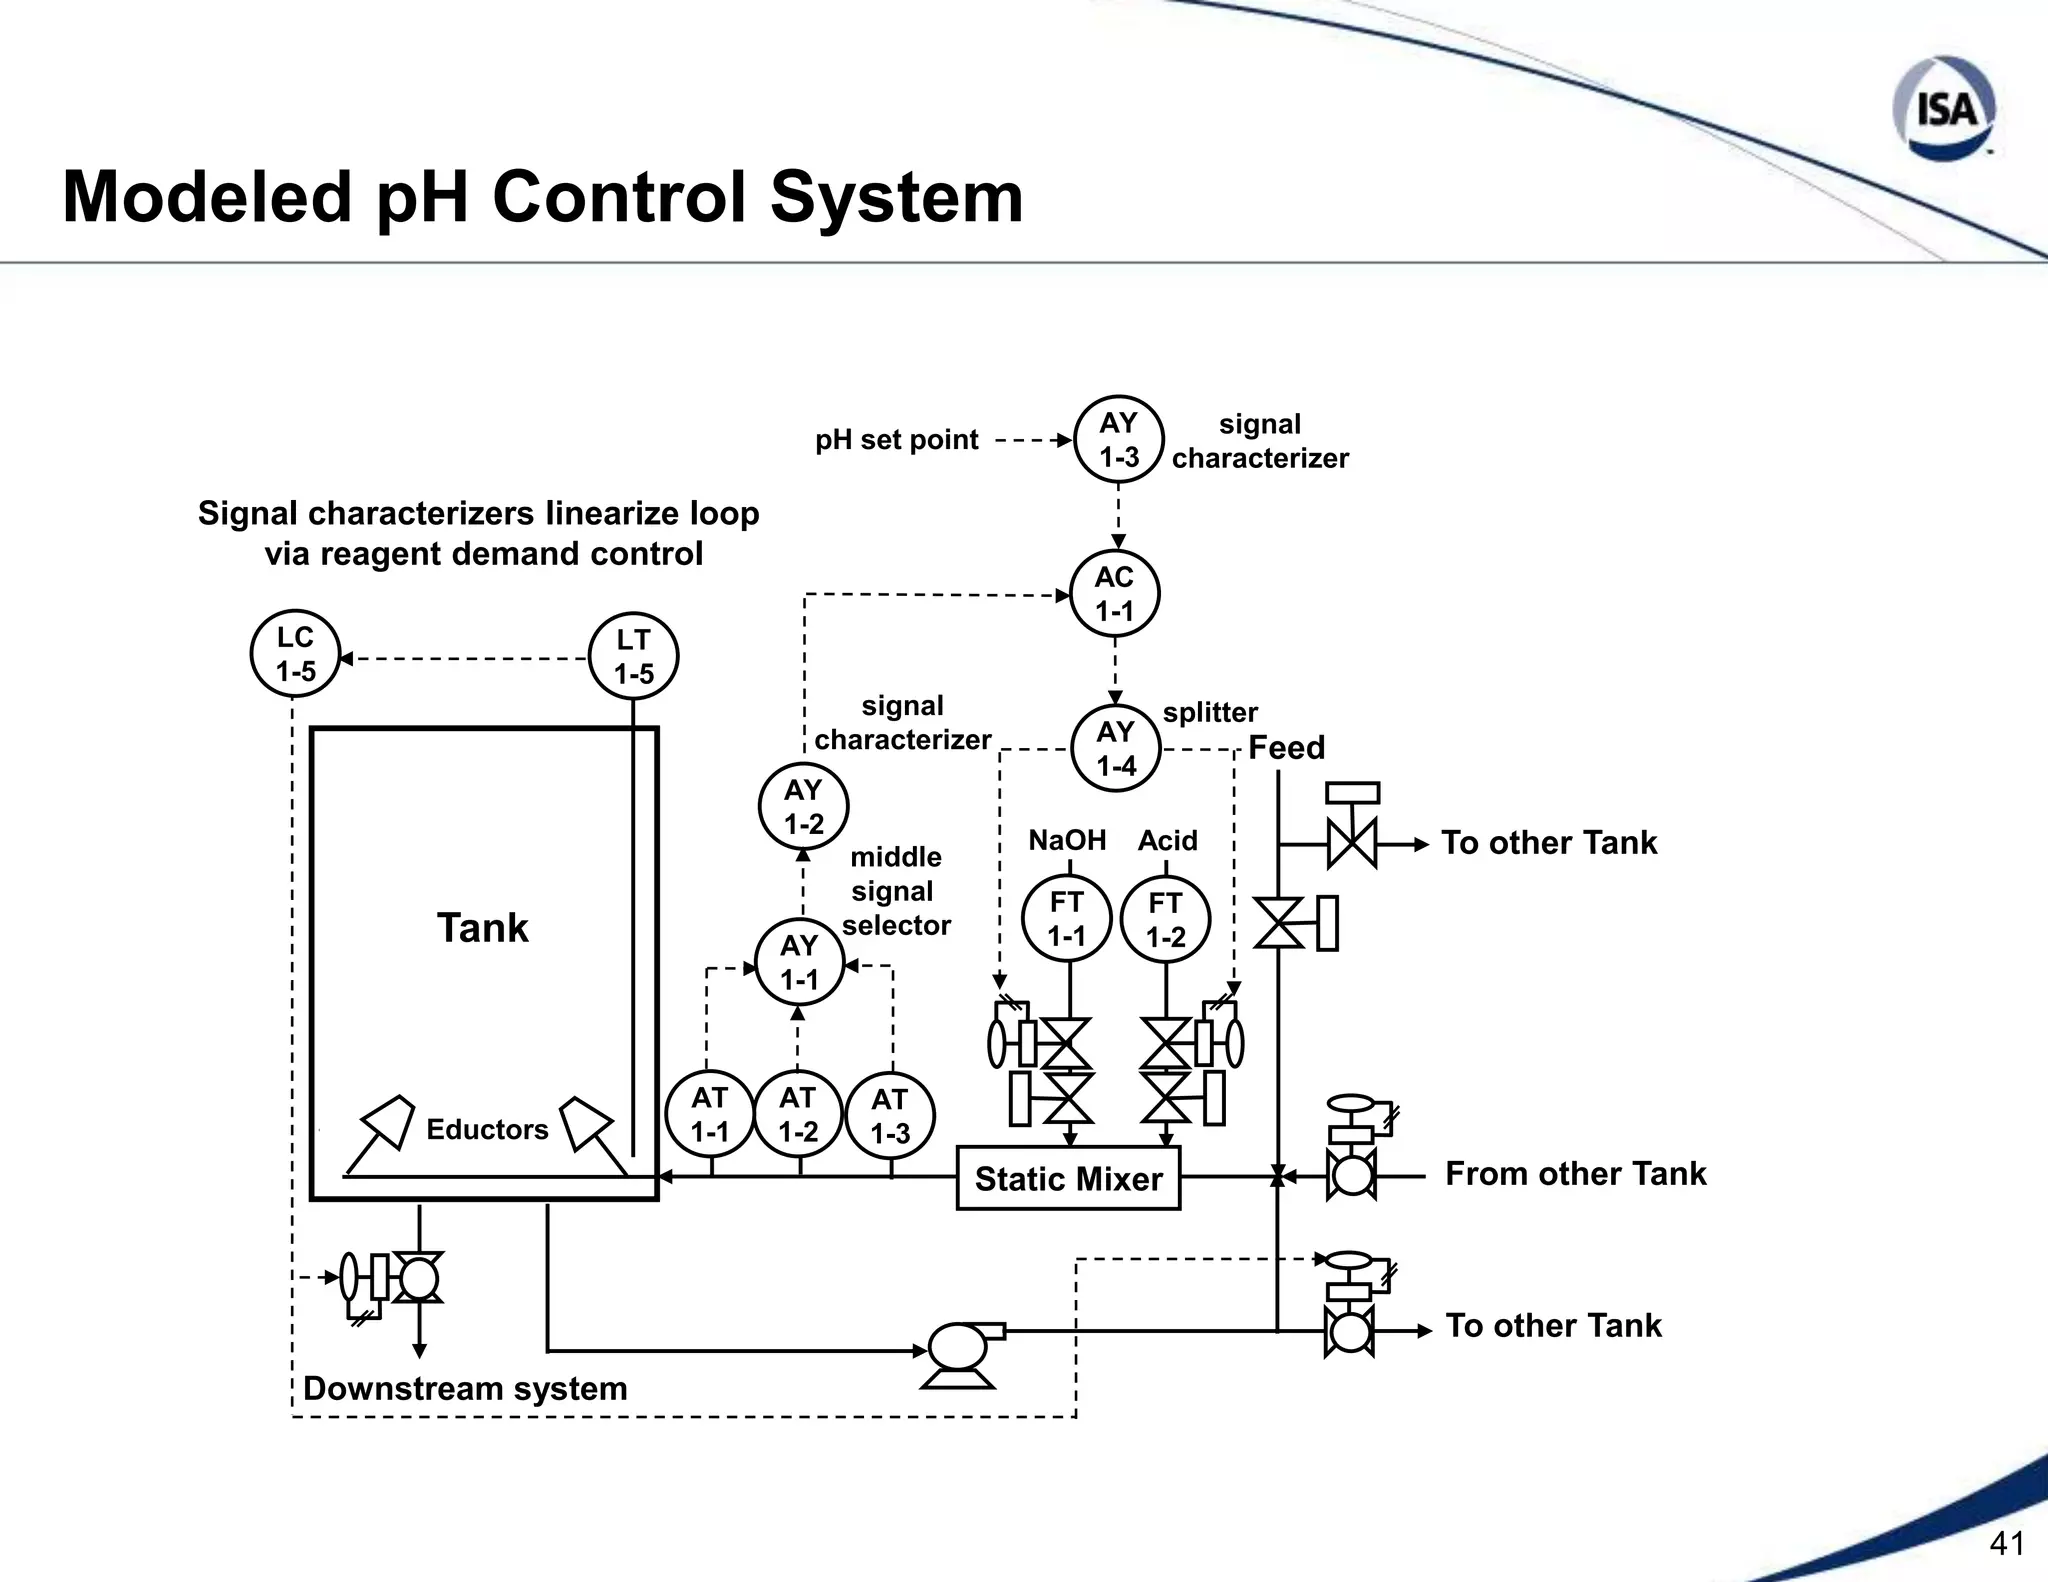
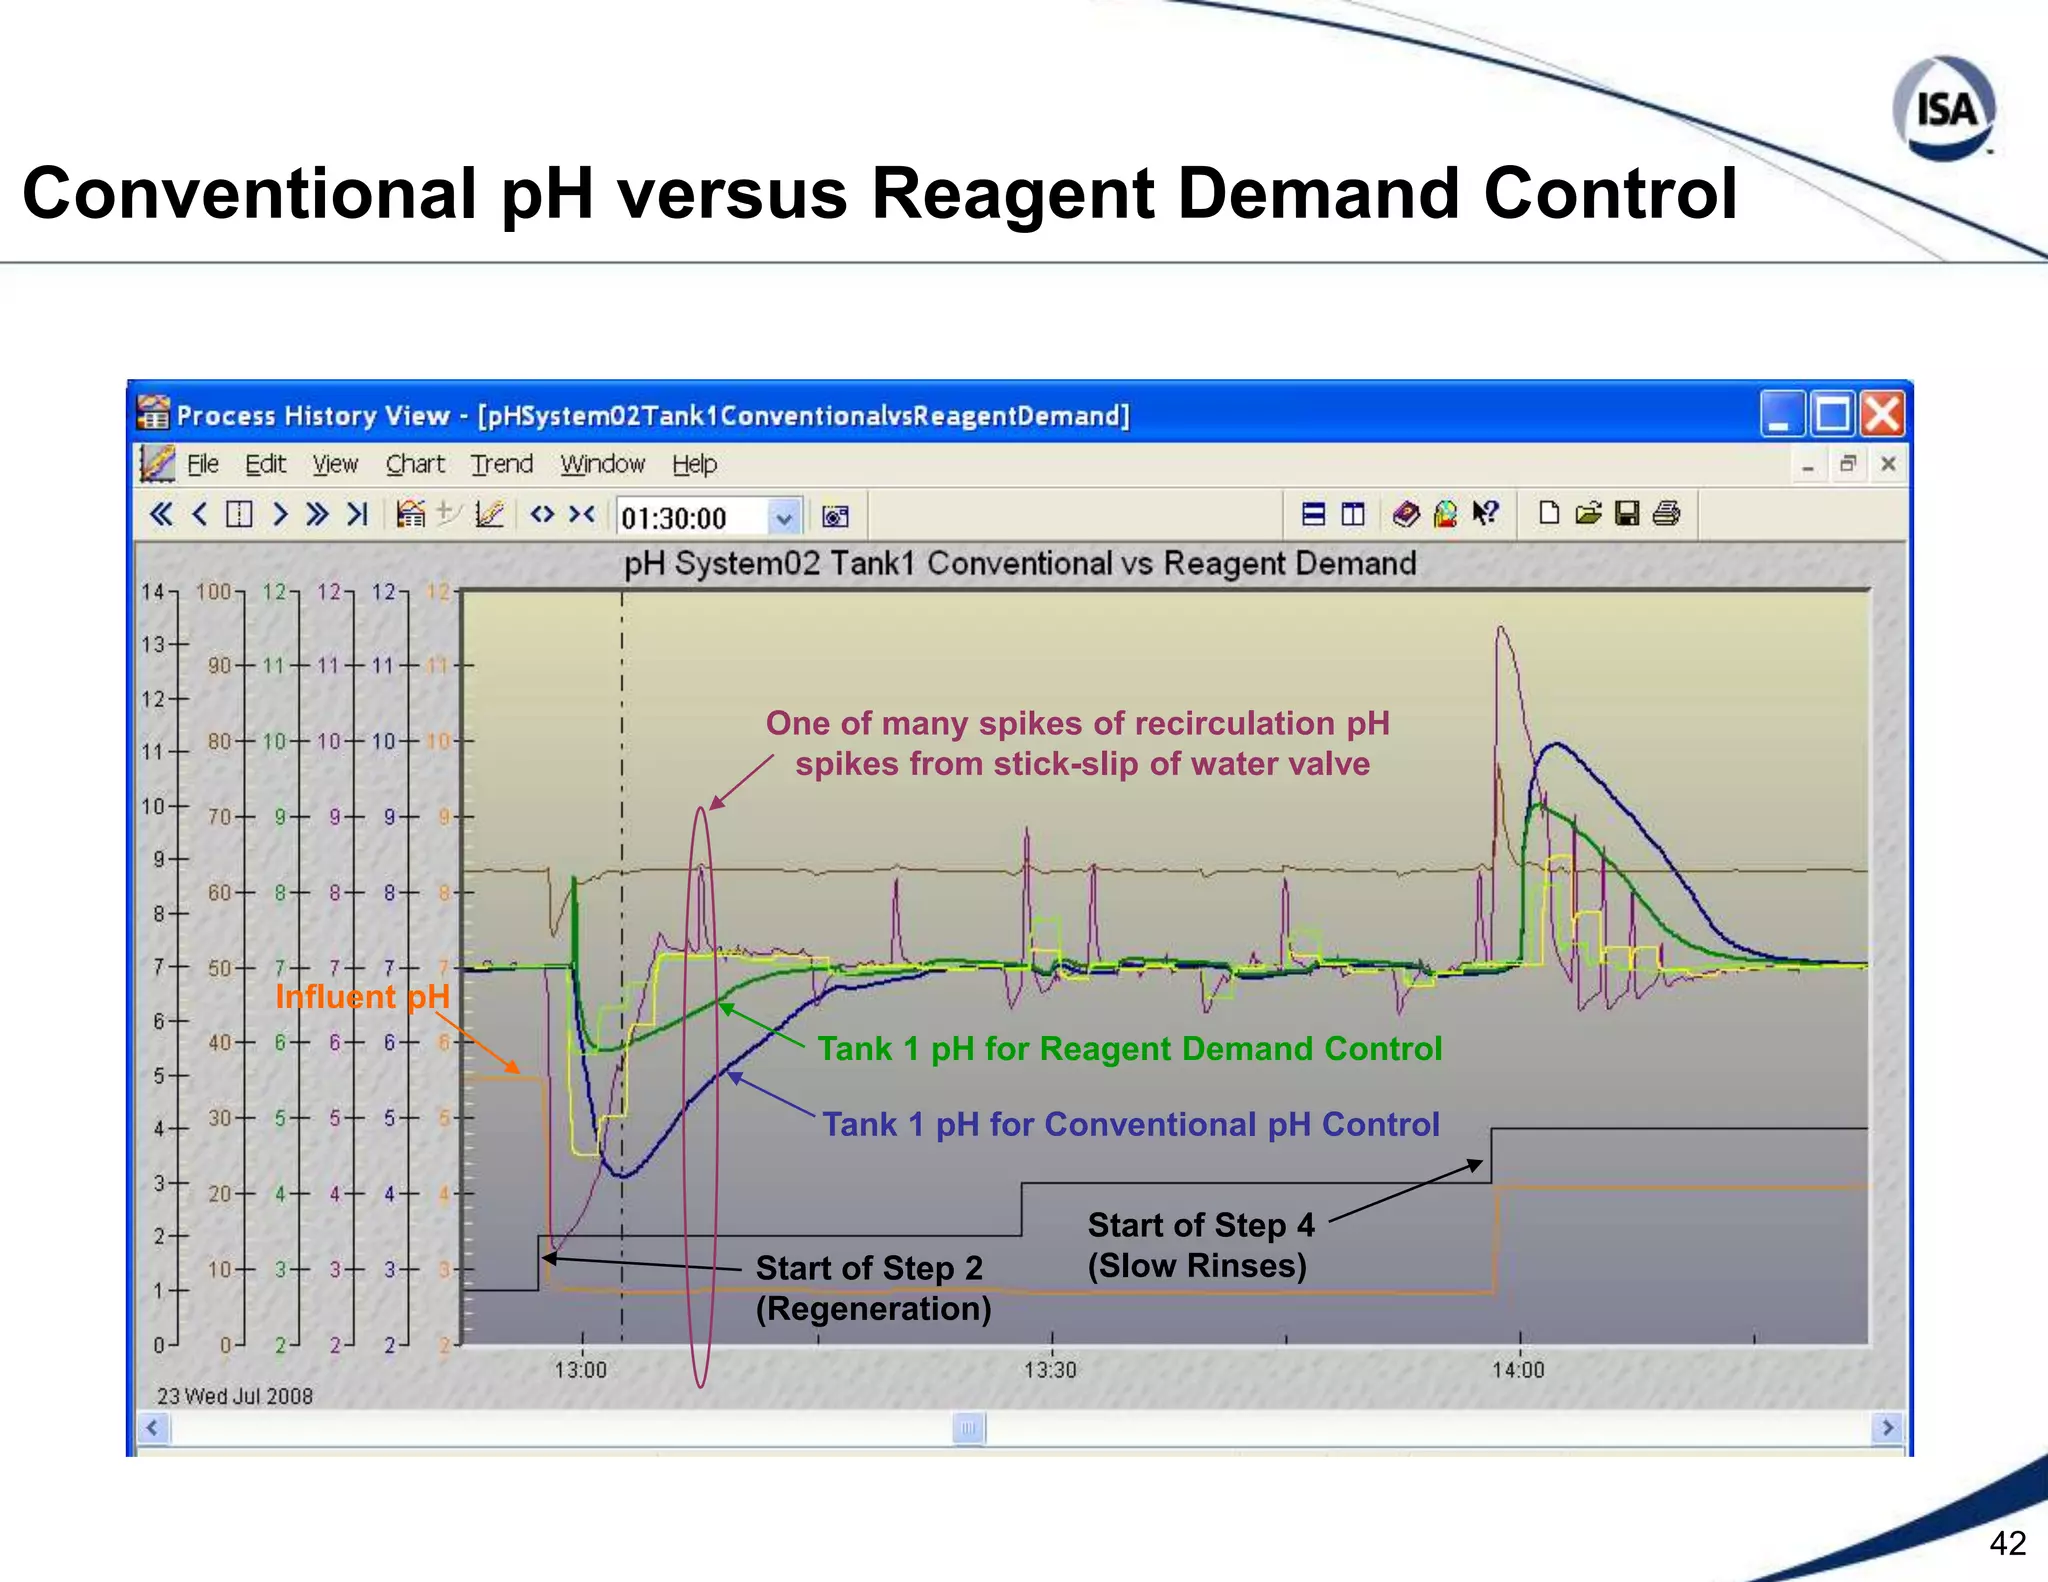
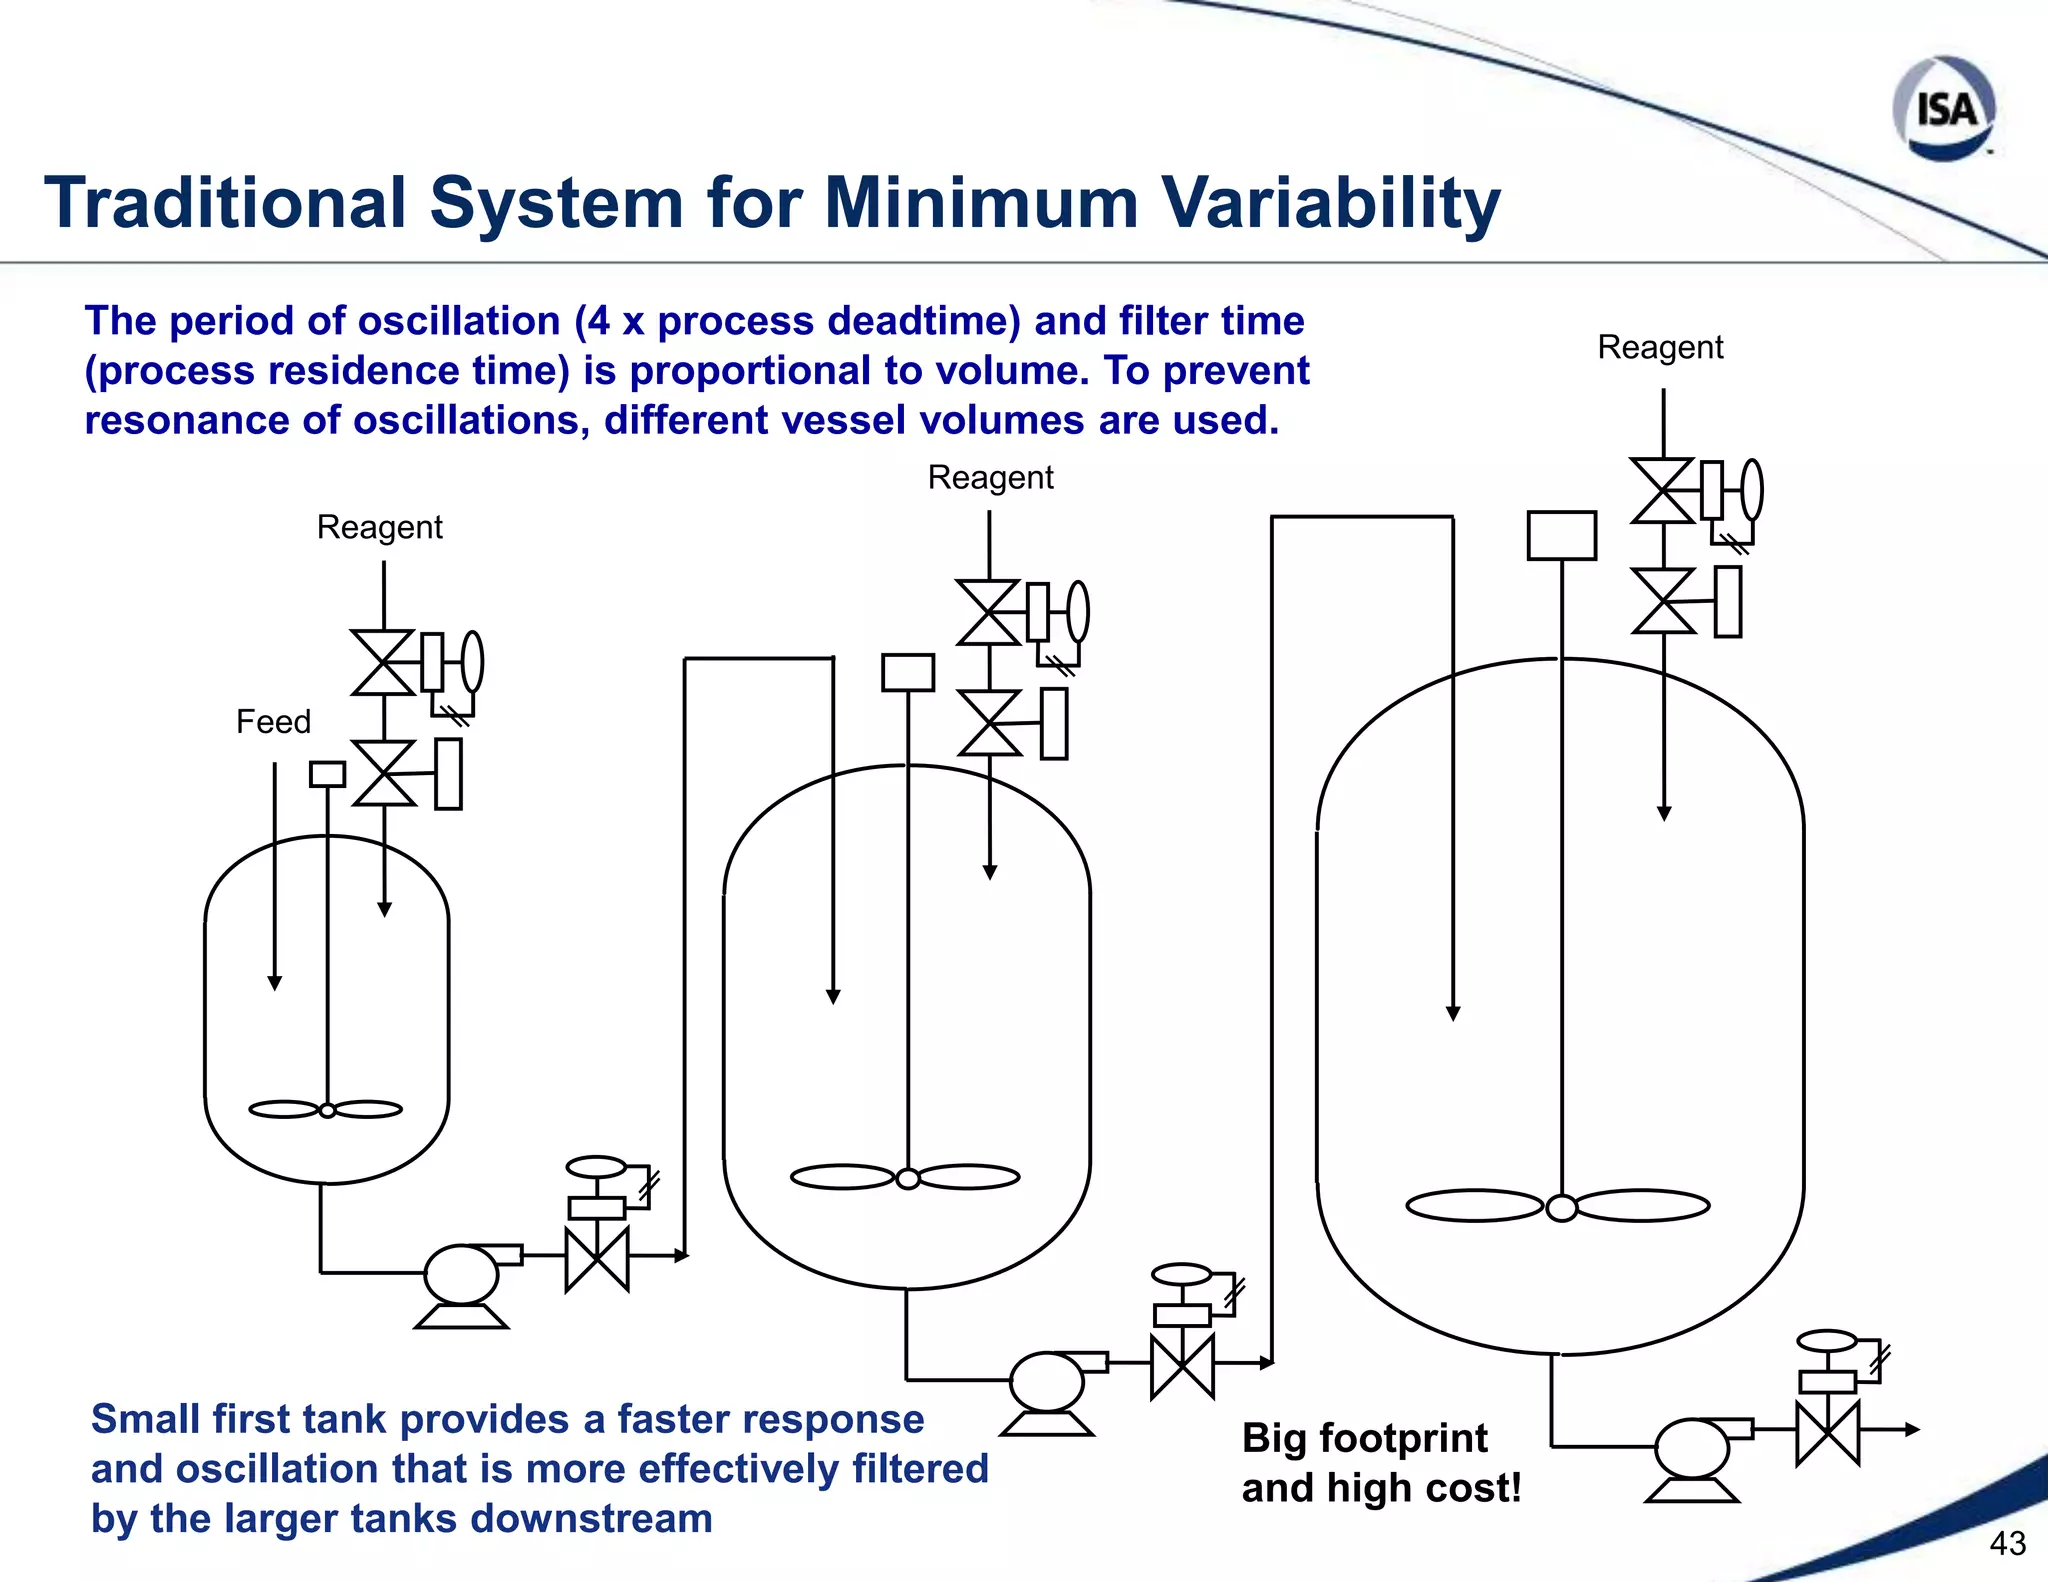
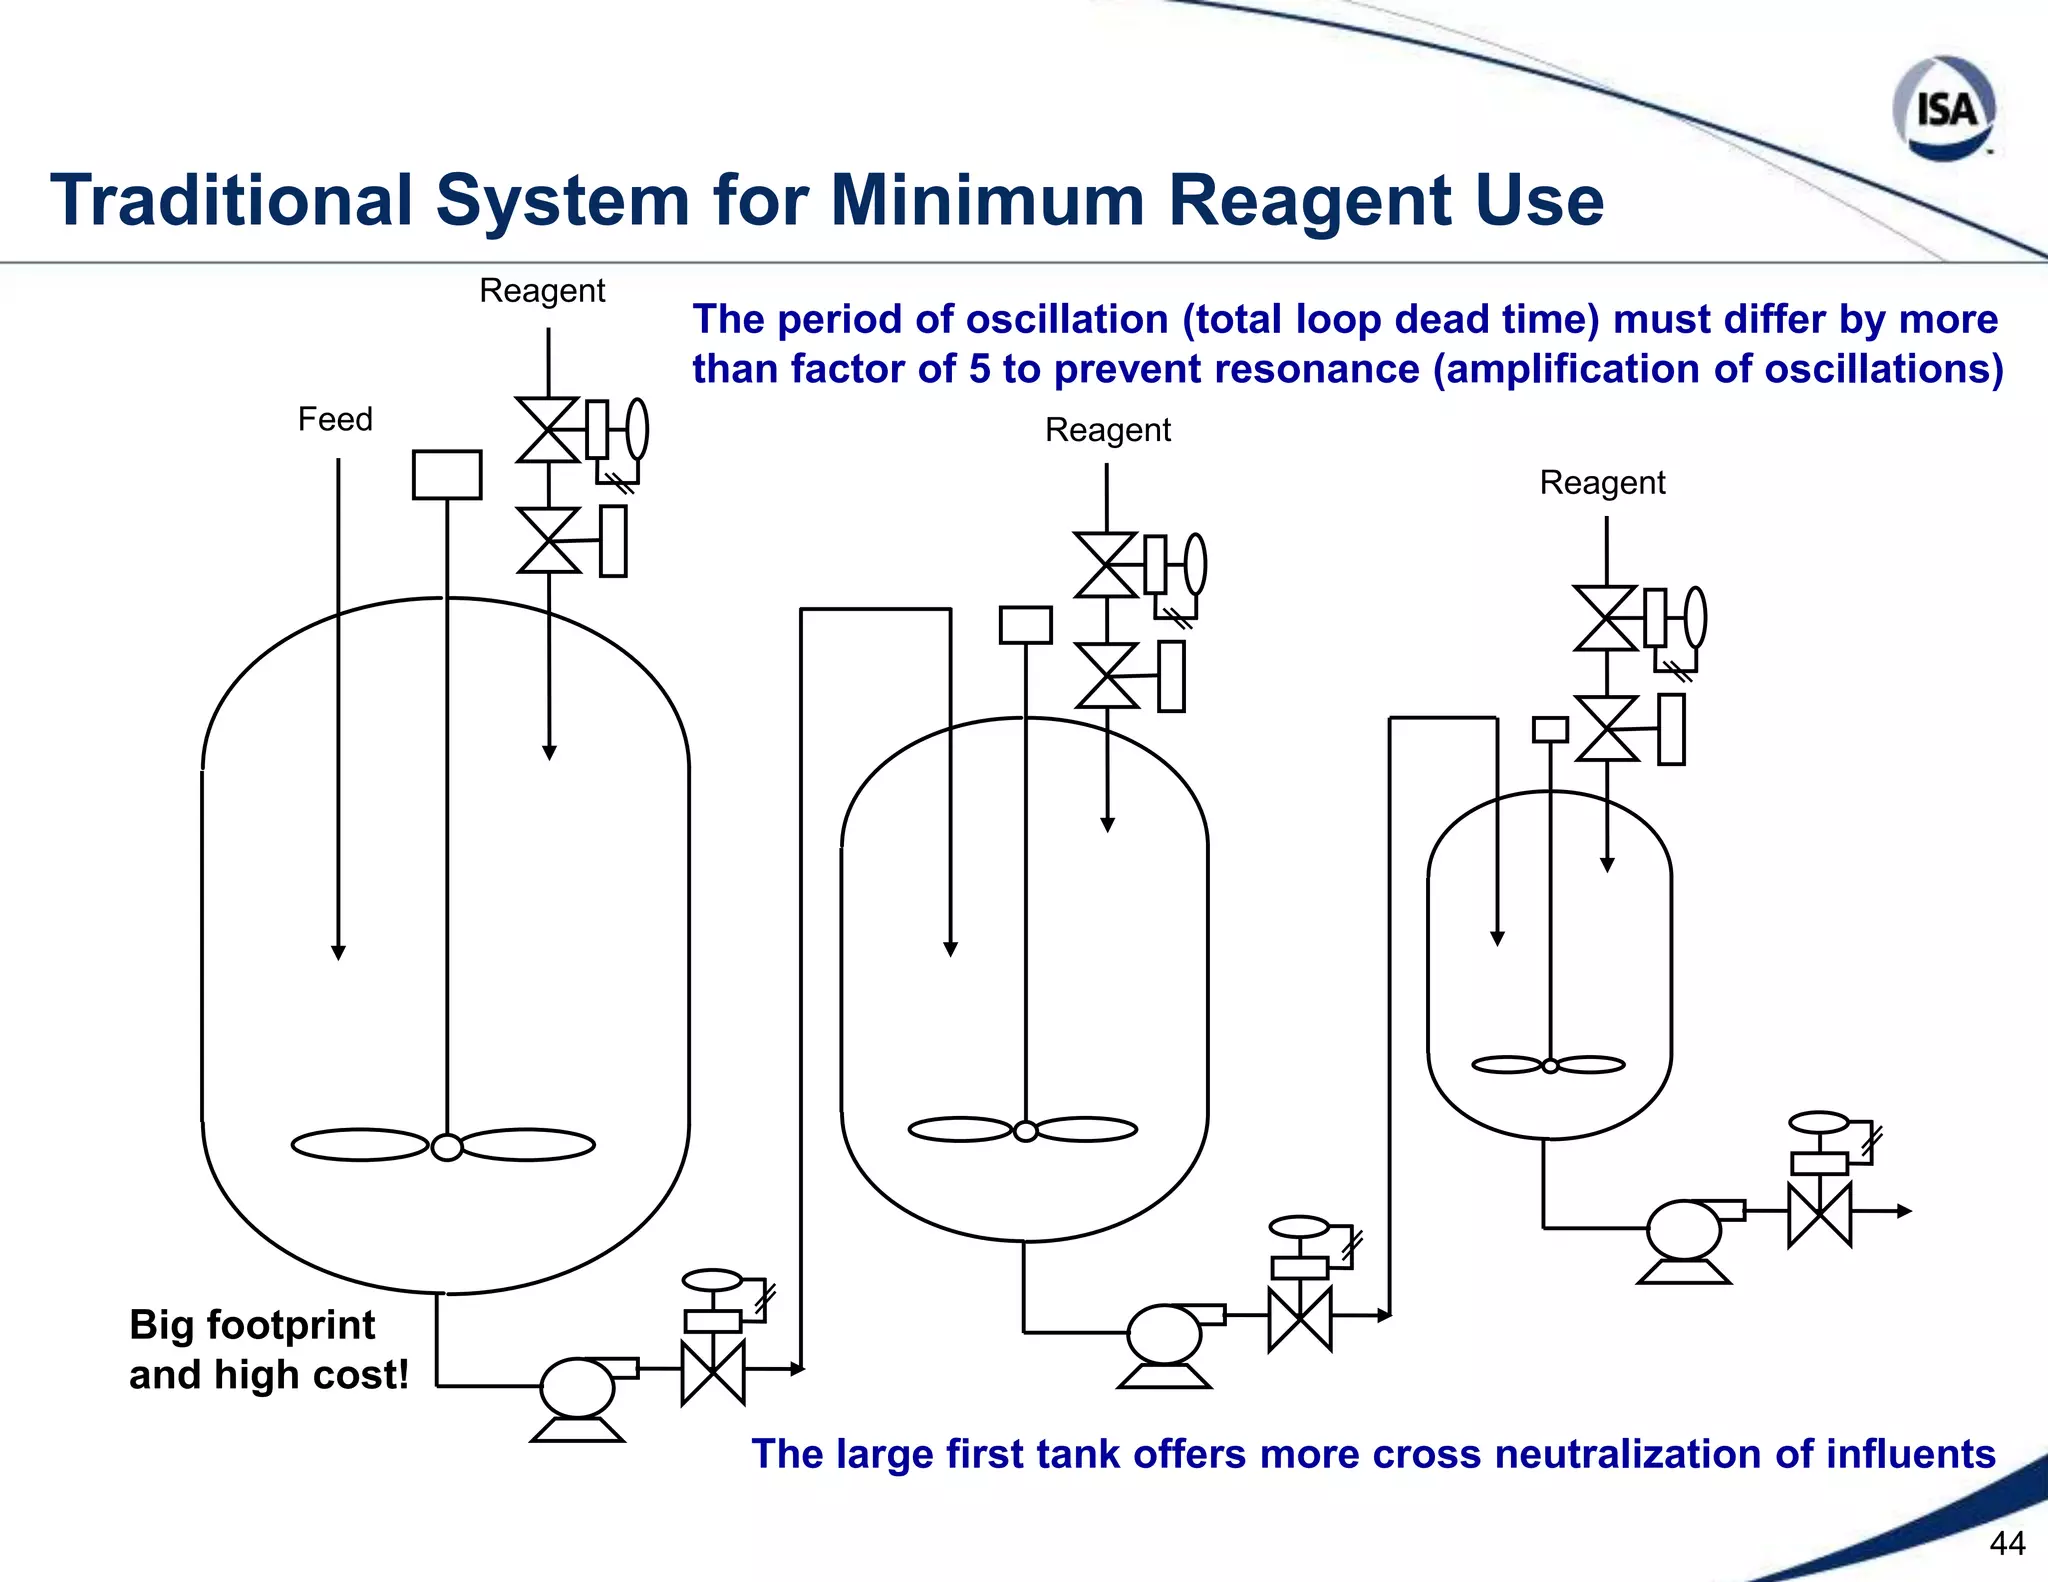
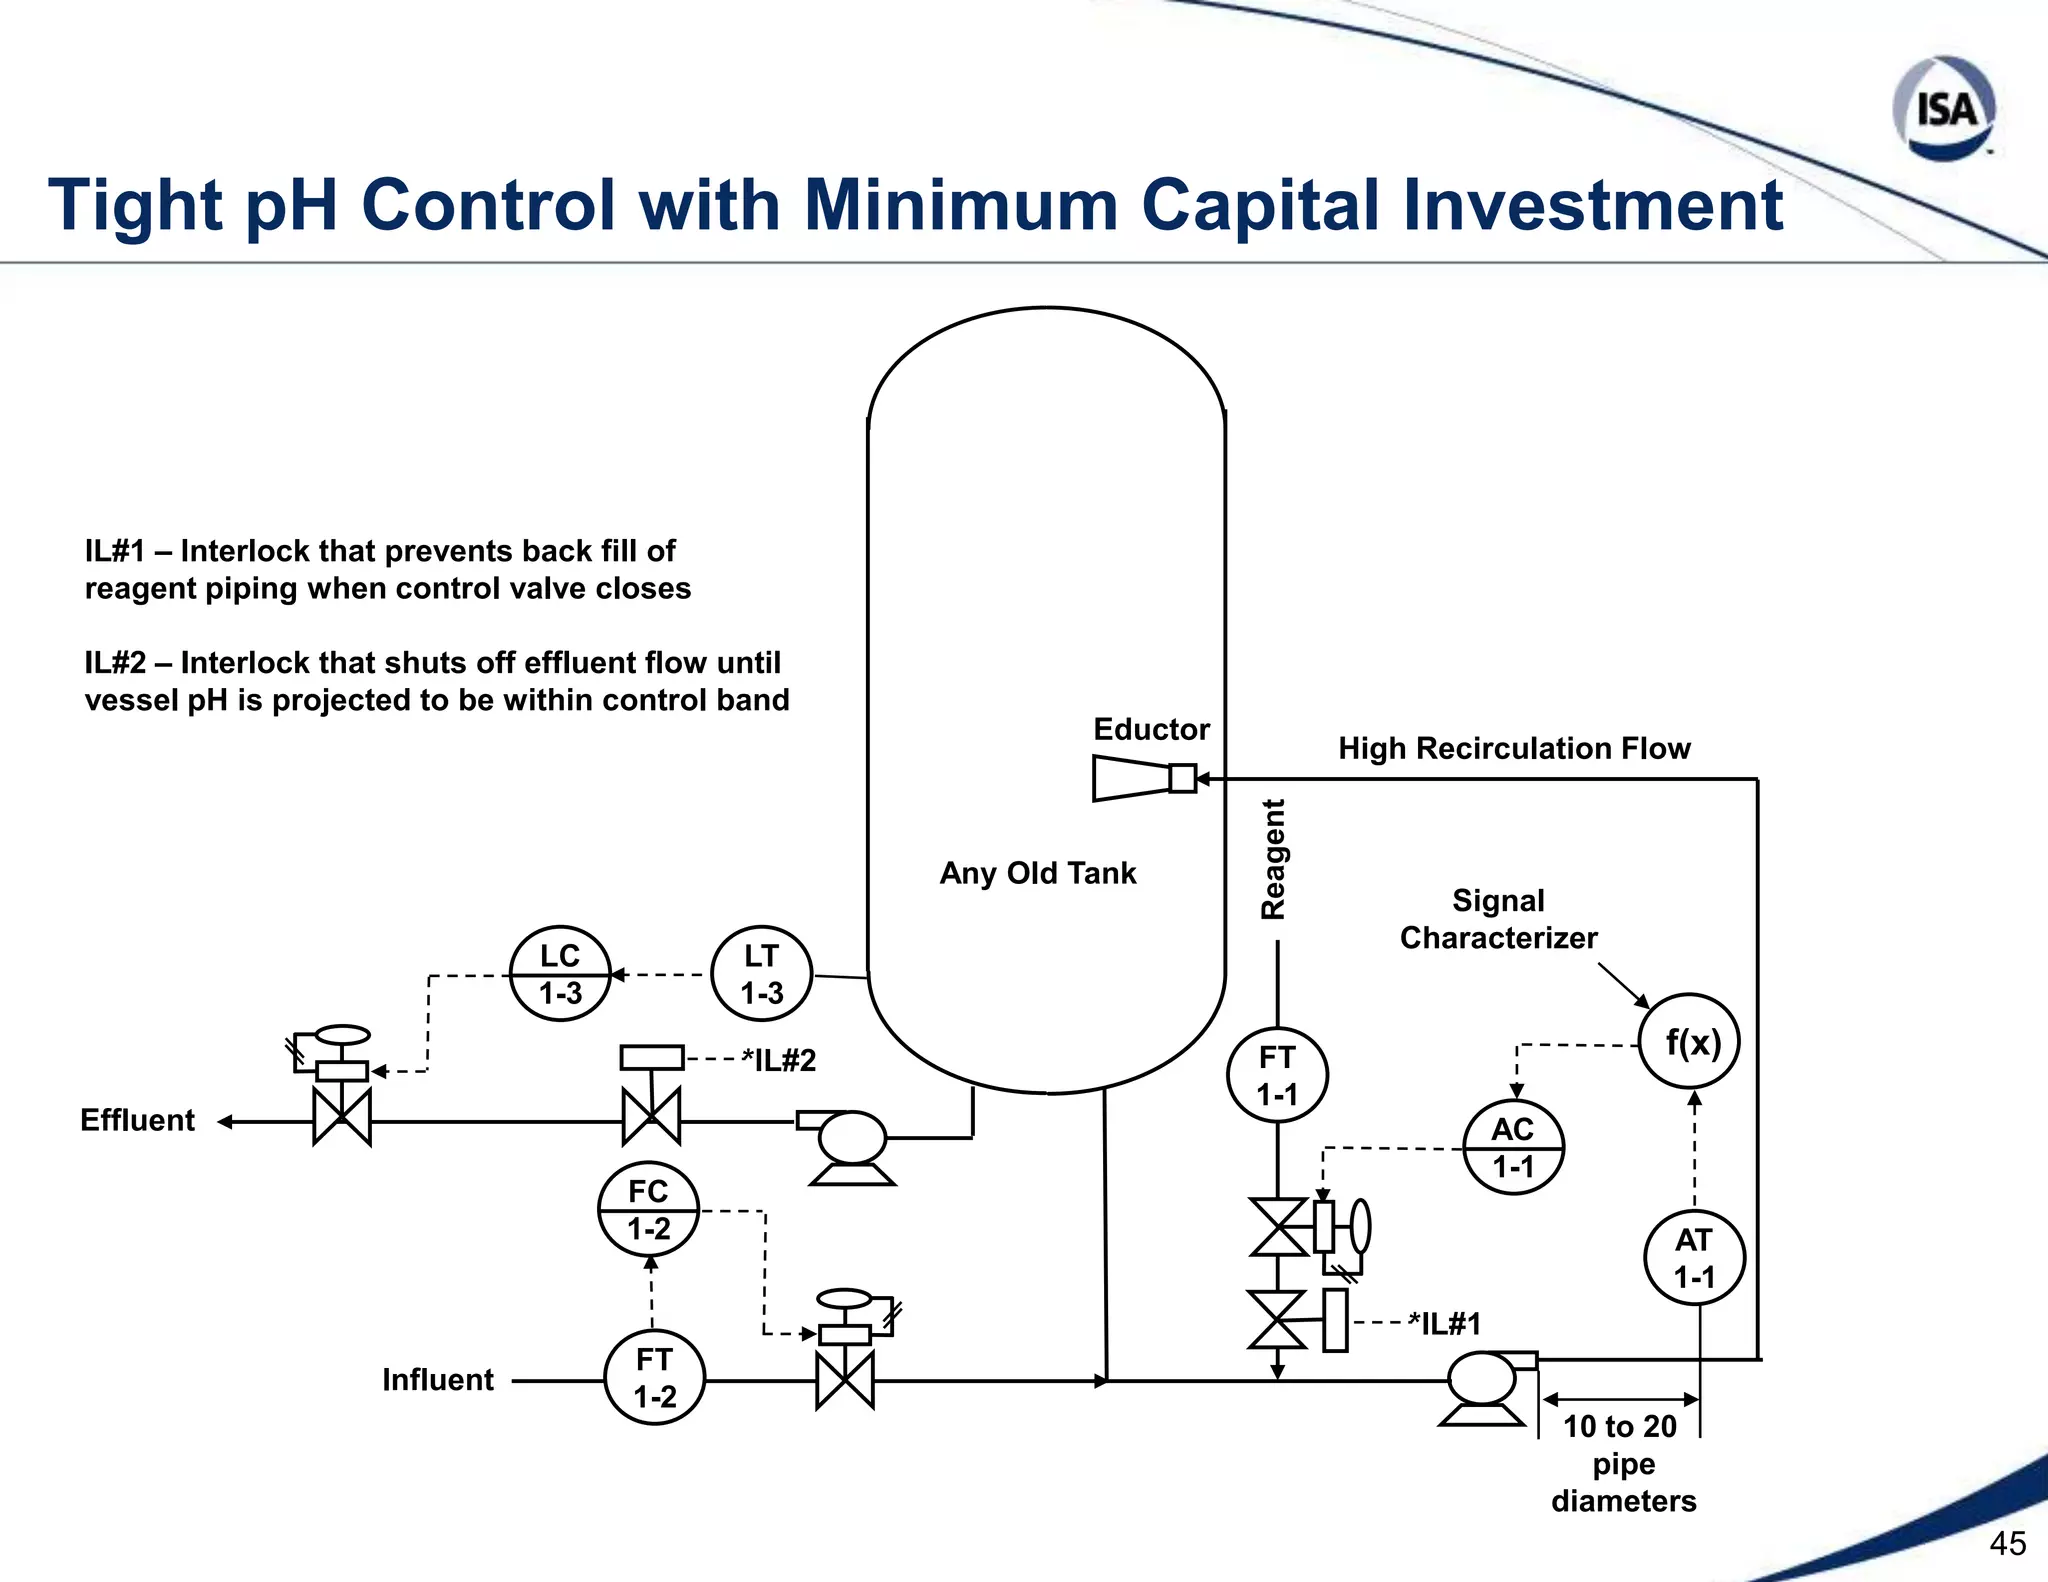
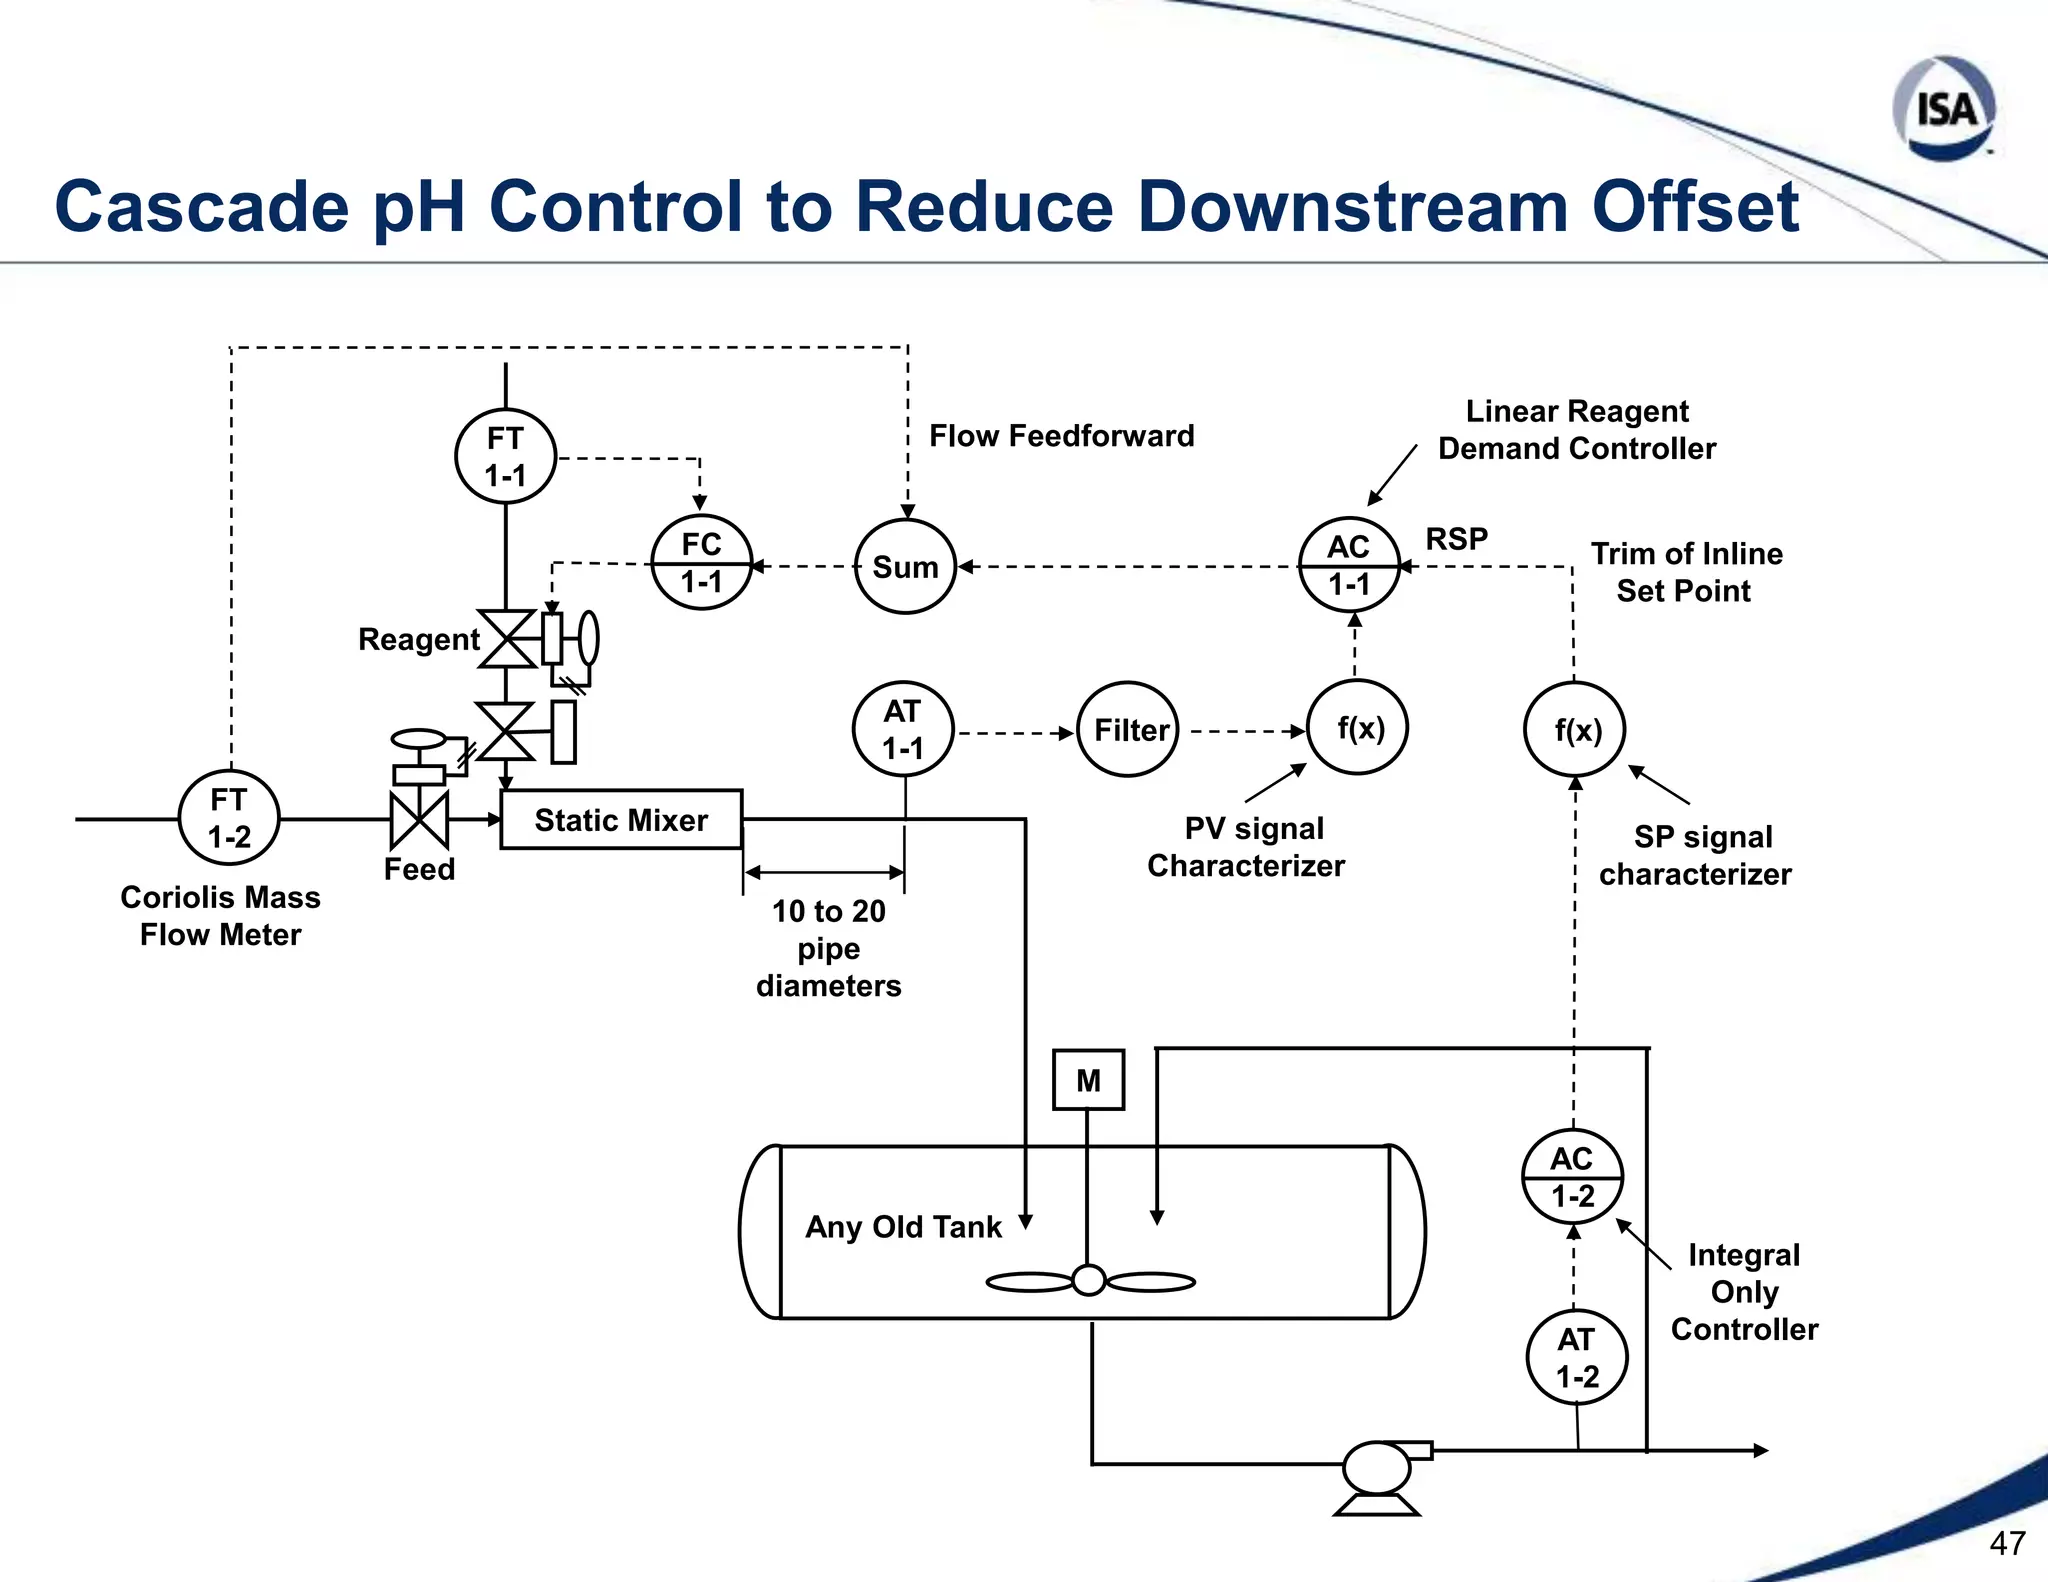
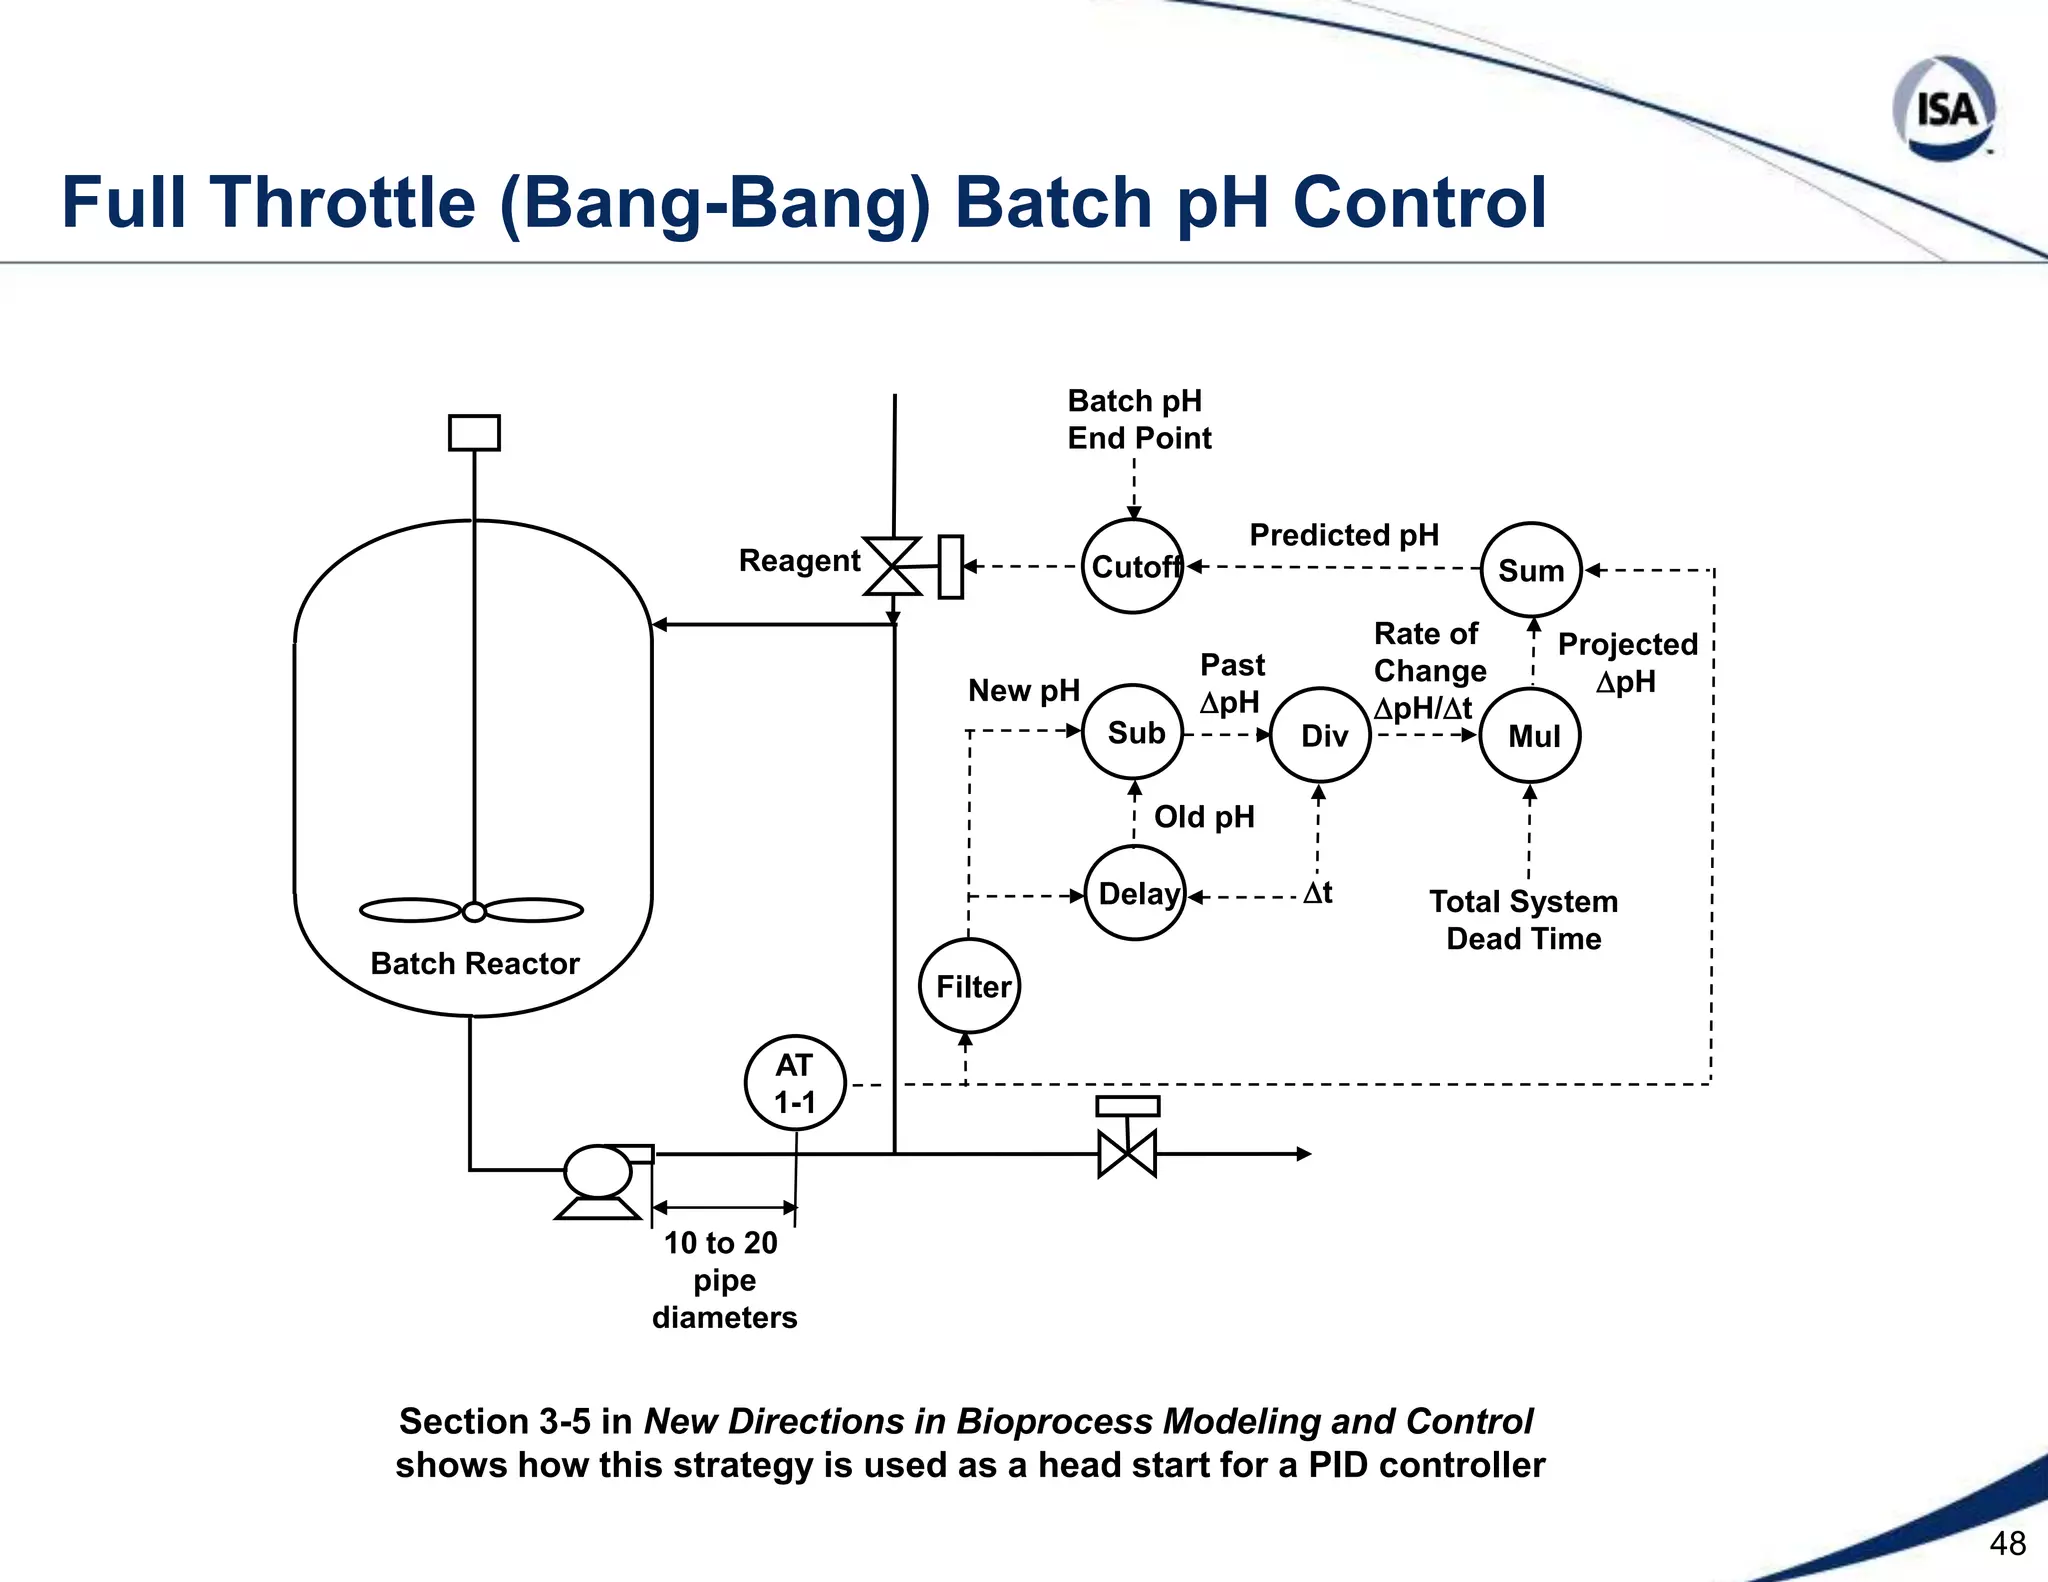
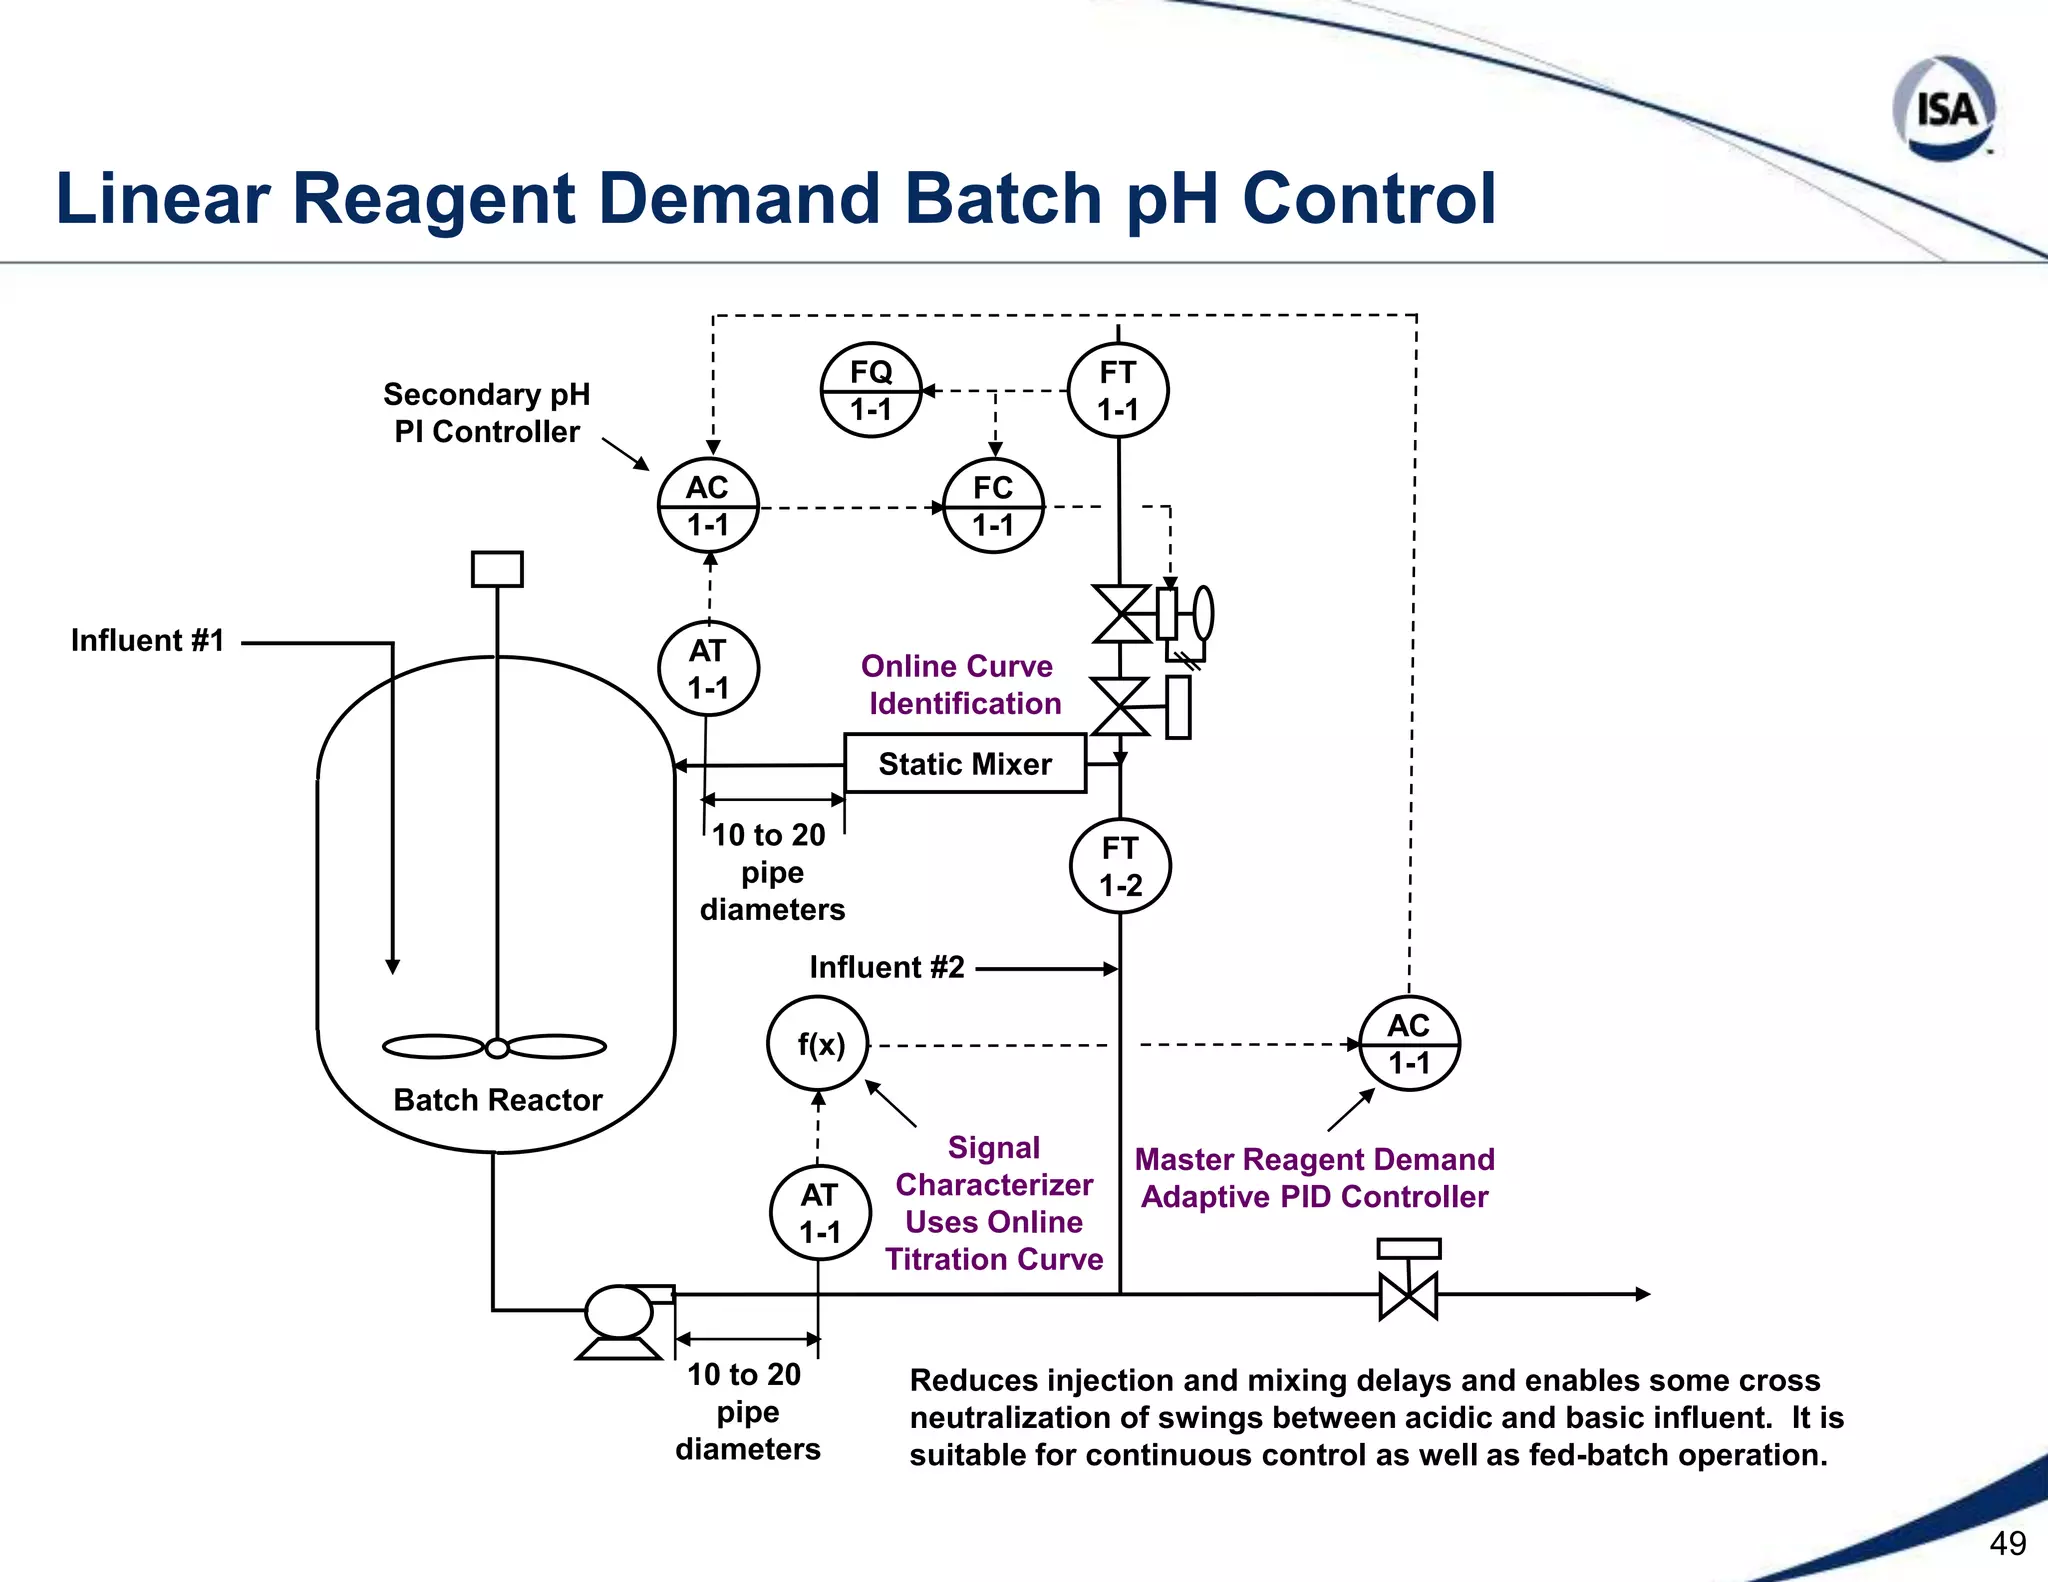
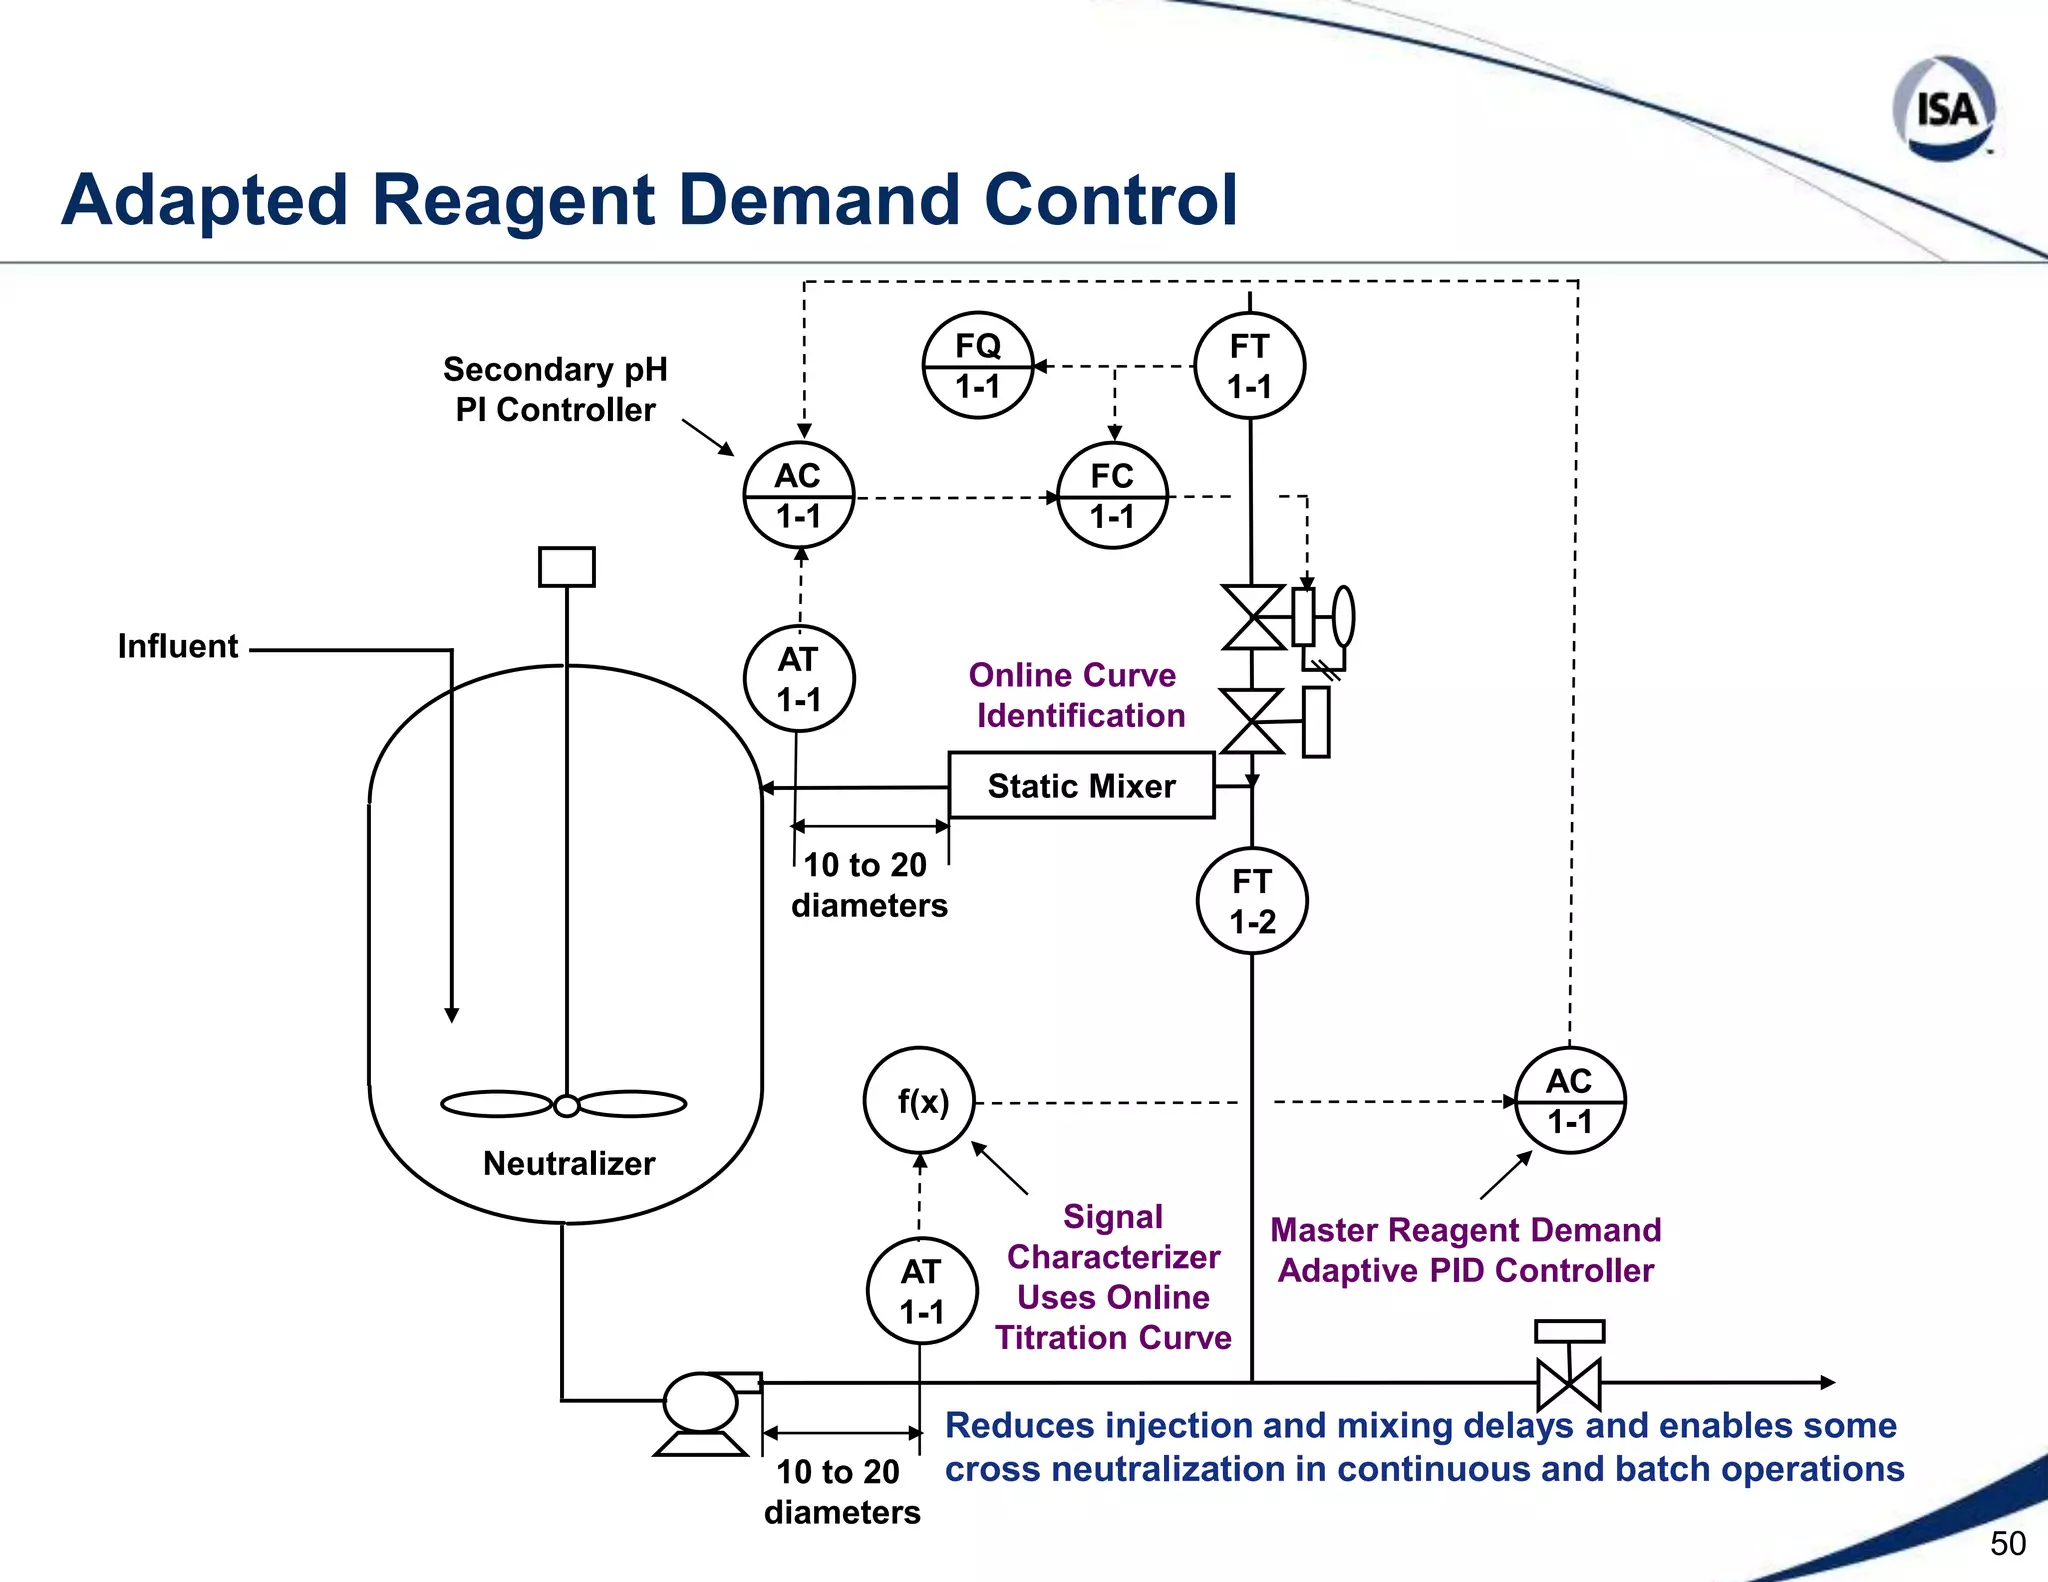
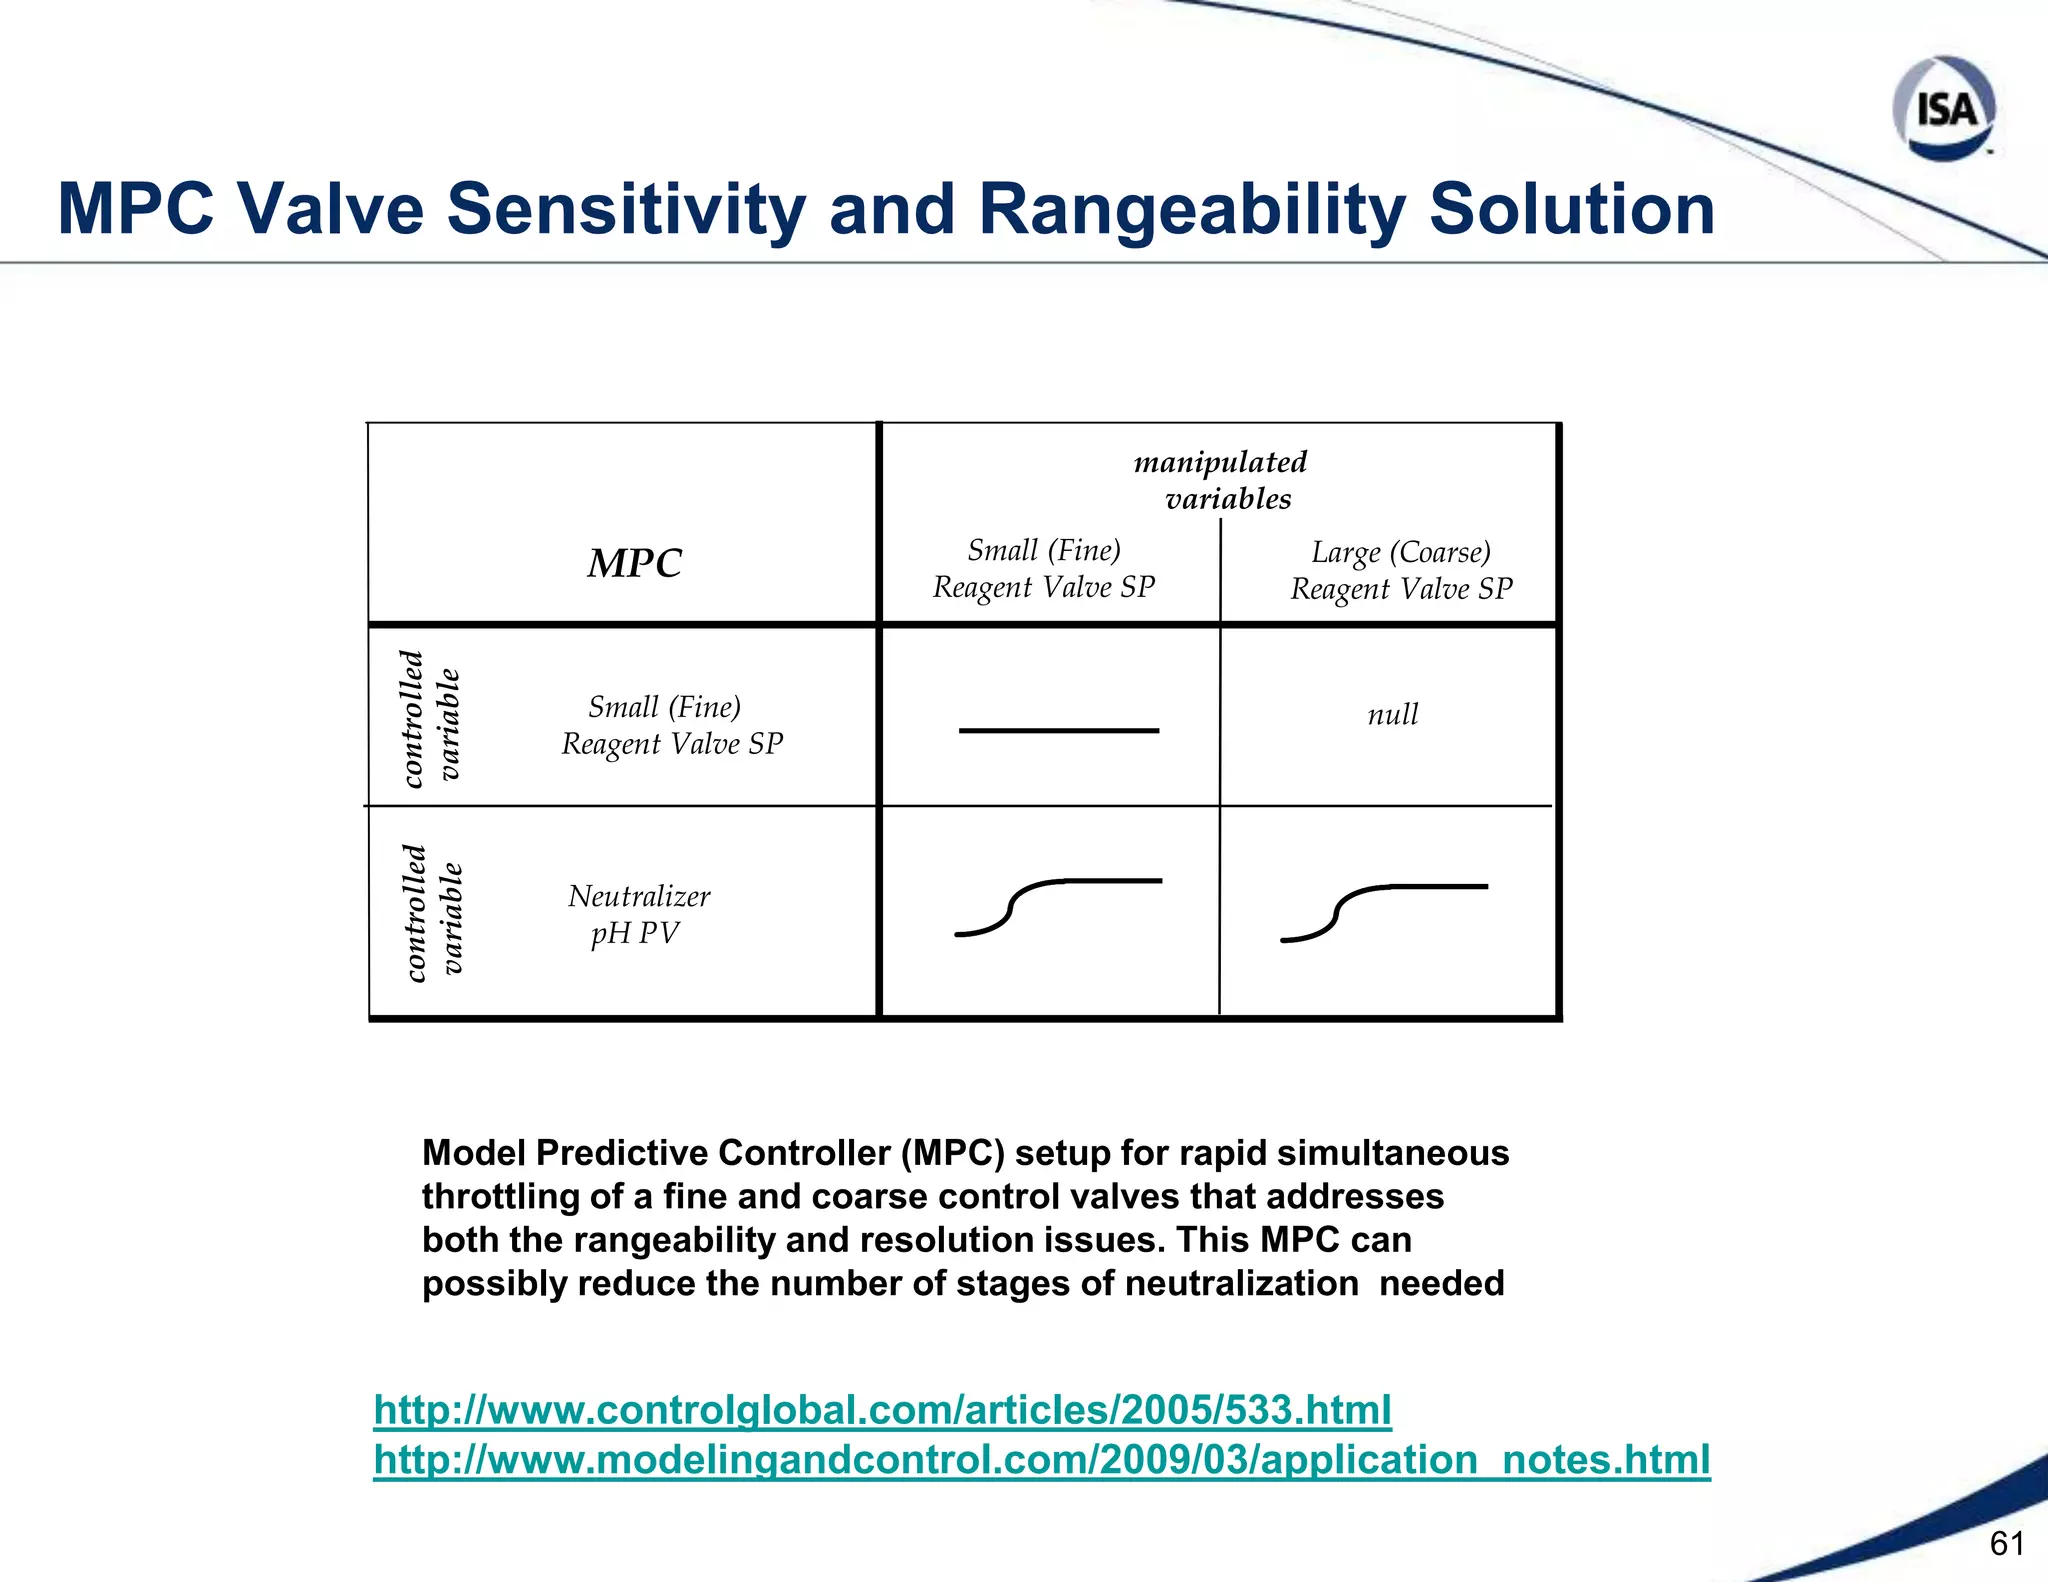
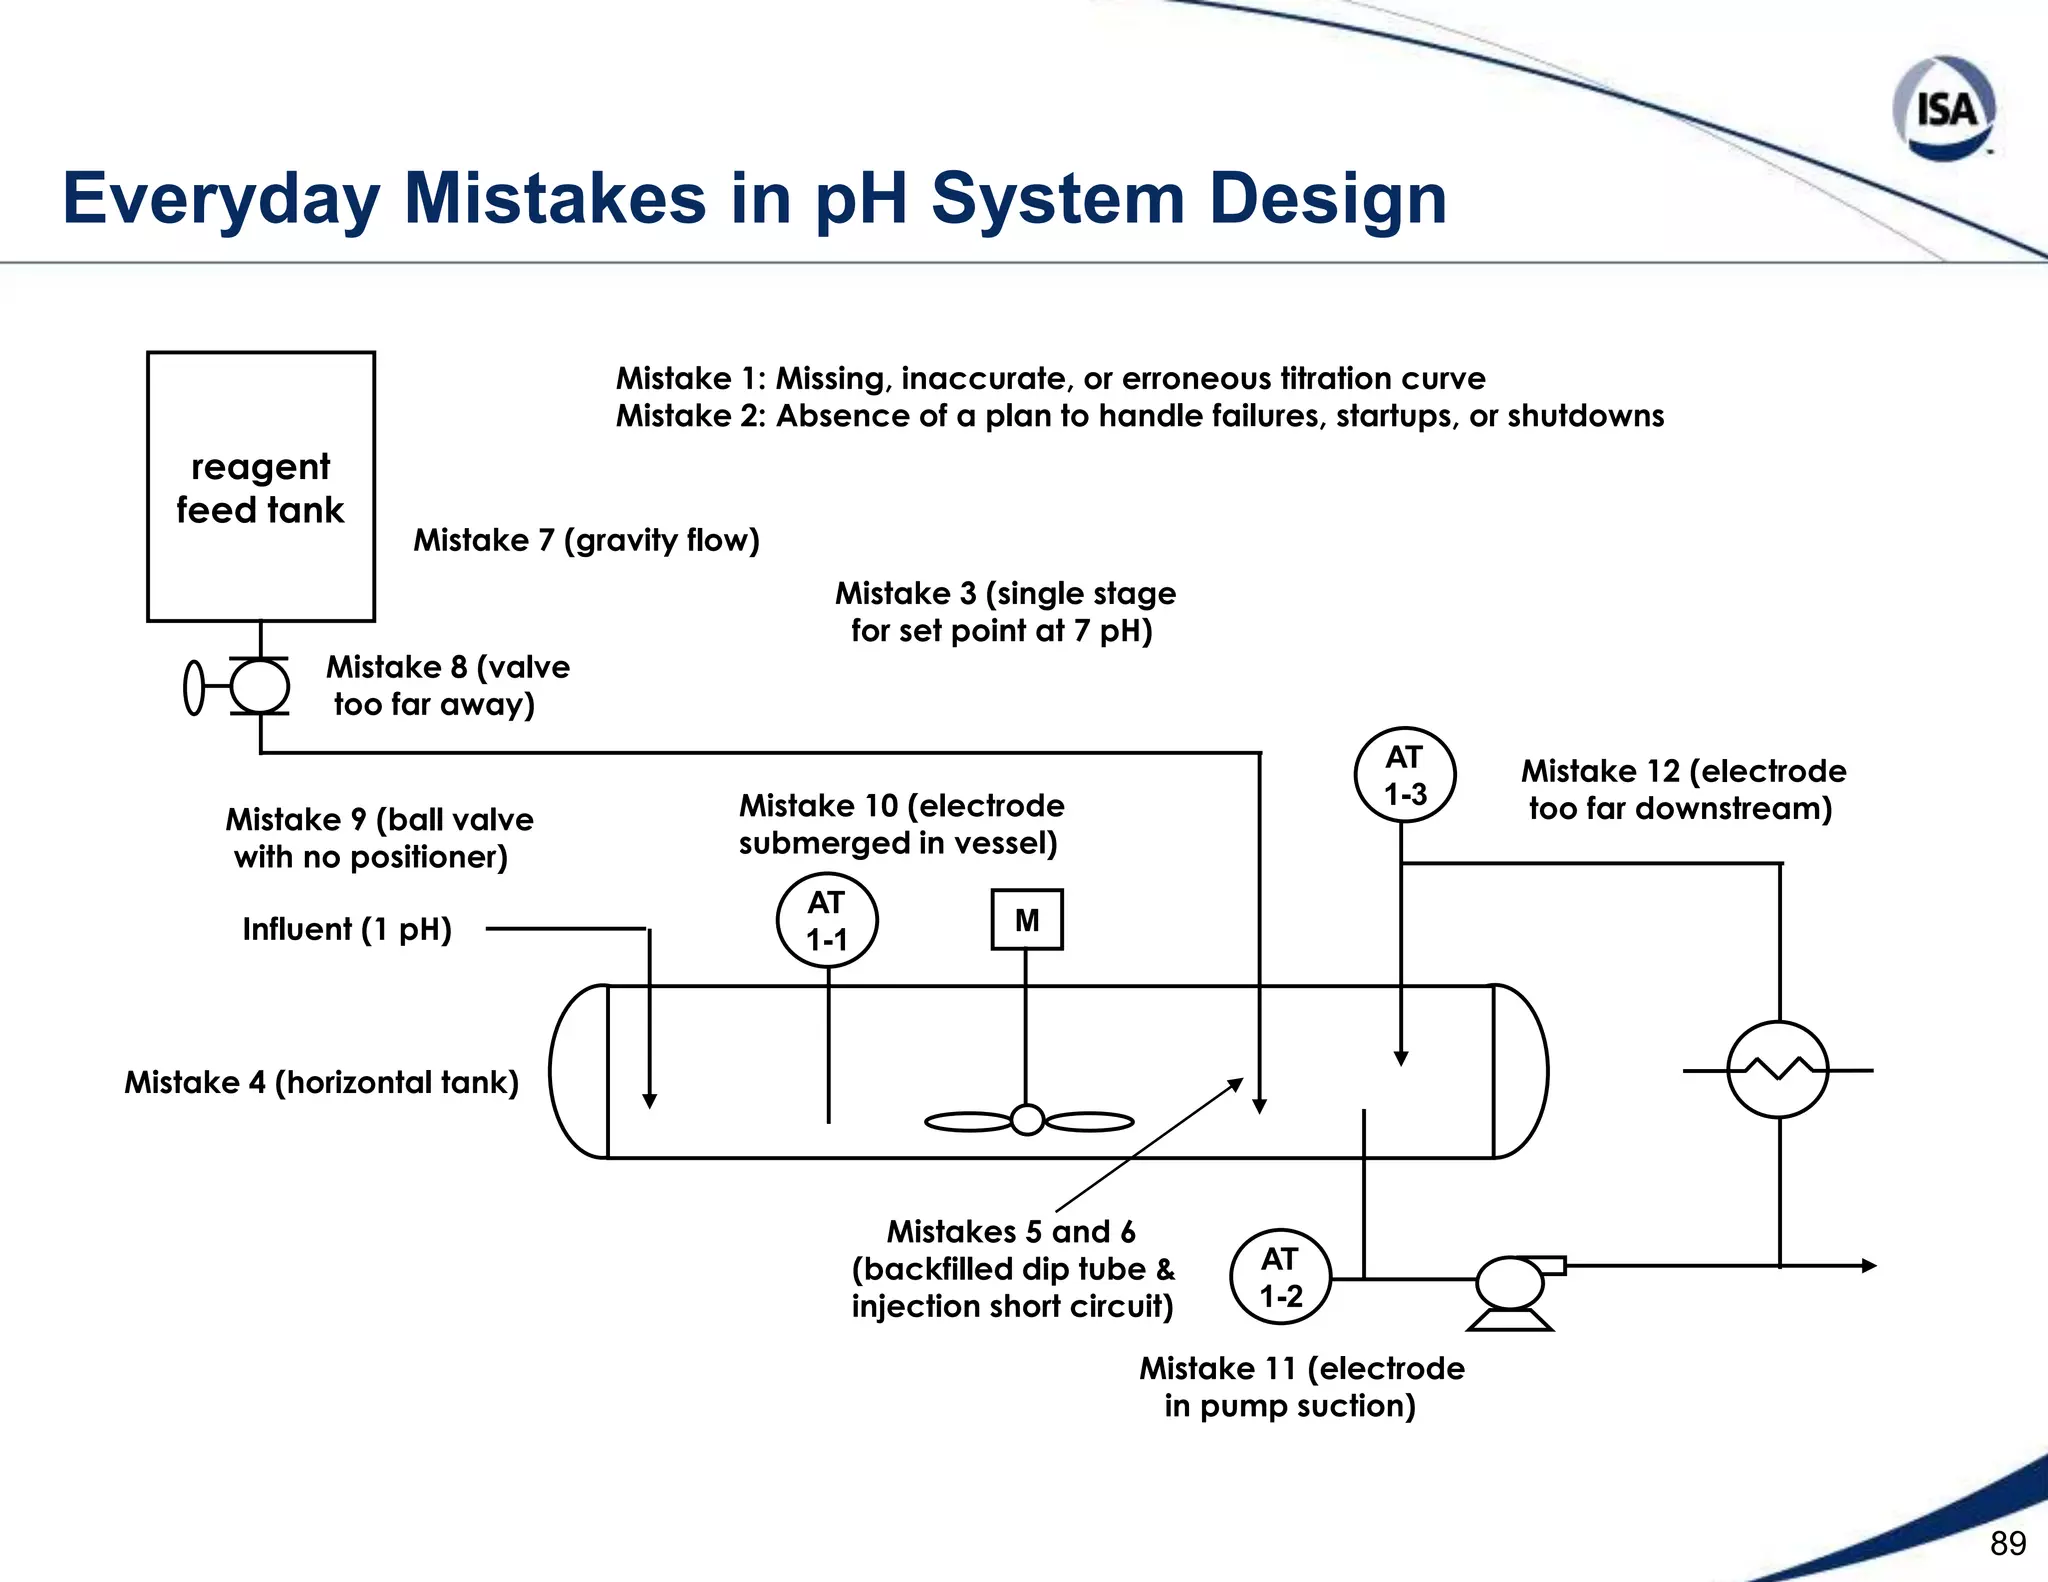
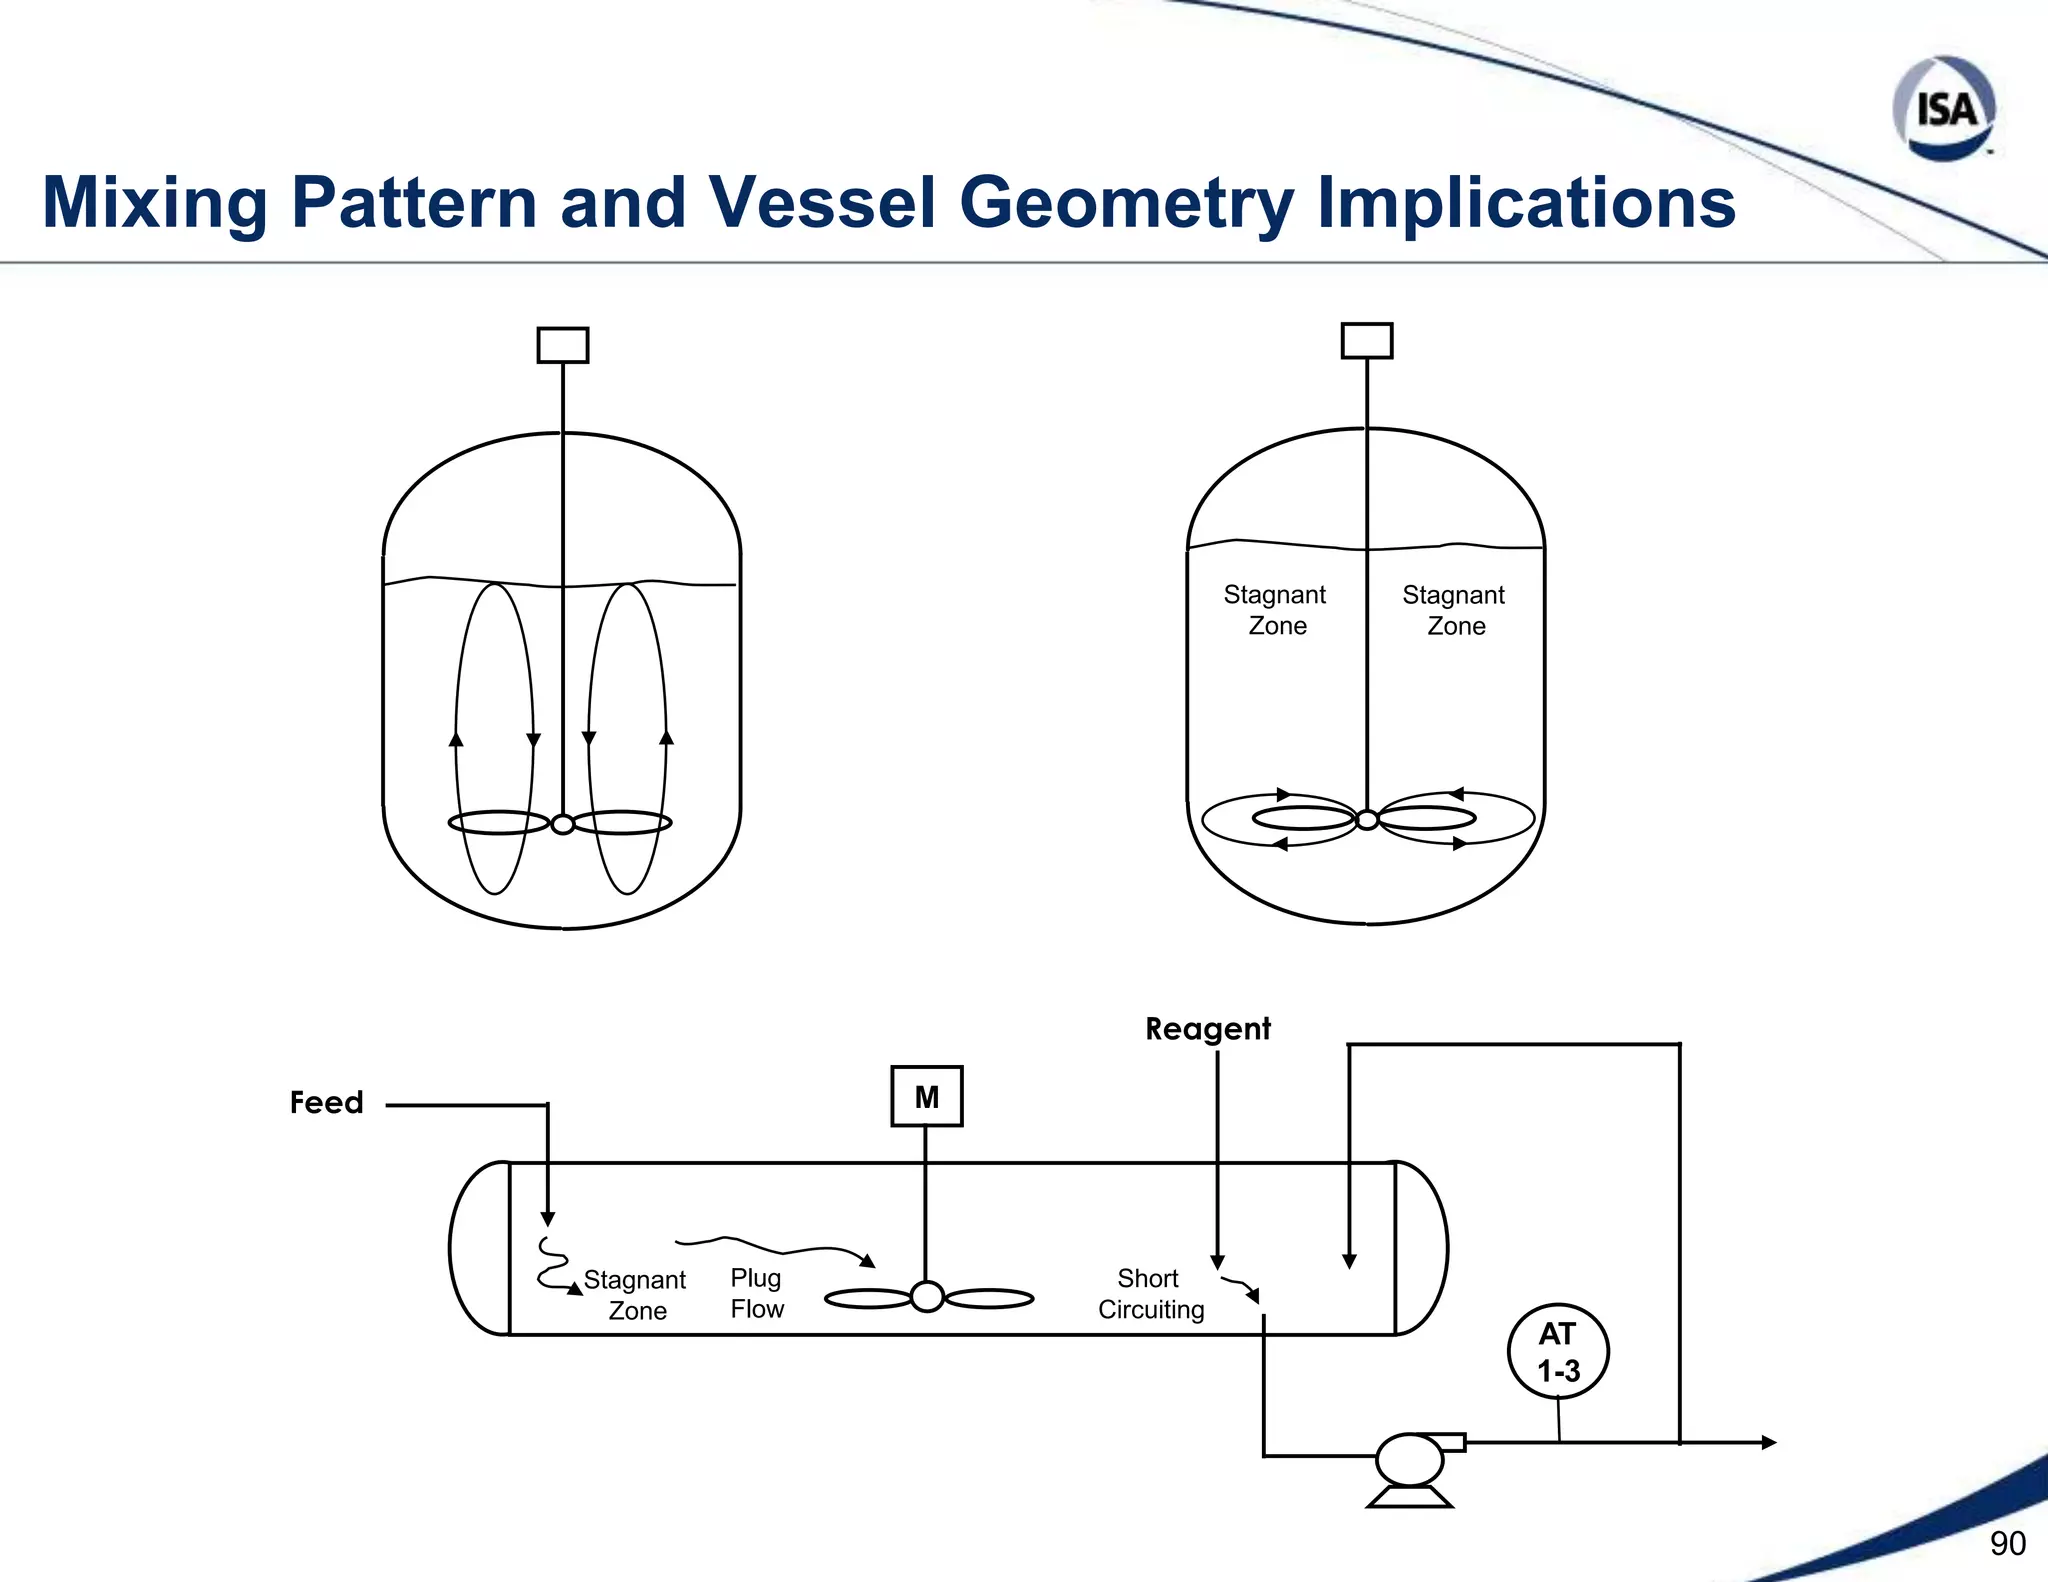
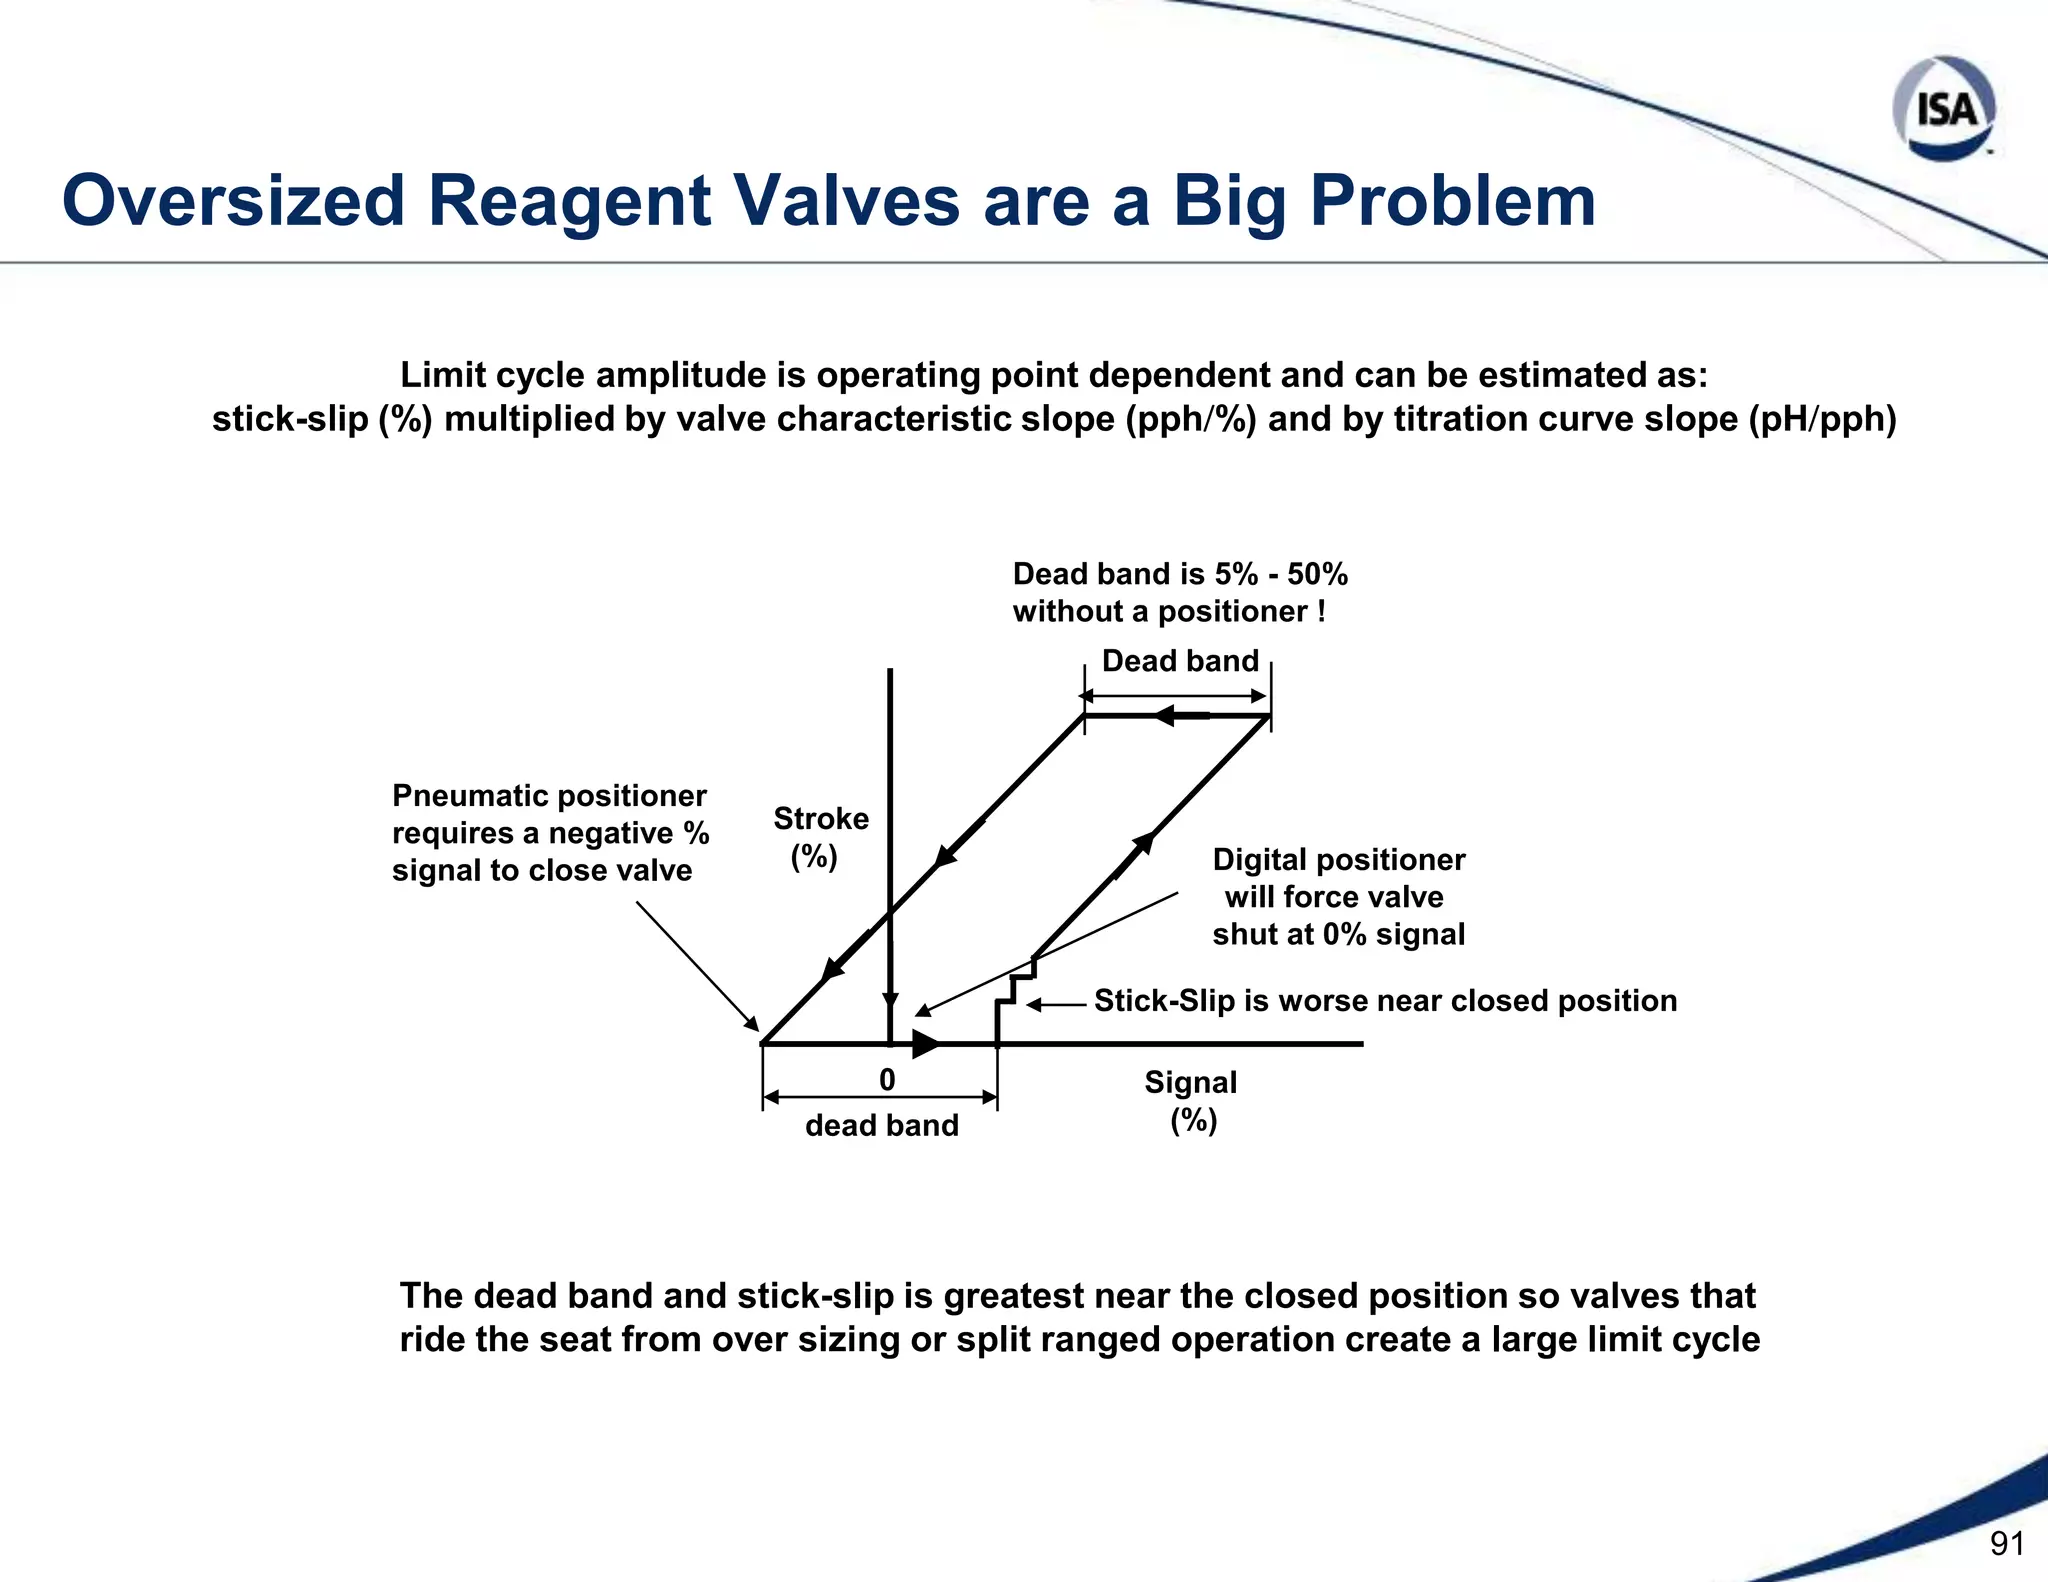

The document discusses pH control solutions and key considerations for pH measurement and control. It notes that pH control presents extraordinary challenges due to the extreme sensitivity and nonlinearity of pH measurements. Proper configuration of measurement equipment and control strategies are required to account for factors like temperature effects, sensor drift, and nonlinear titration curves. The document also highlights important valve requirements and process considerations for achieving tight pH control.