Download as PDF, PPTX
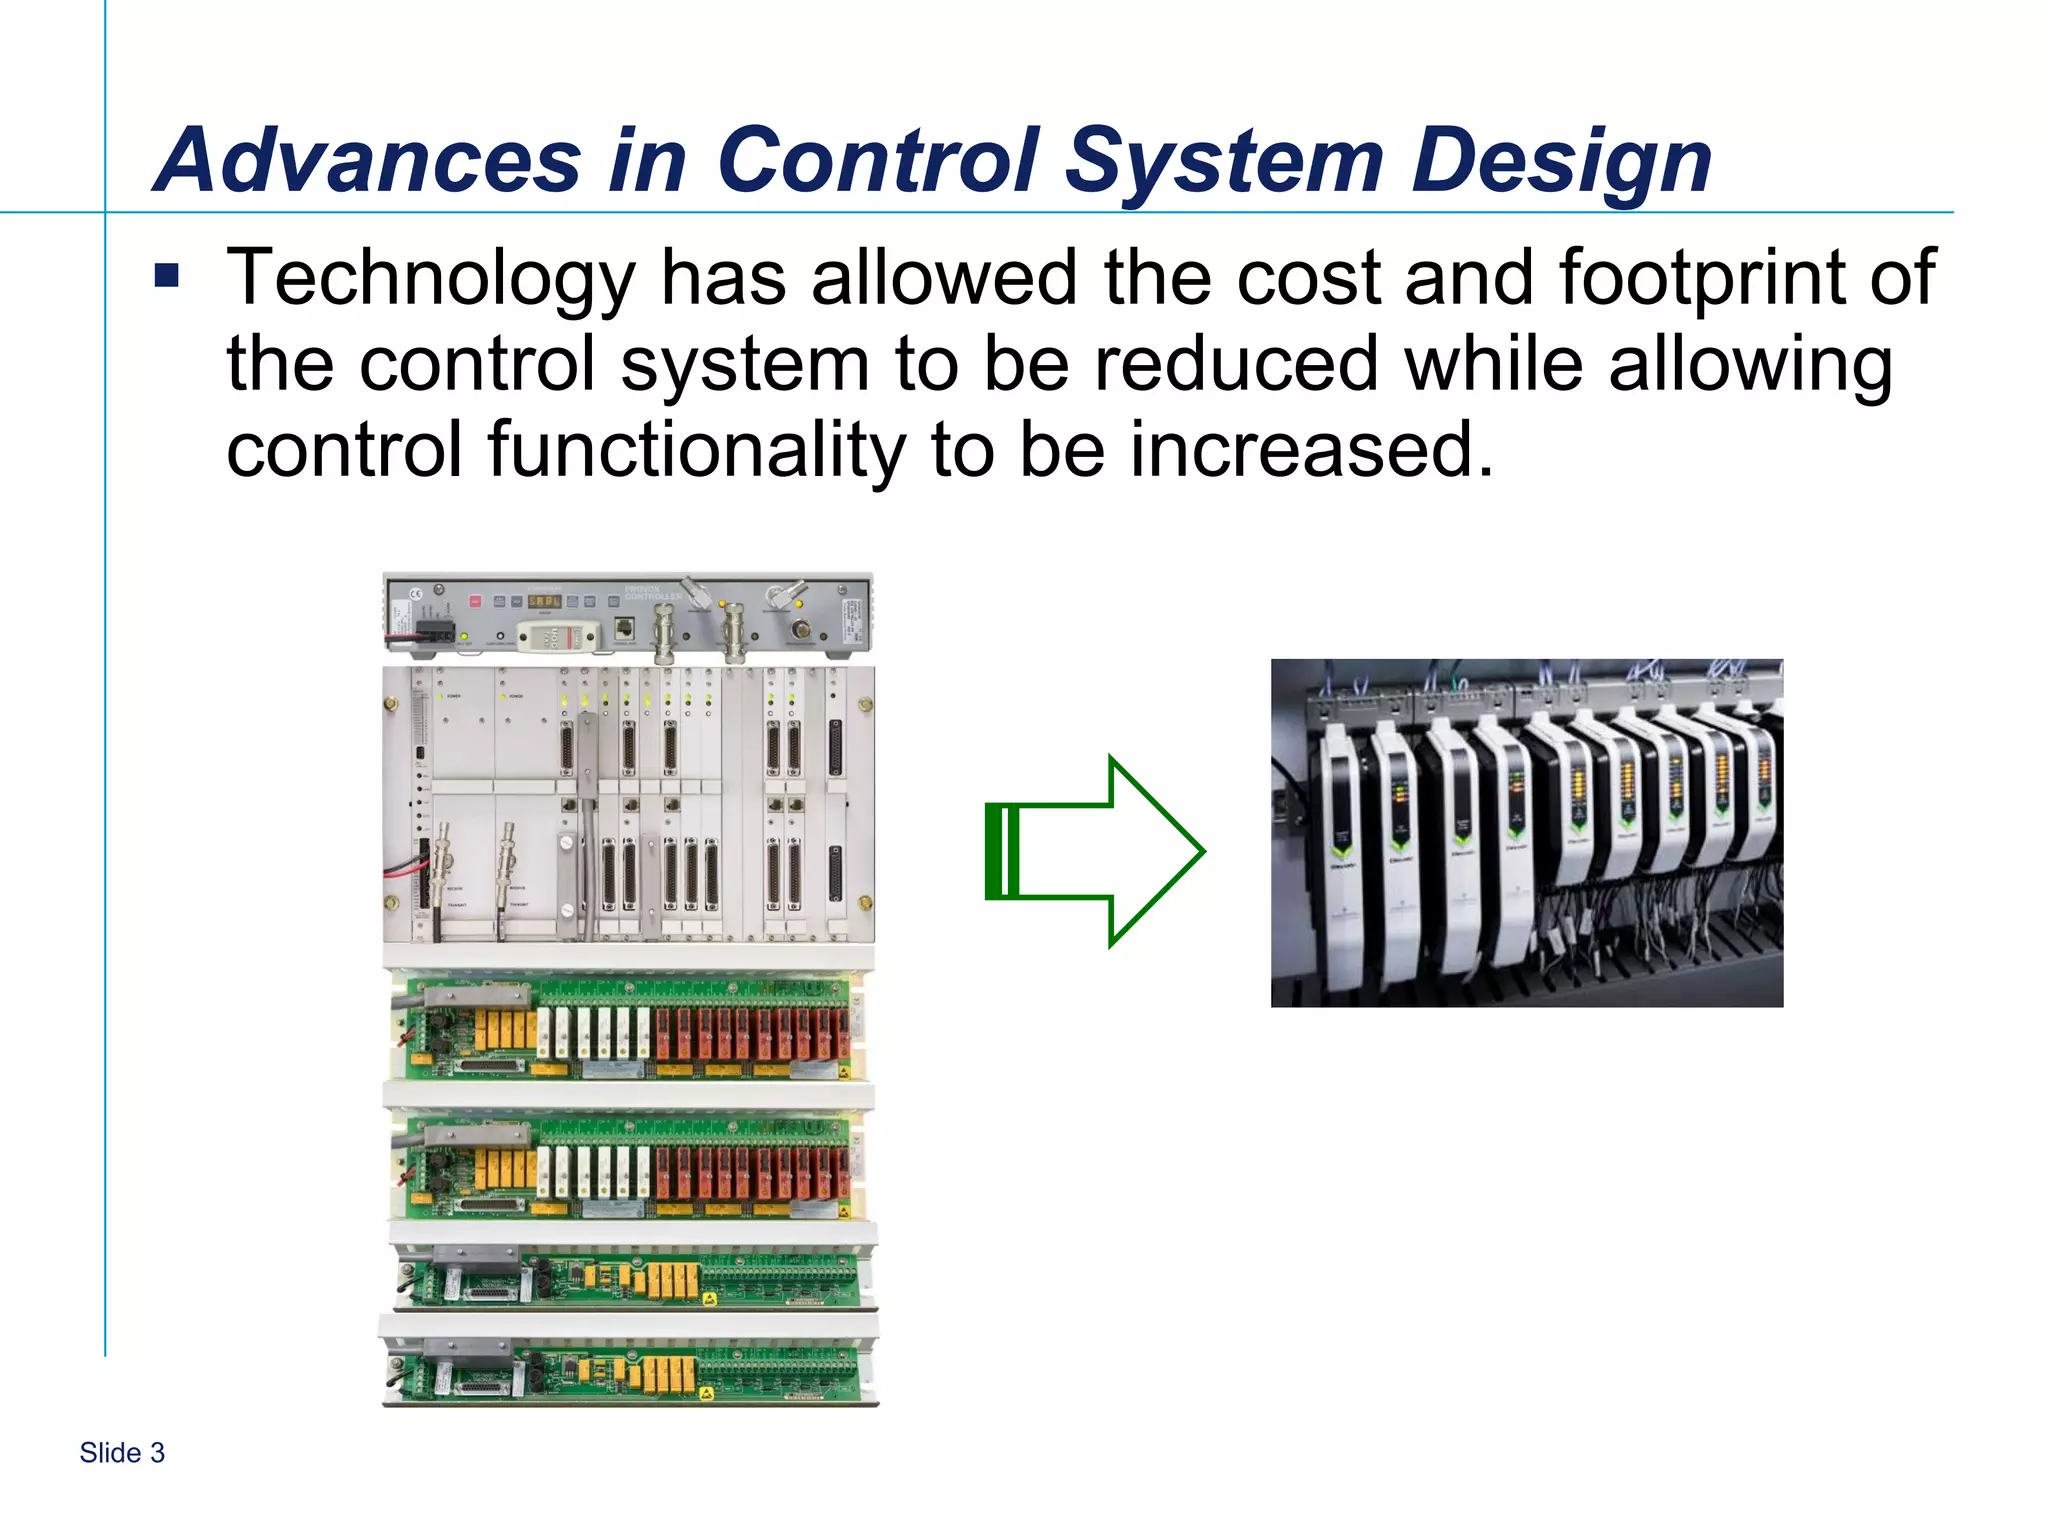
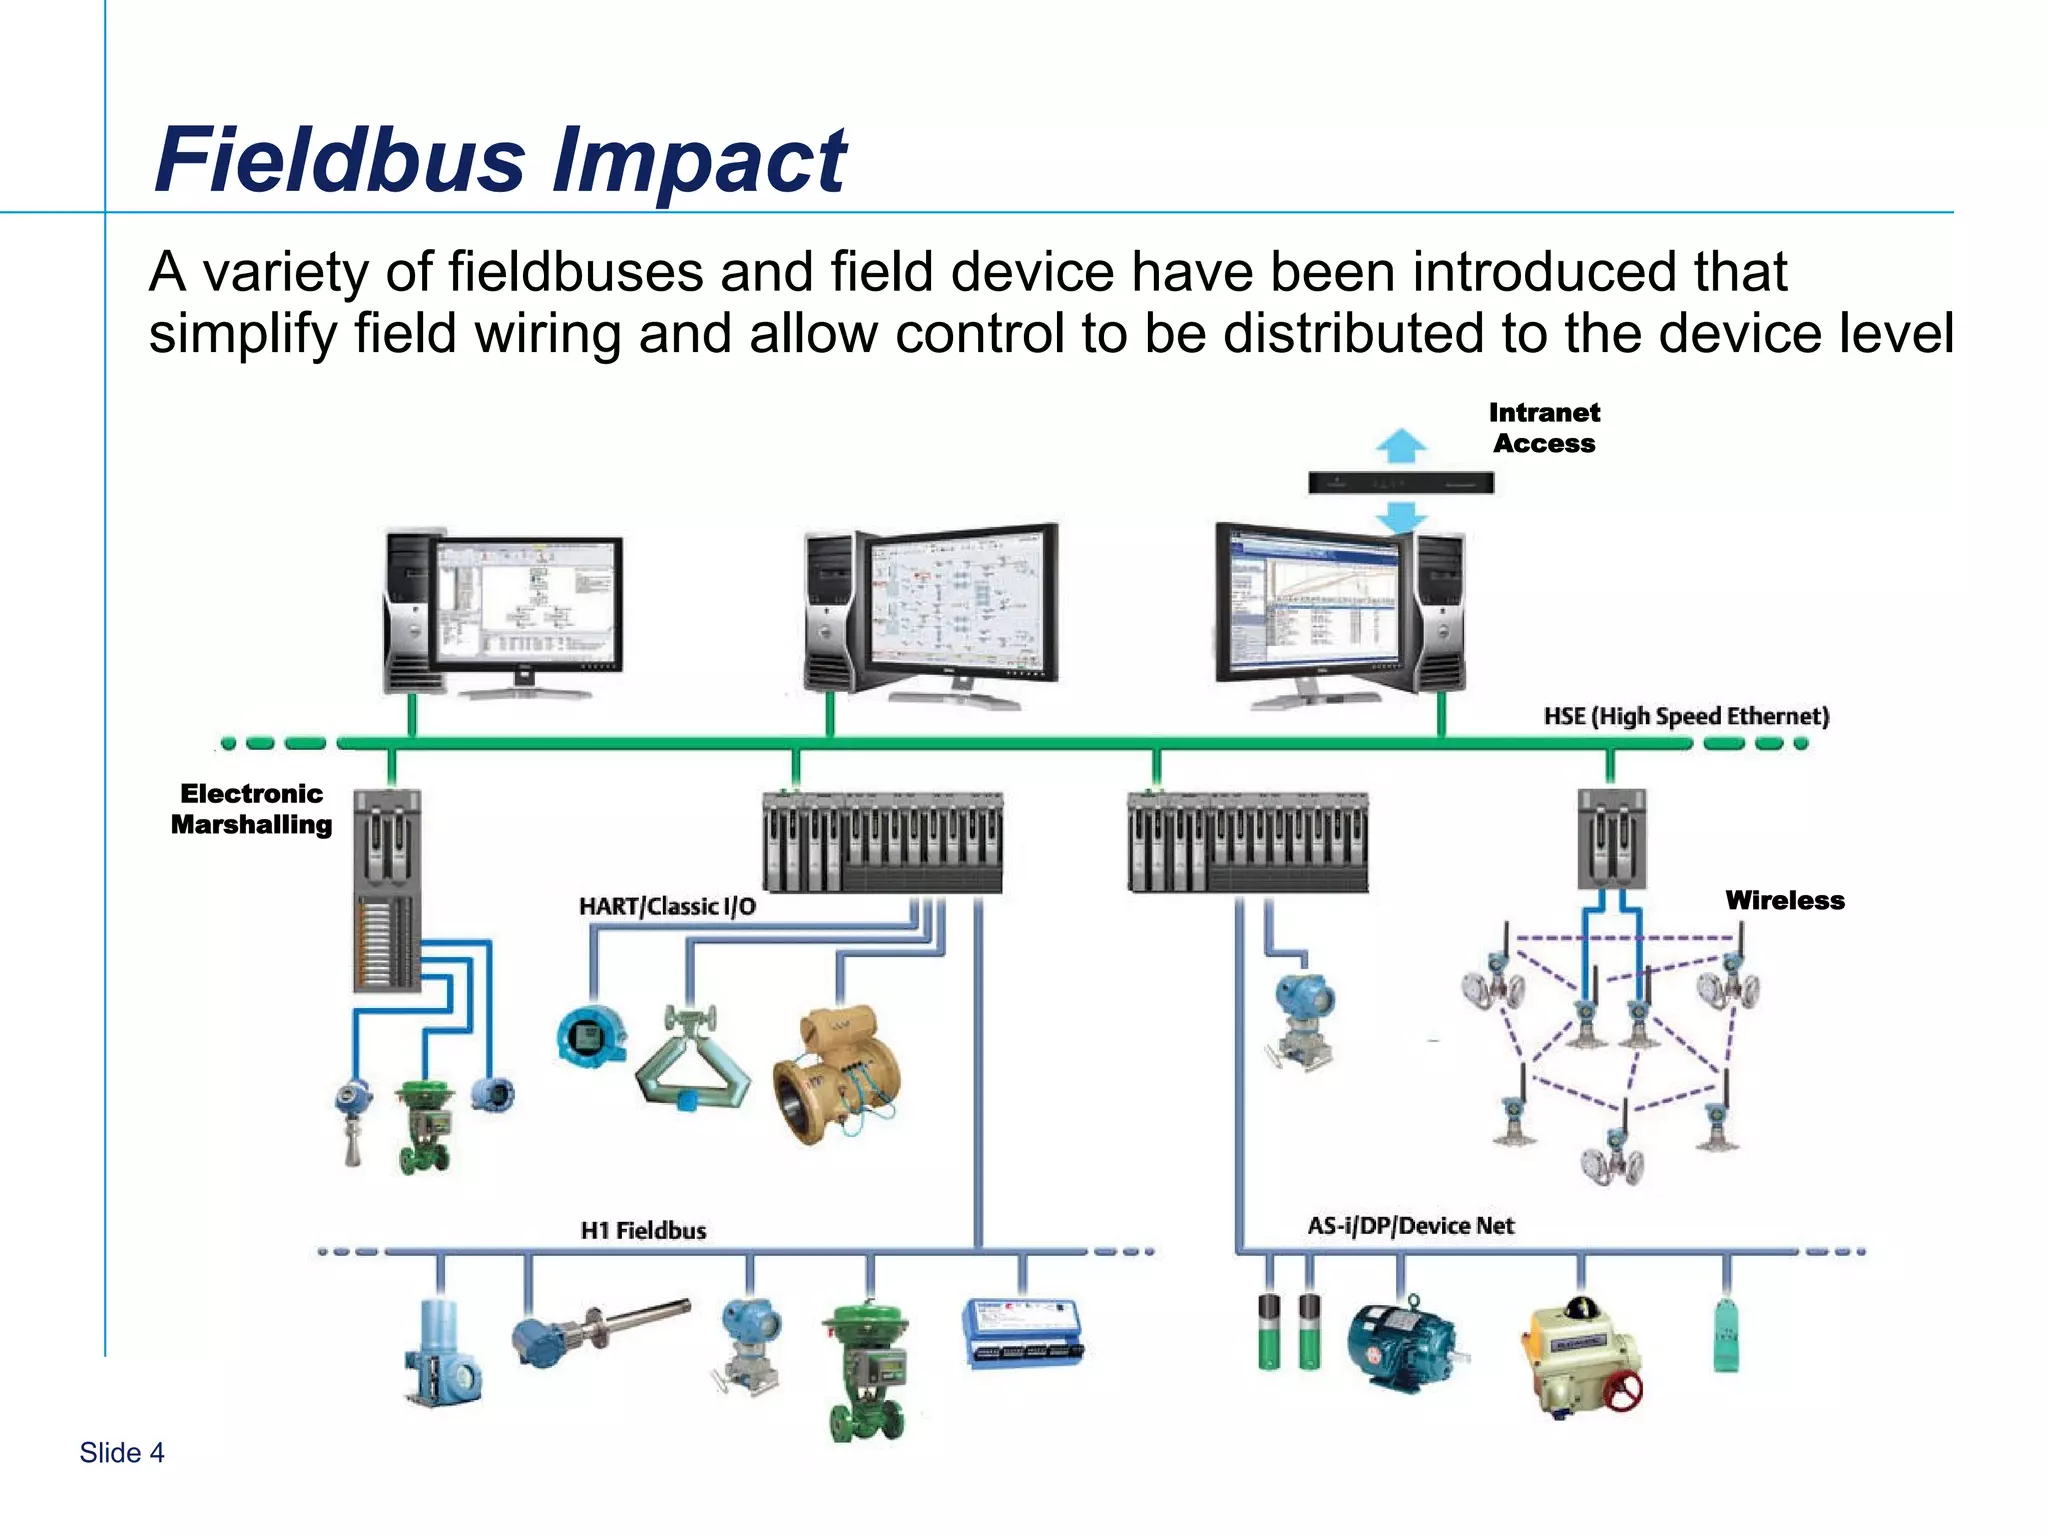
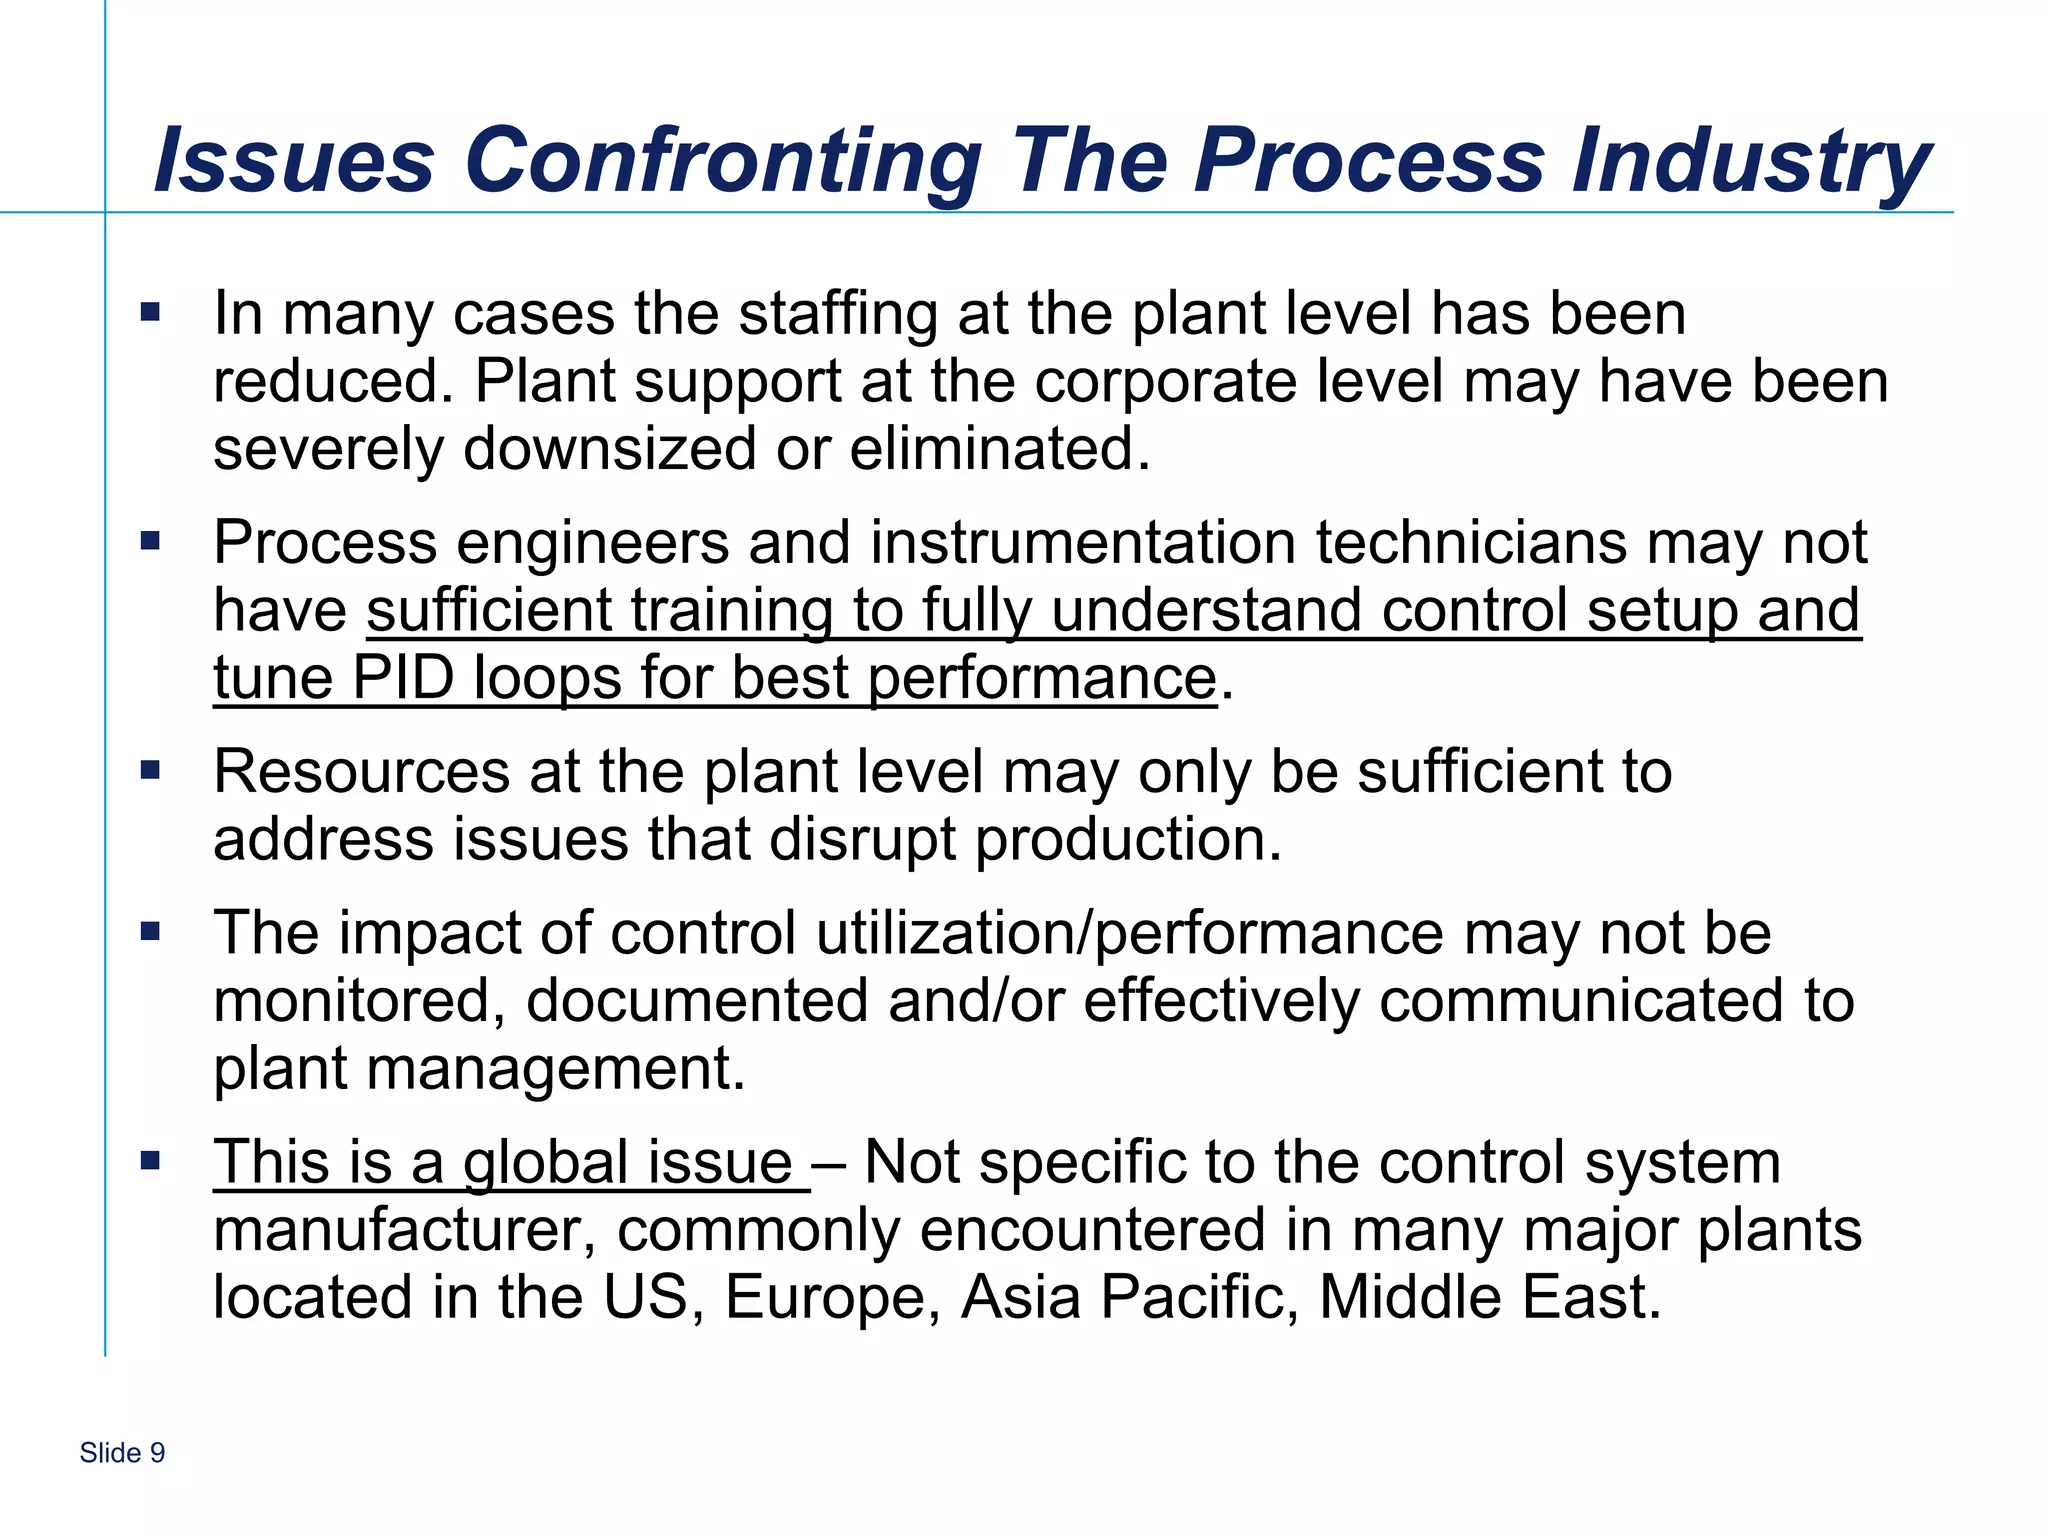
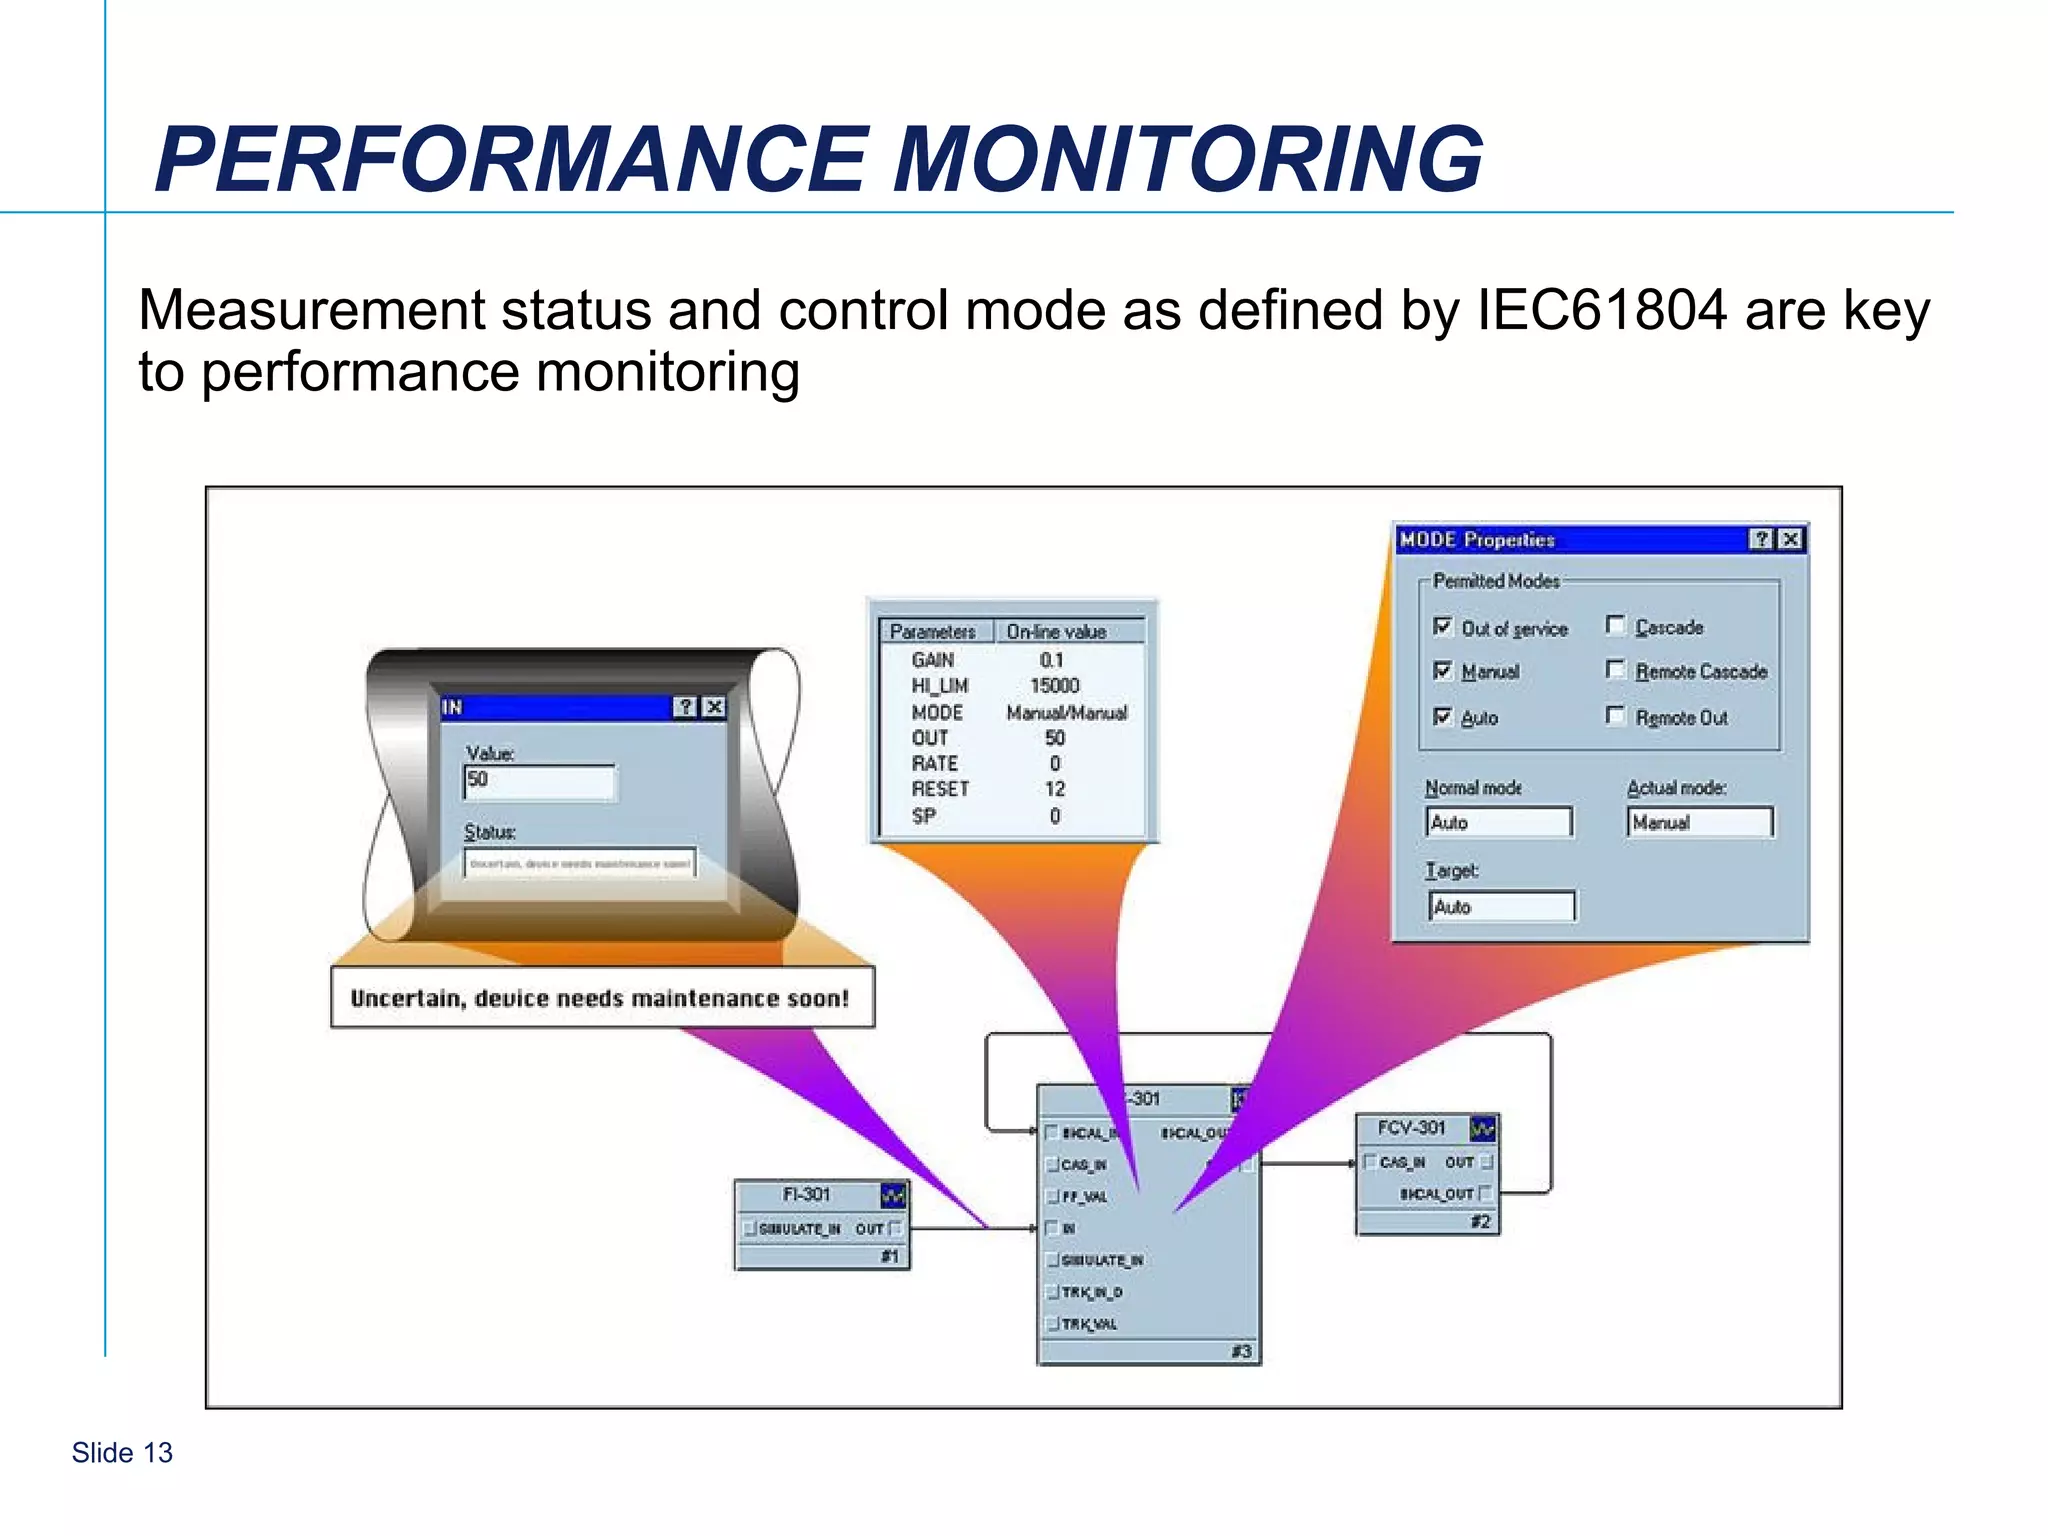
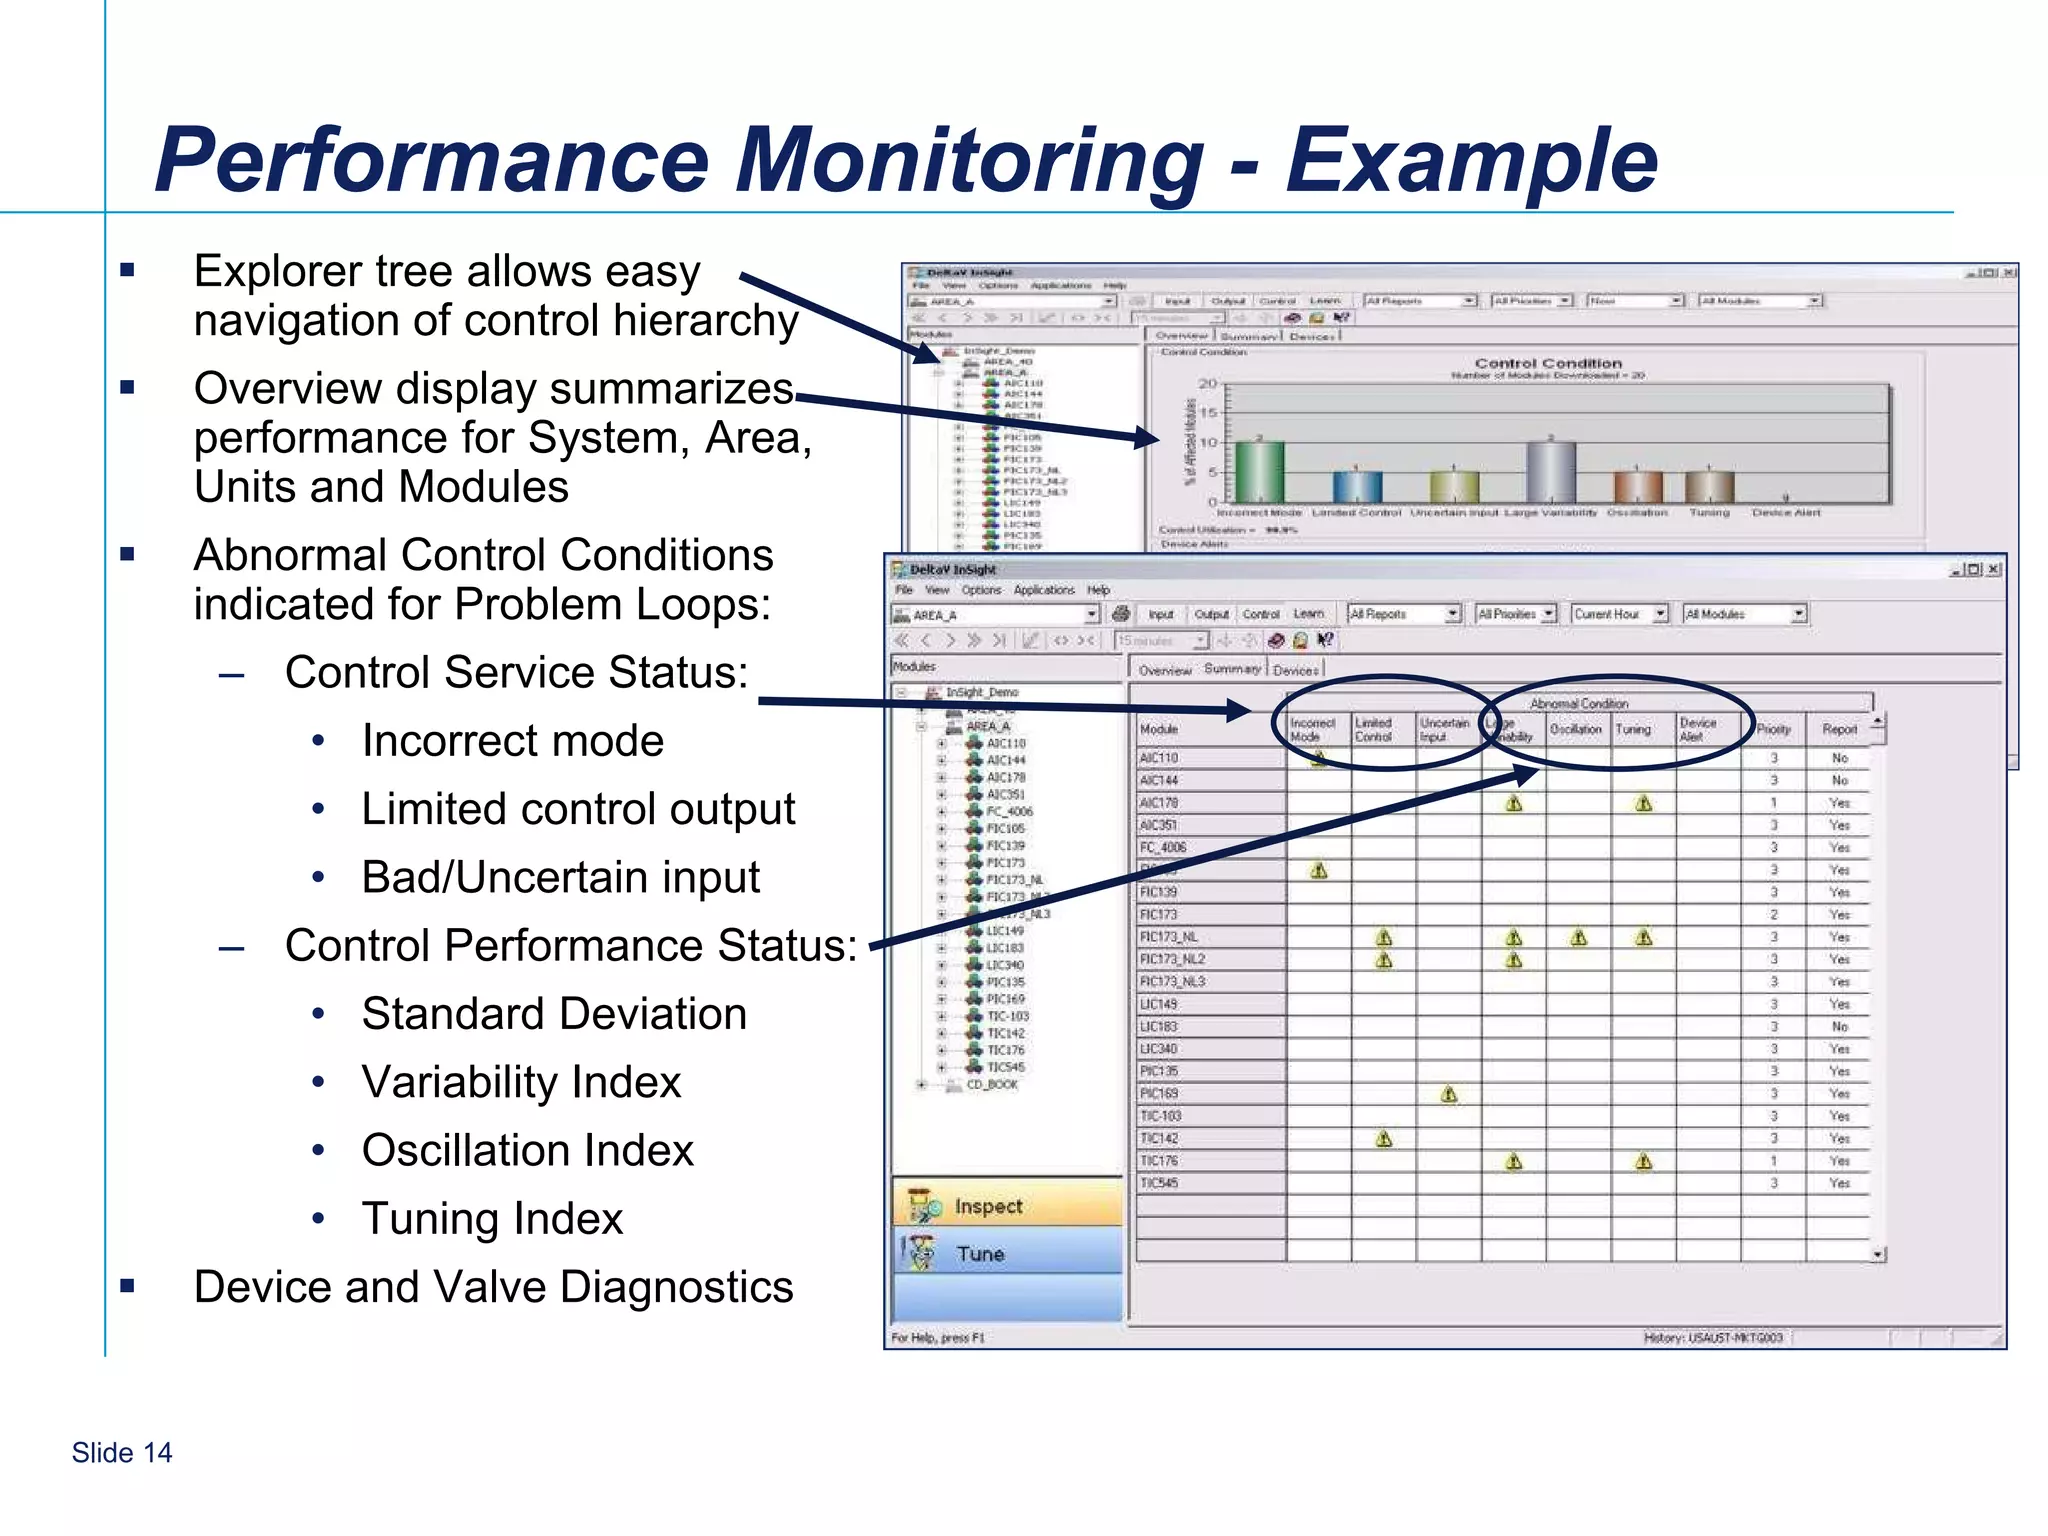
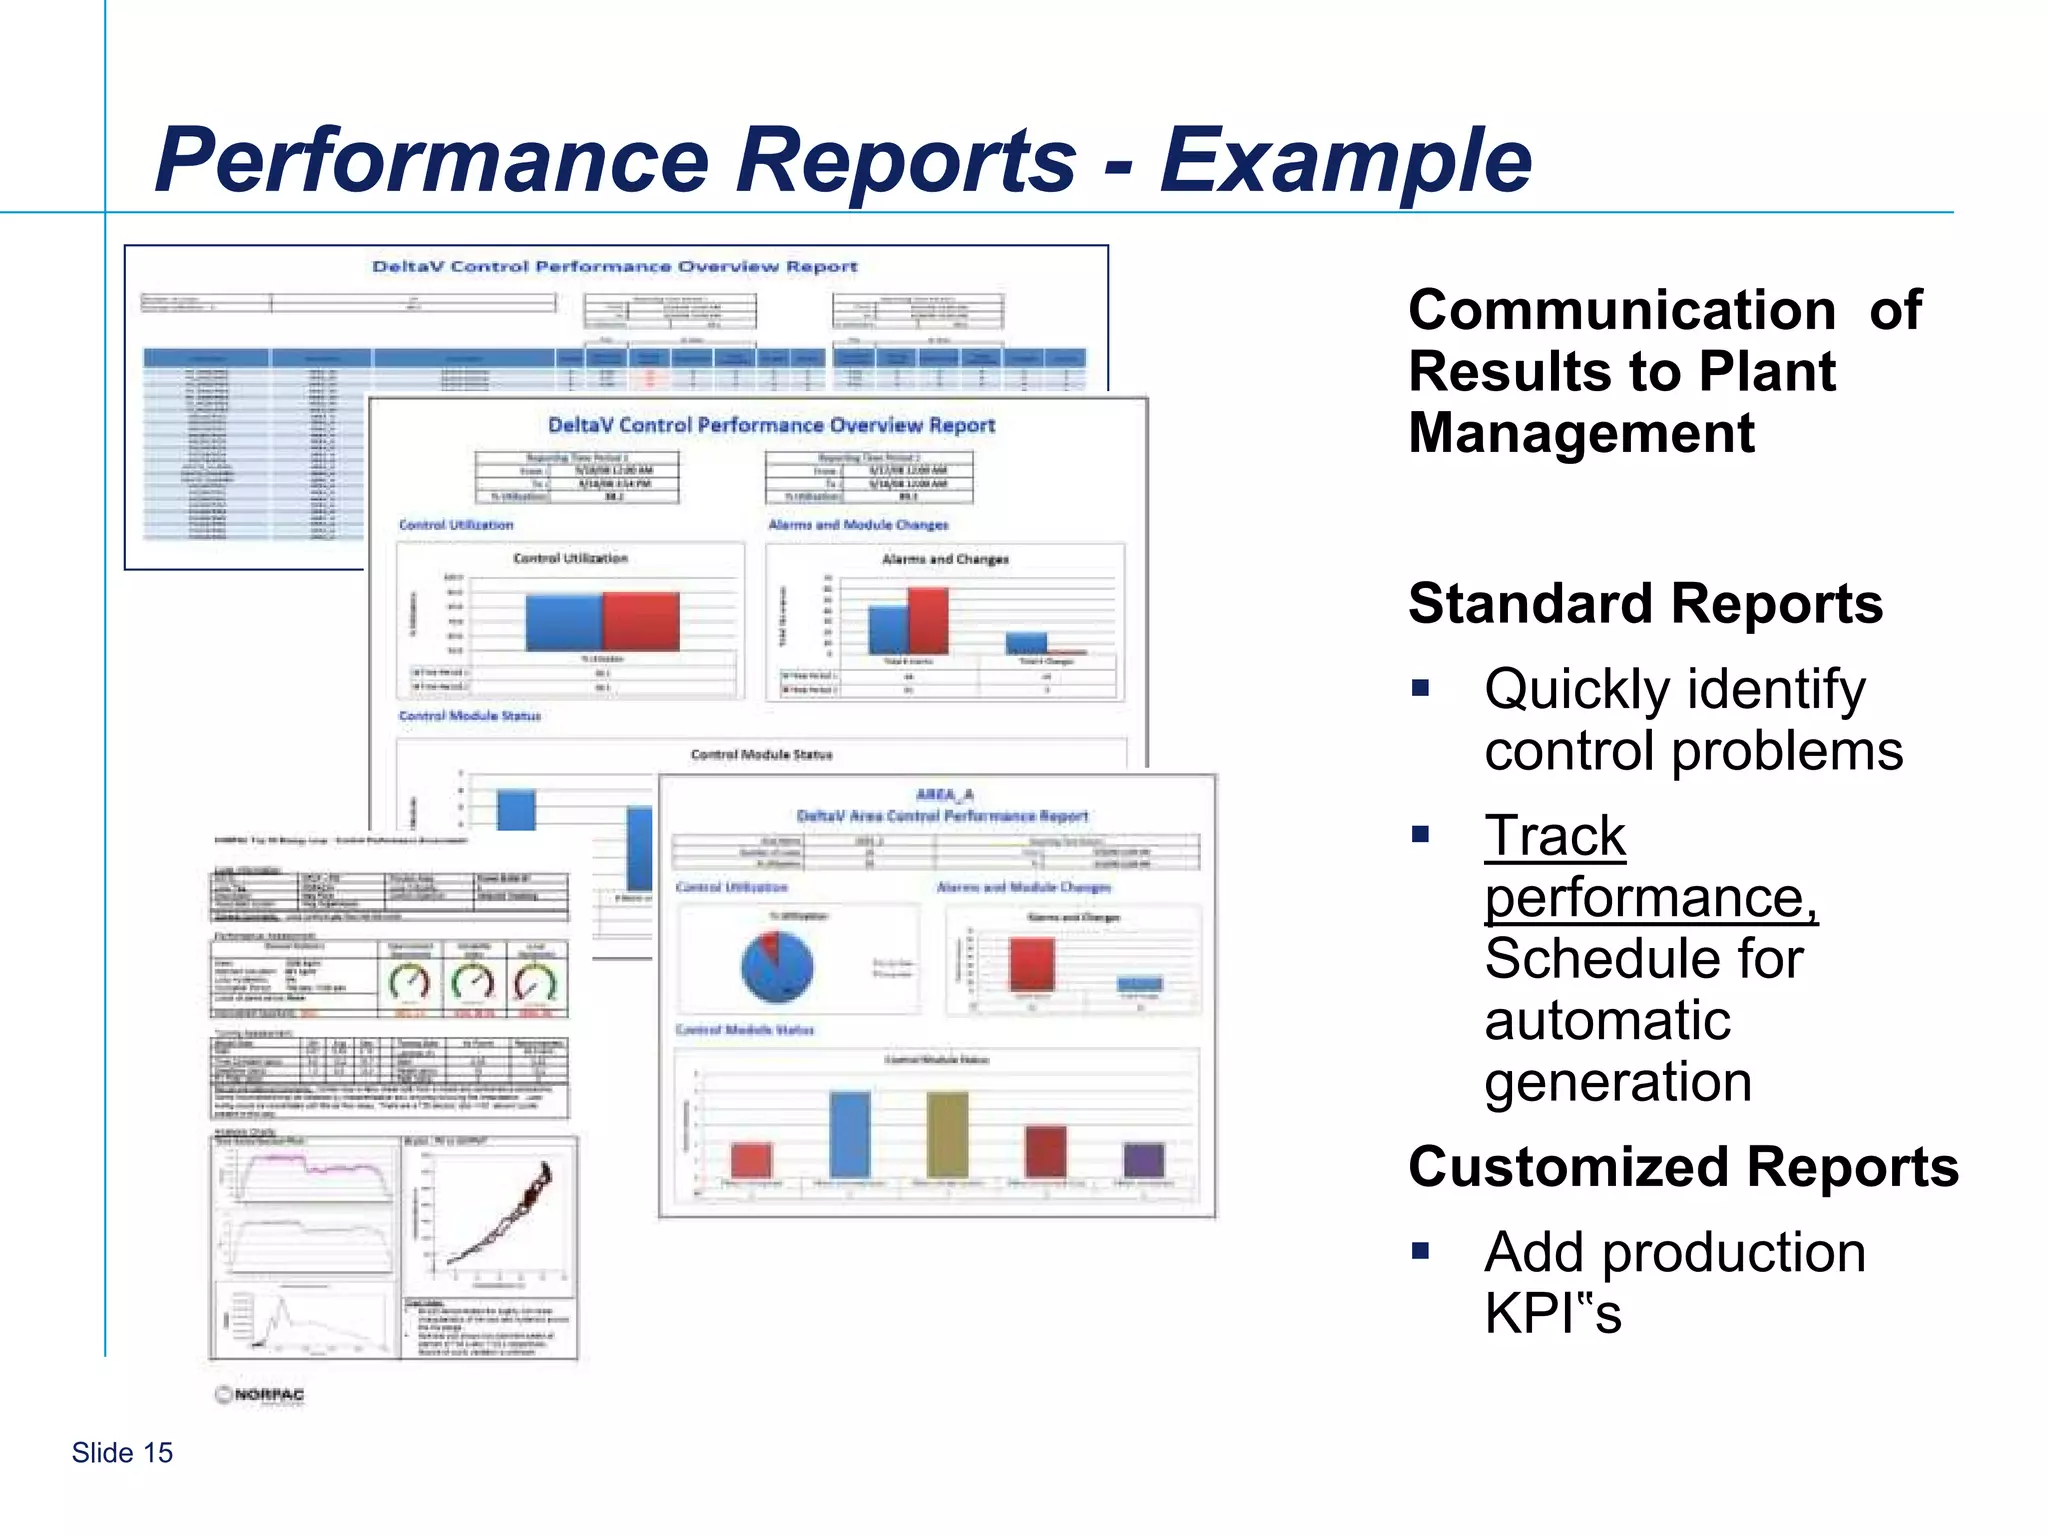
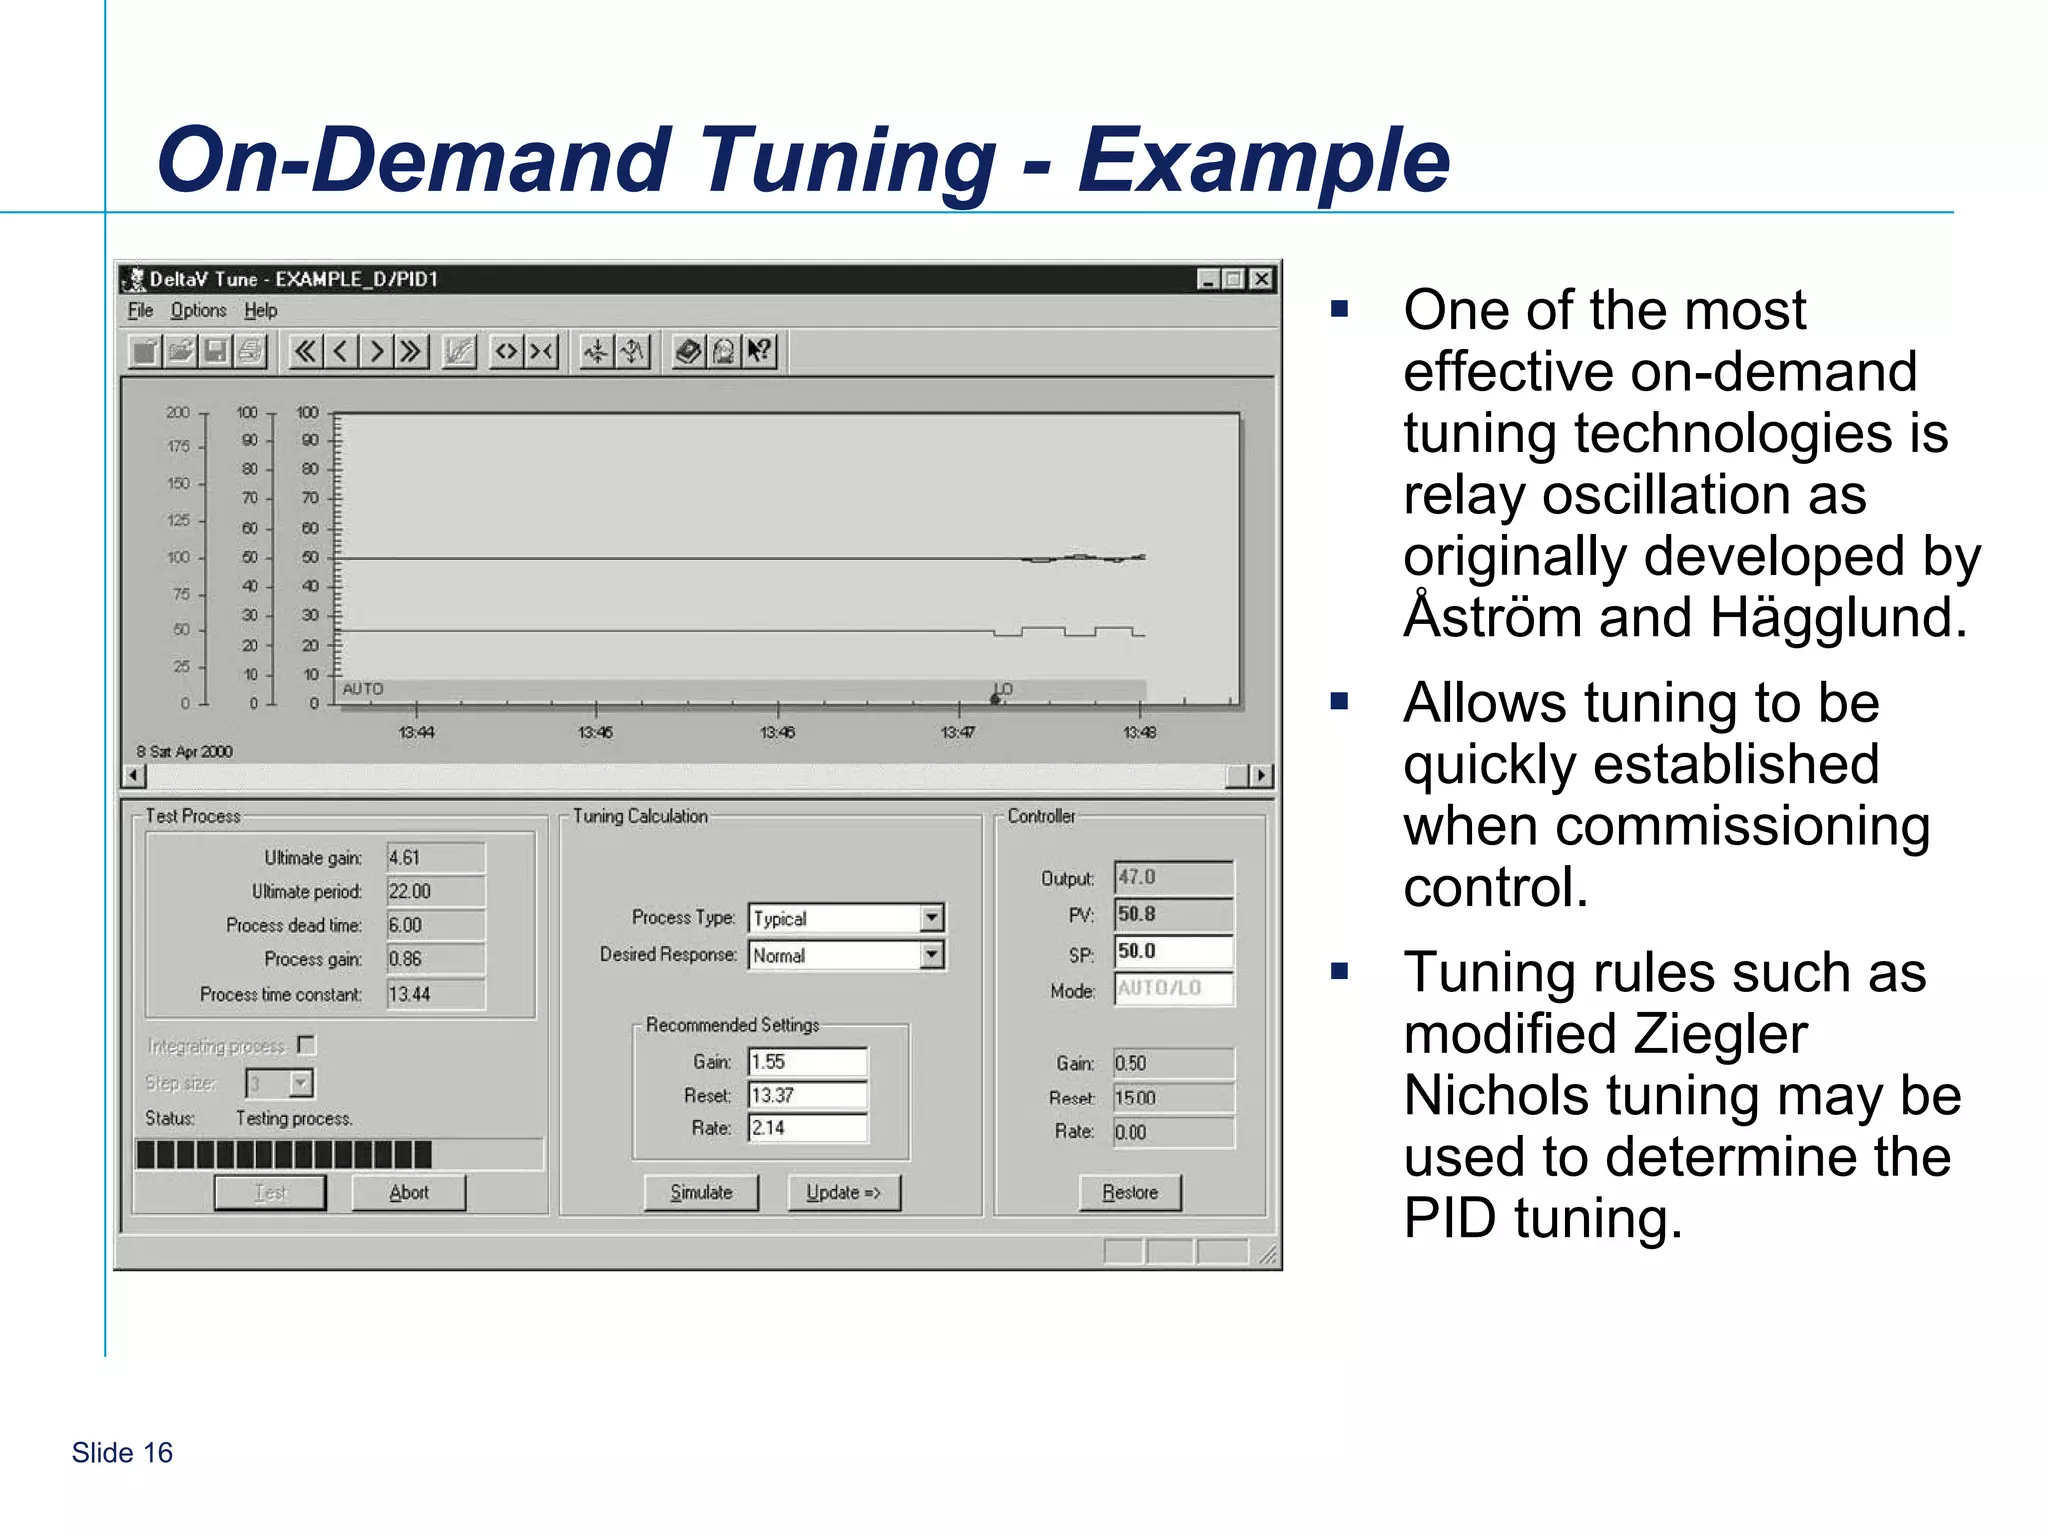
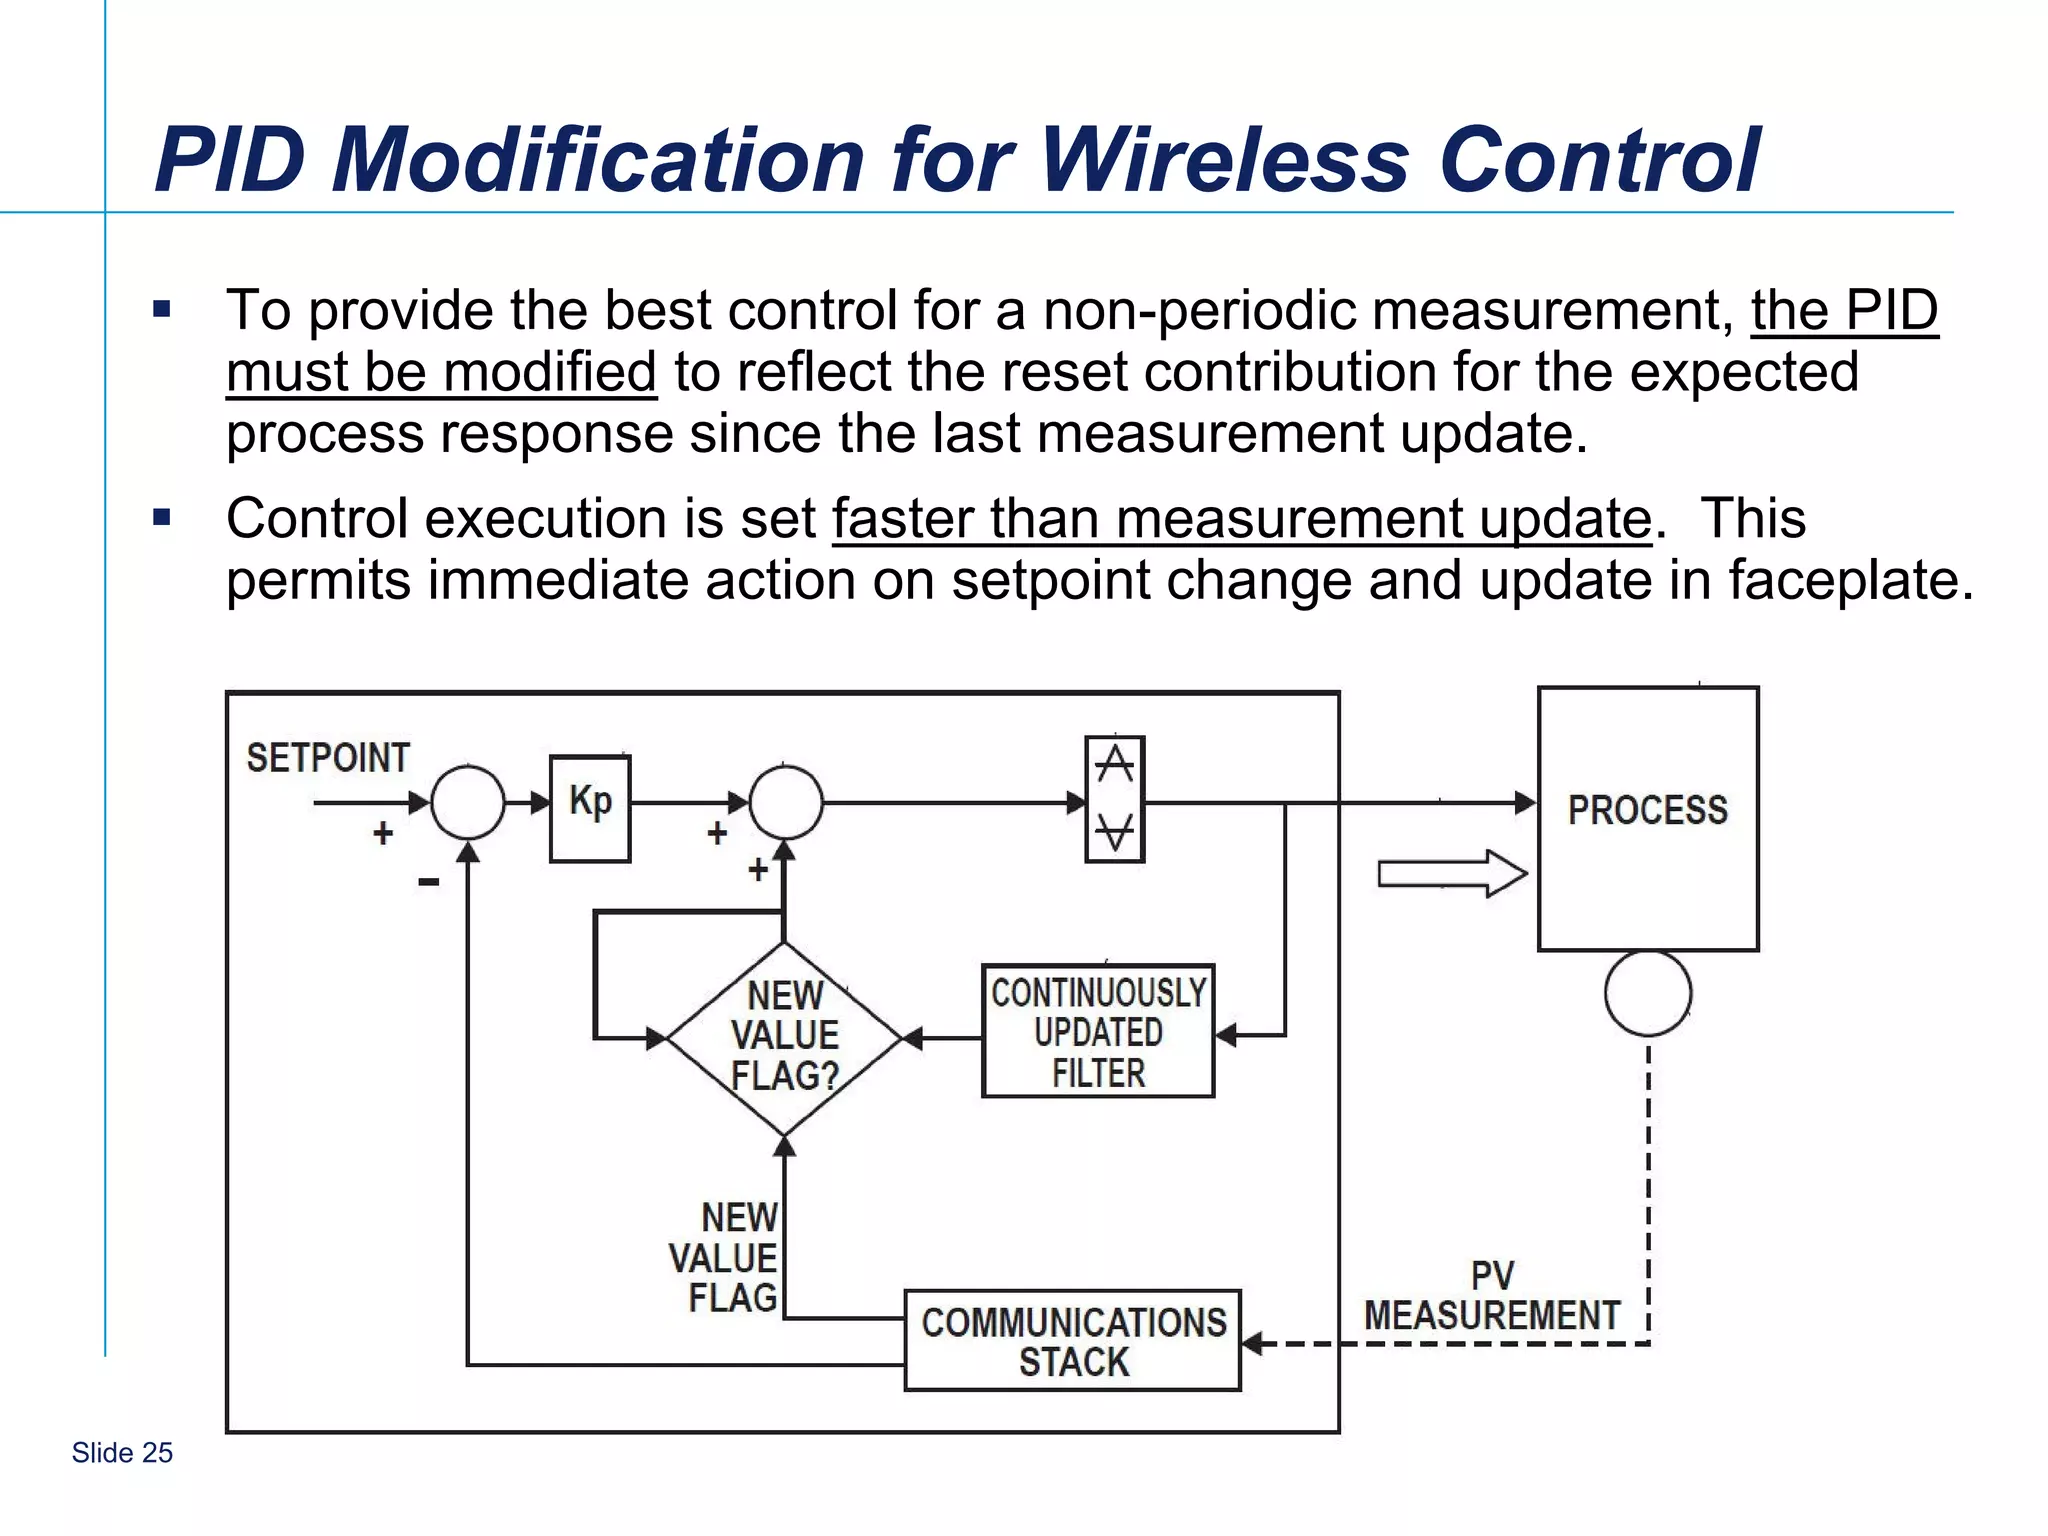
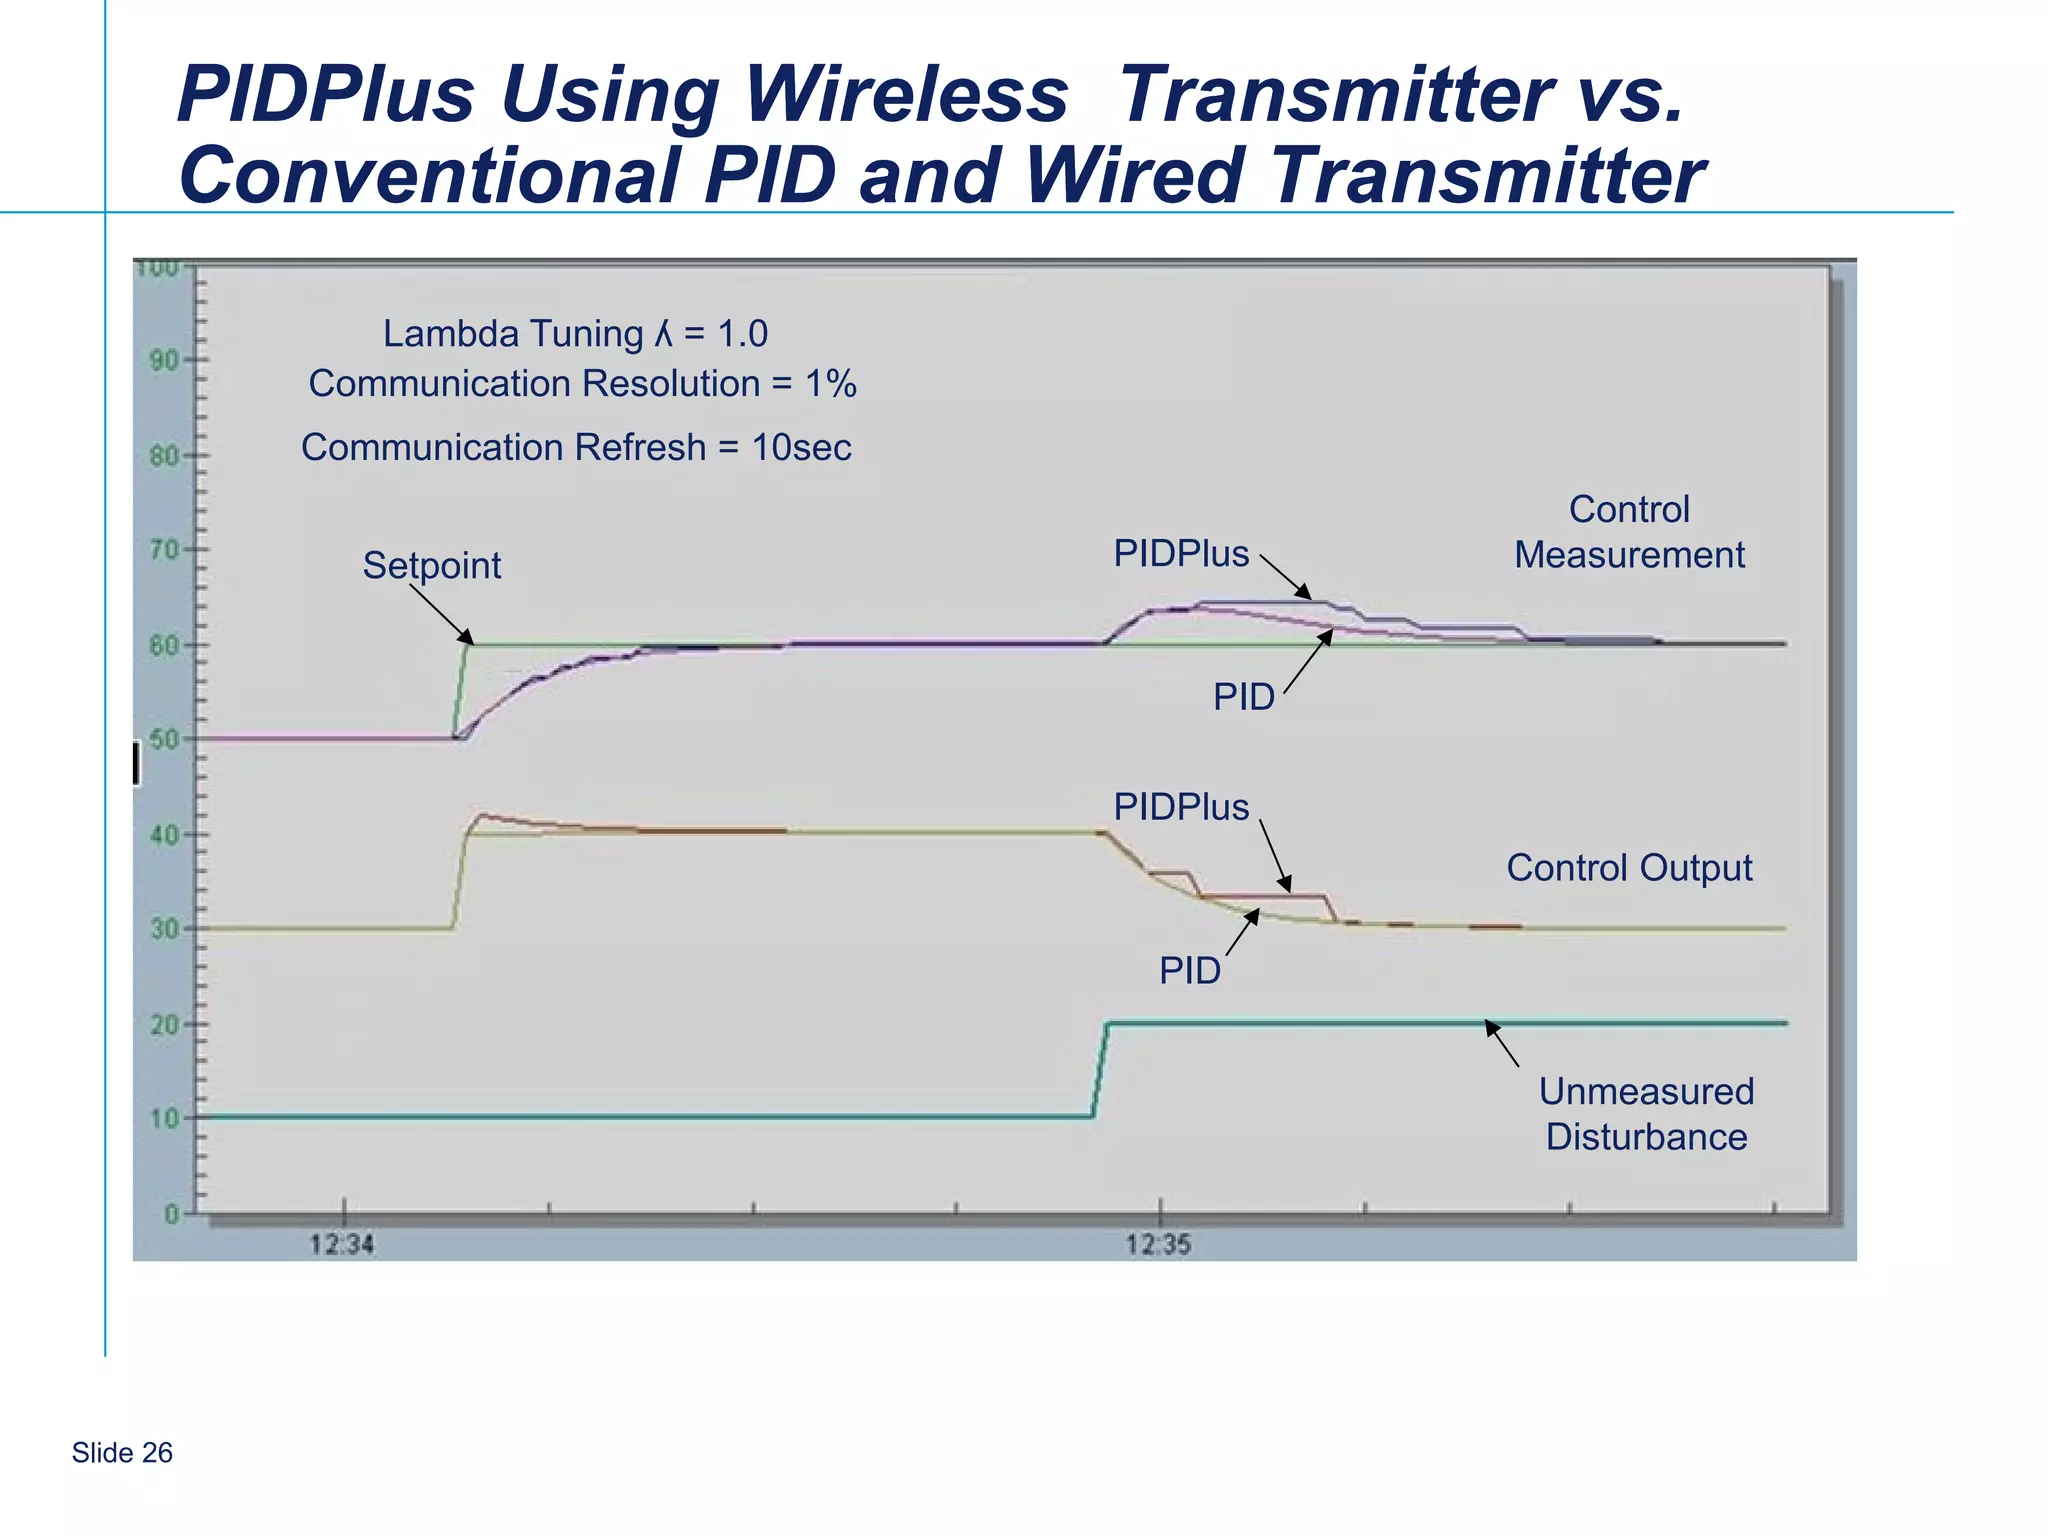
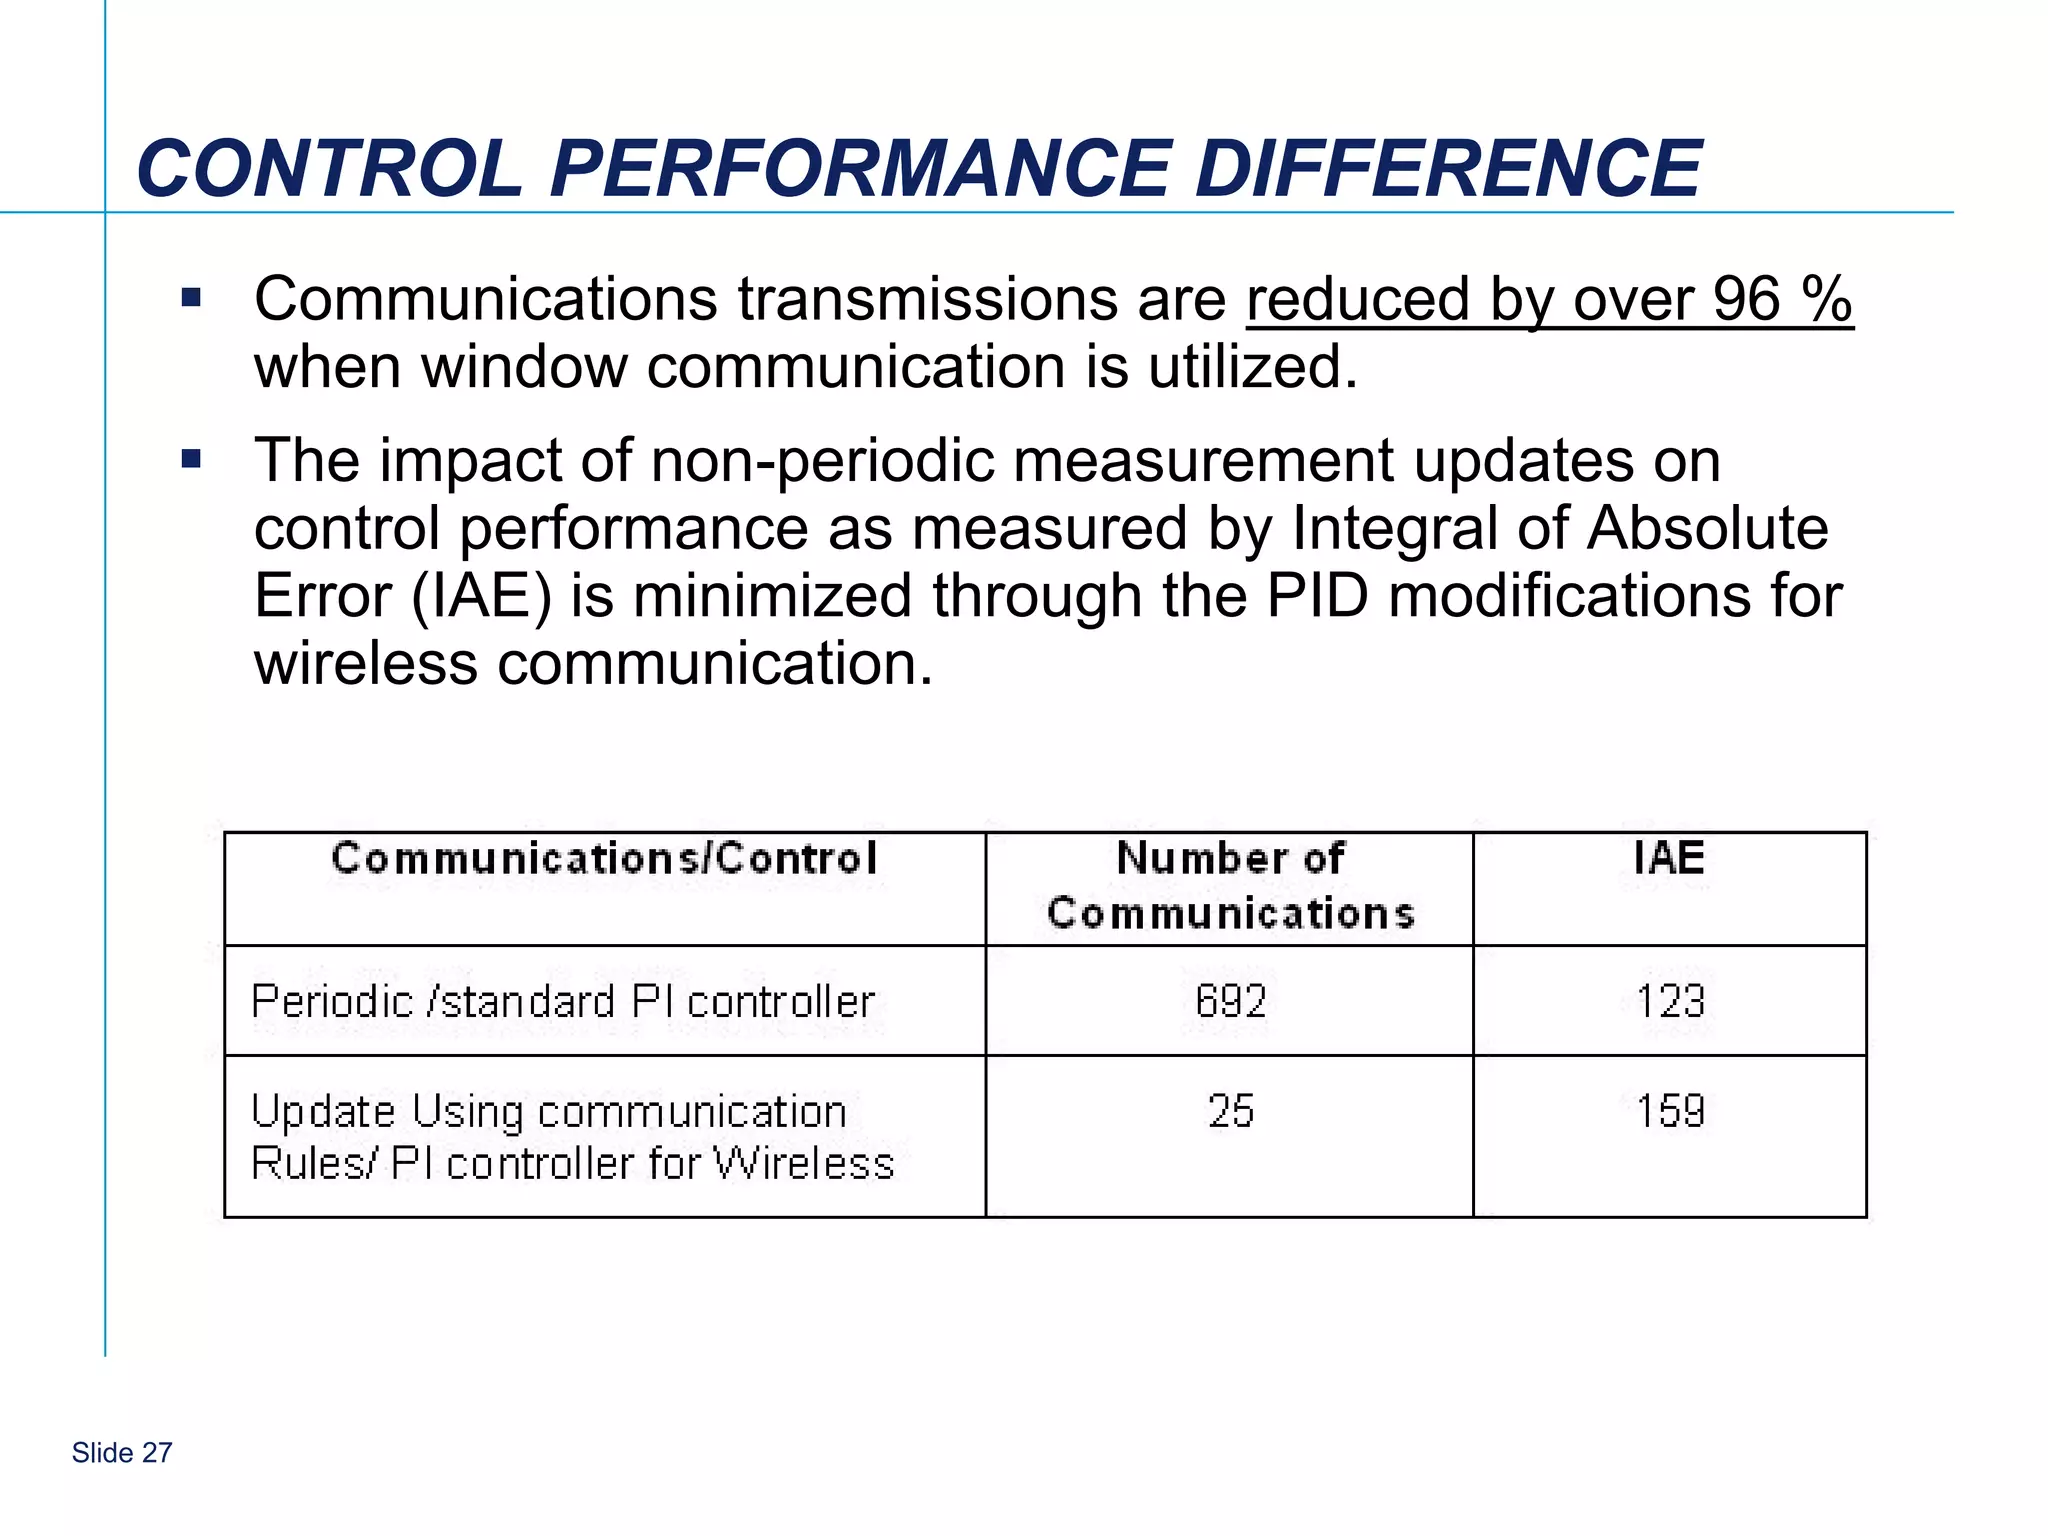
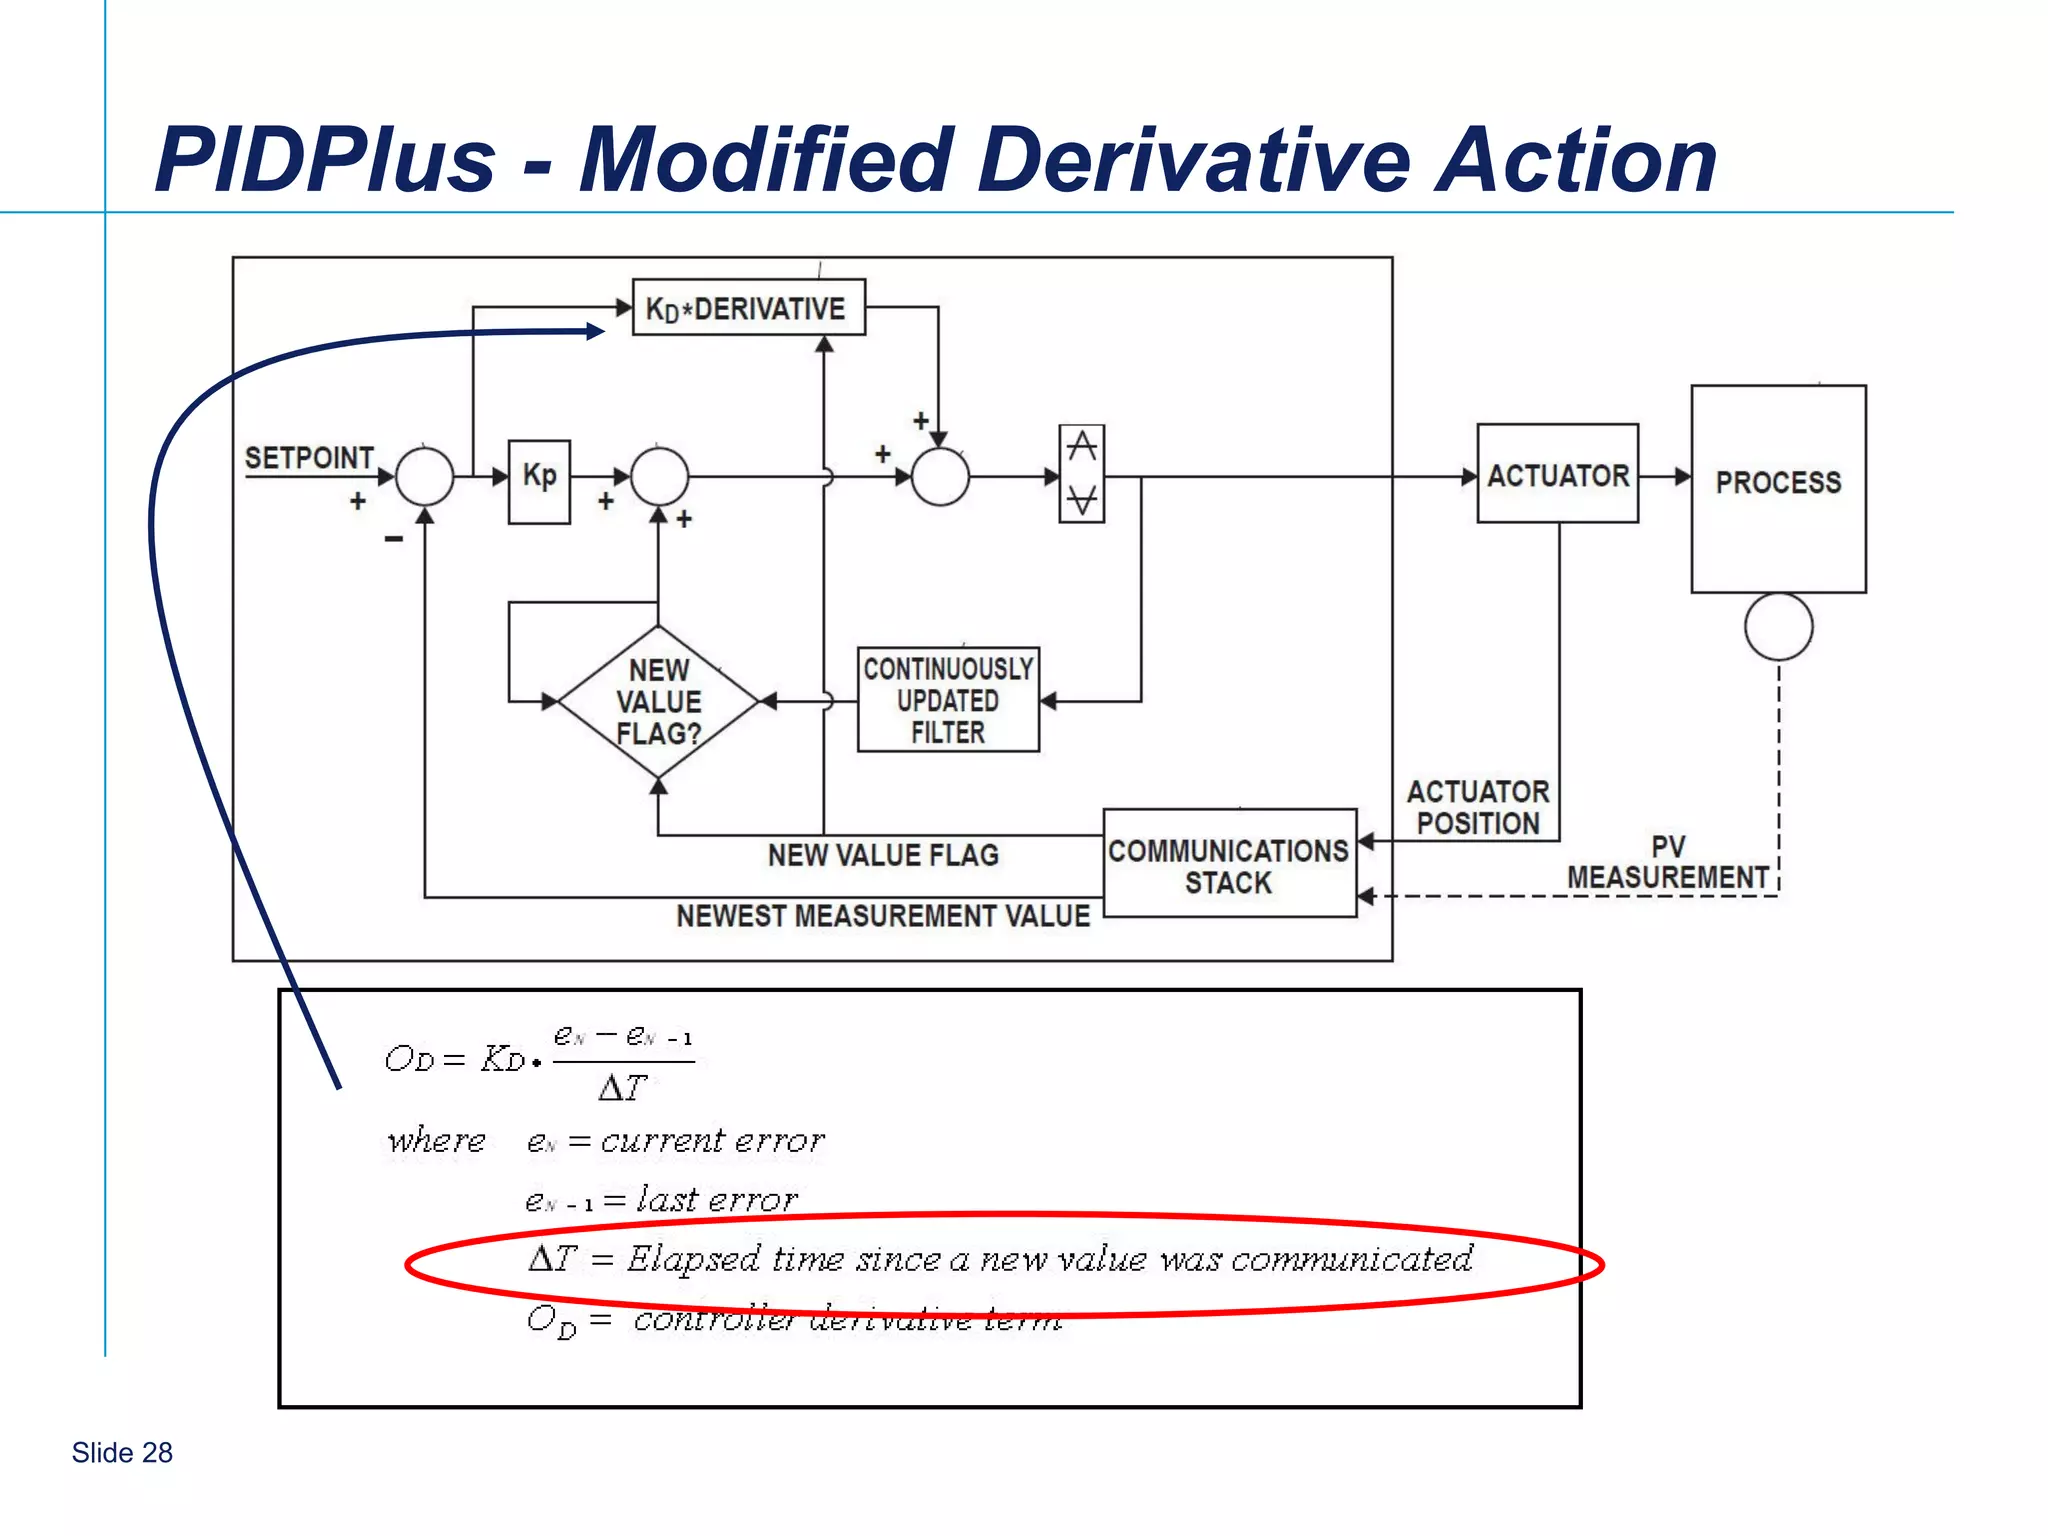

The document discusses advancements in industrial process control, focusing on PID control technology over the last decade, including performance monitoring, on-demand tuning, and adaptive control. It addresses challenges in the process industry, such as staffing reductions and the need for improved control performance. The conclusion suggests future developments will enhance PID control, especially with wireless devices and better recovery from process saturation.


