Downloaded 194 times
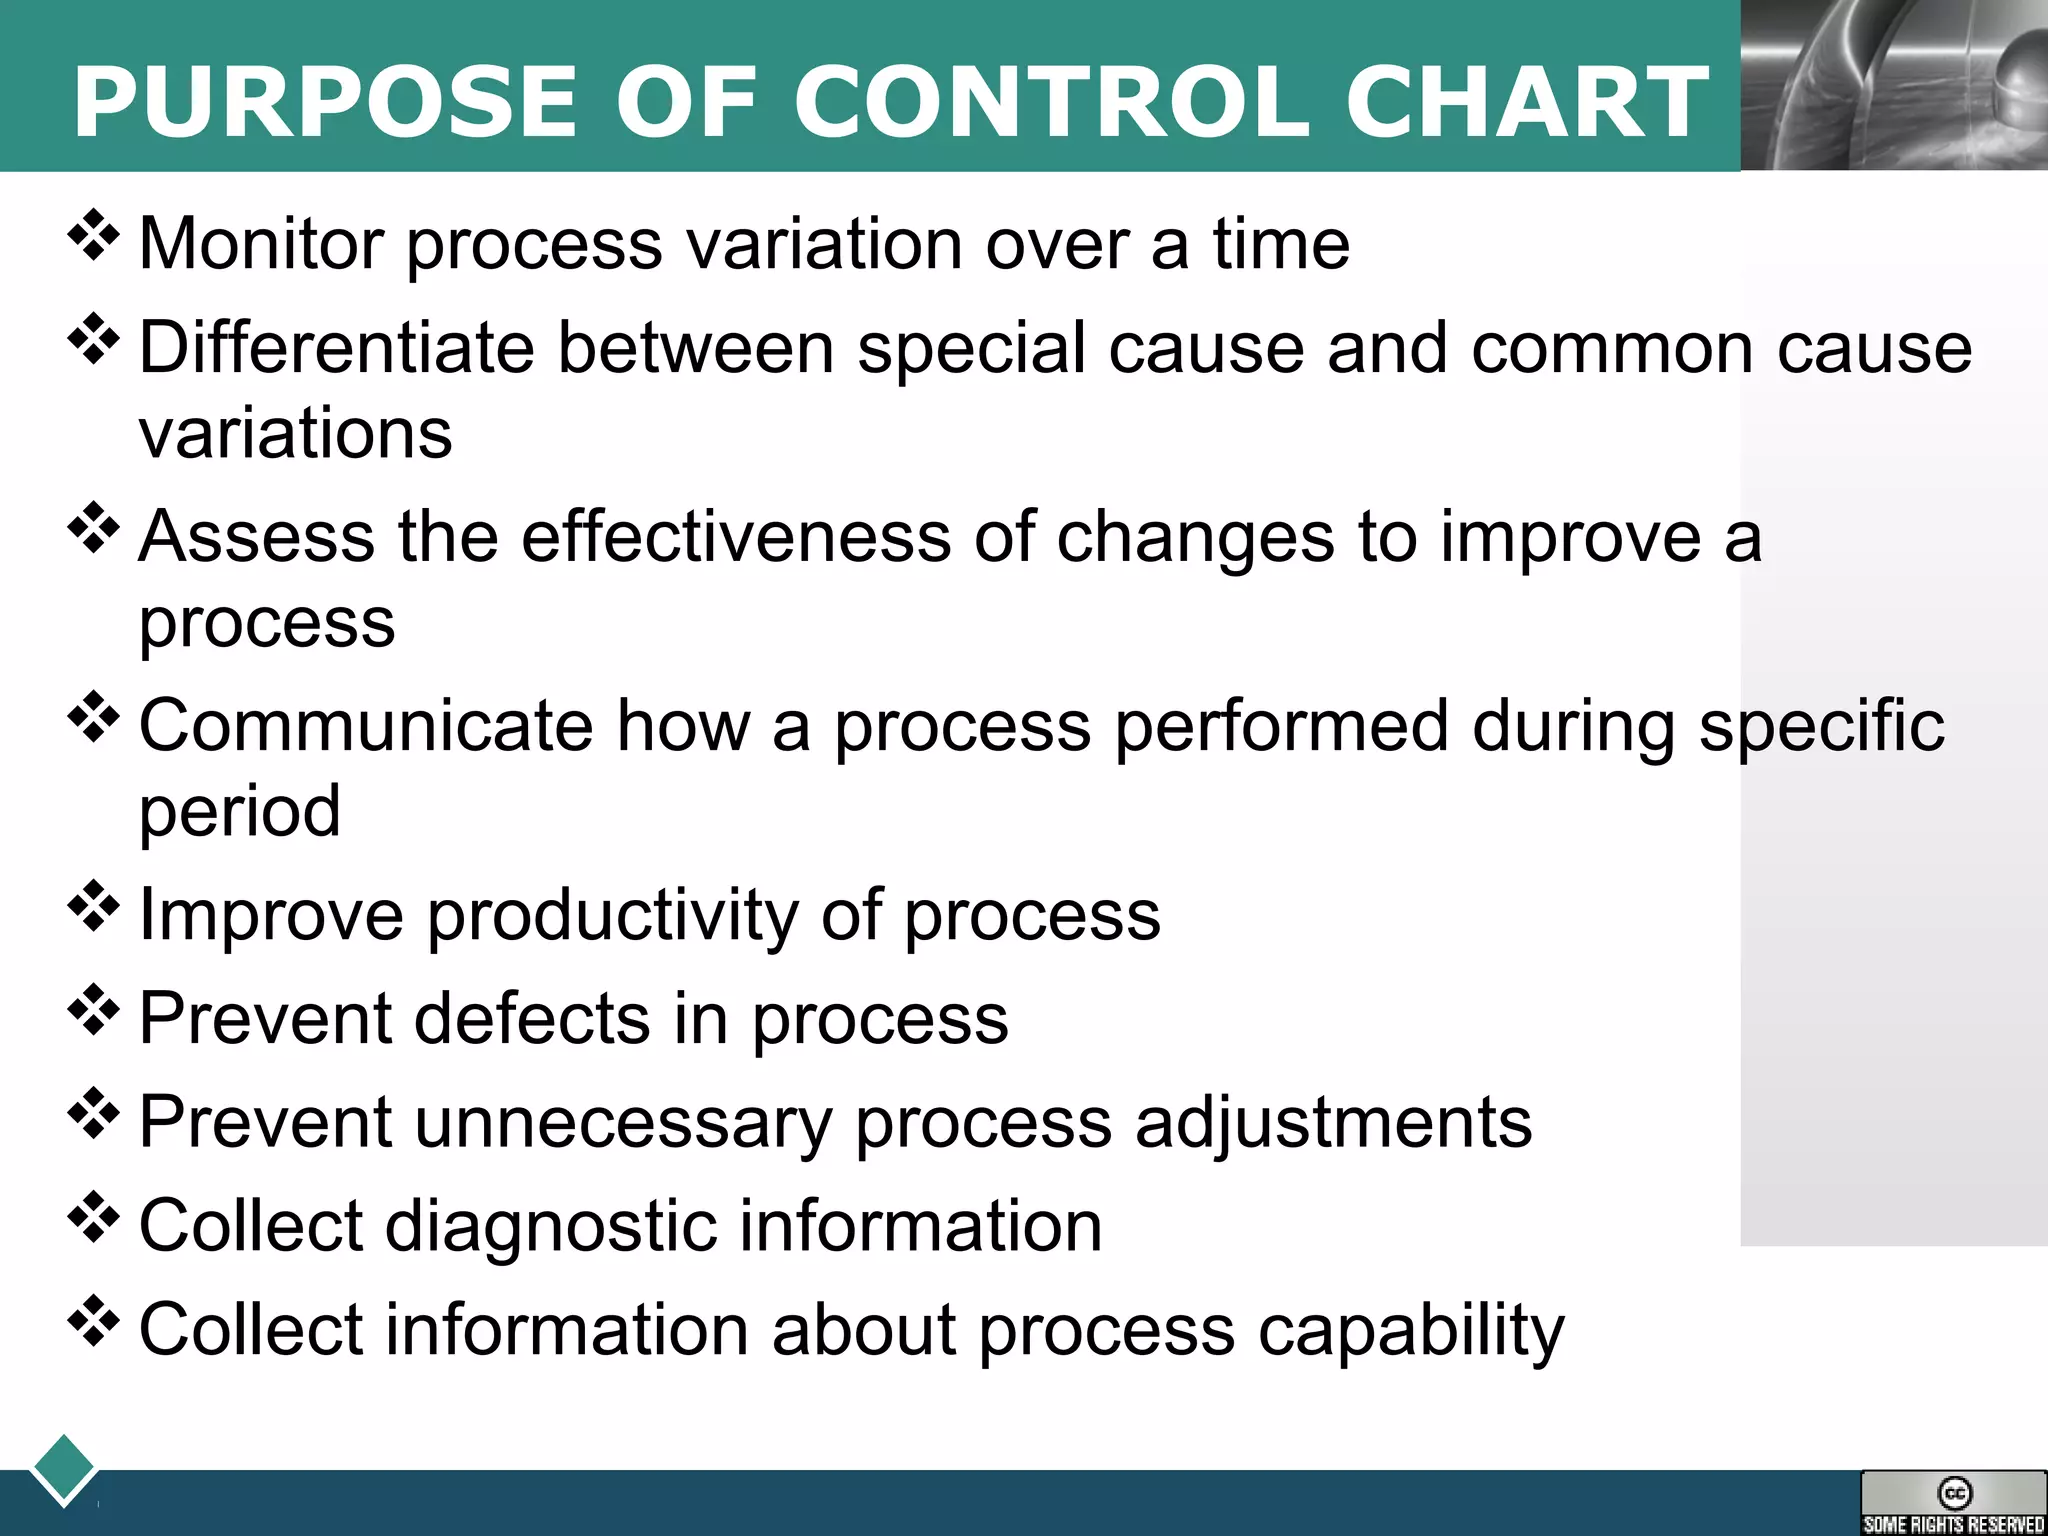
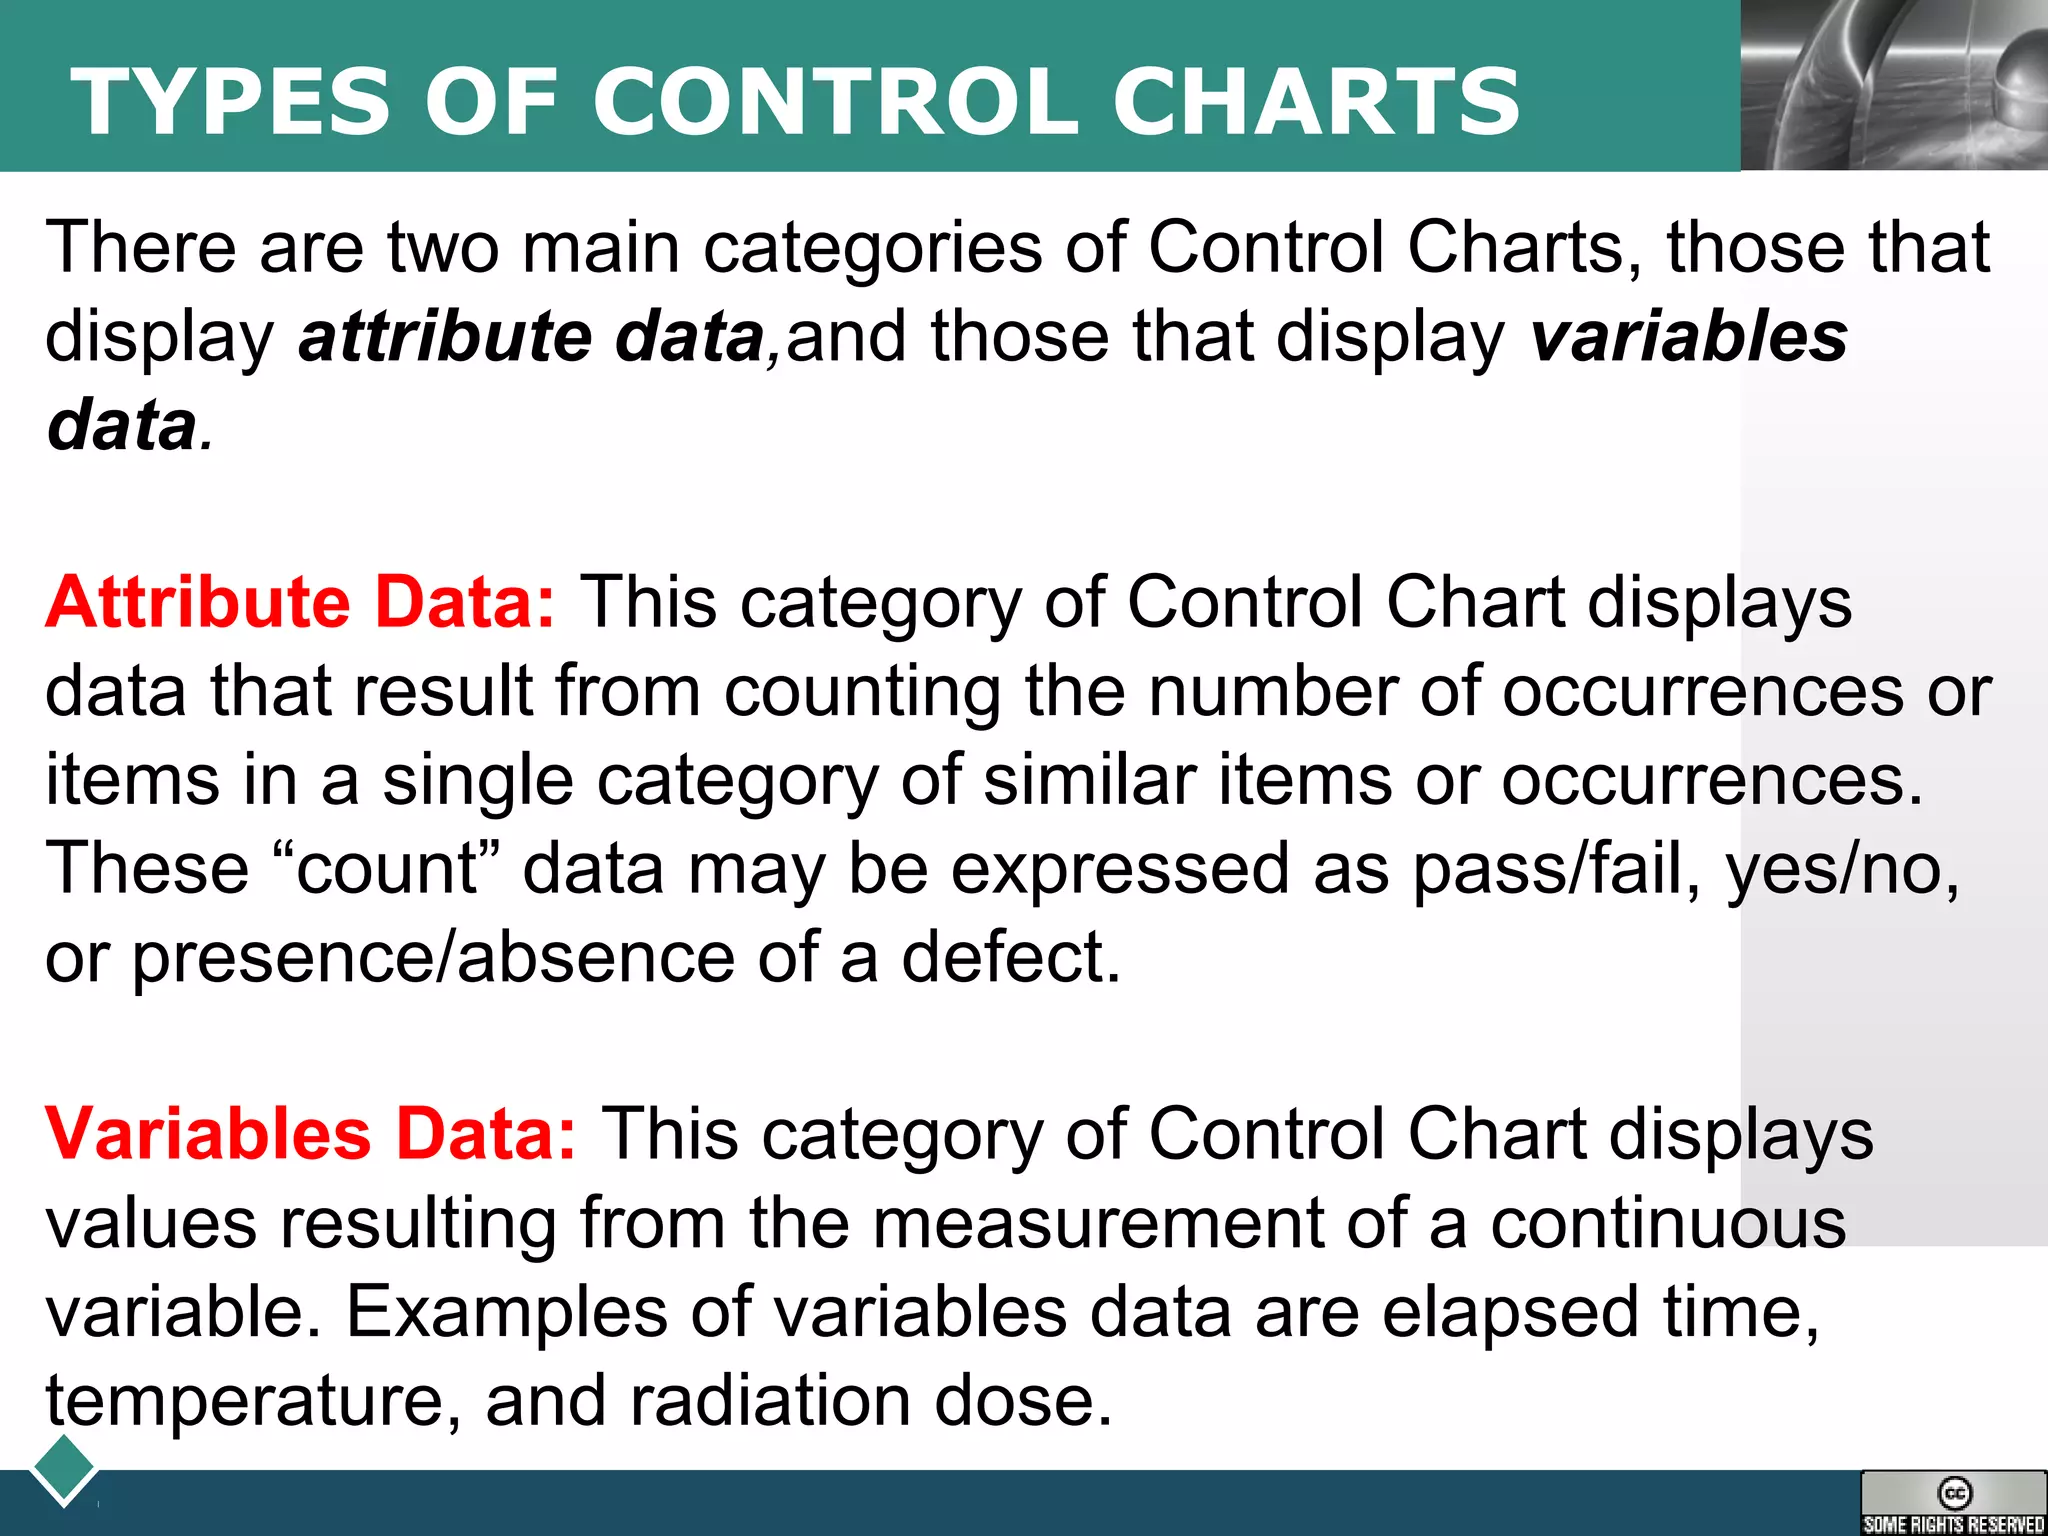
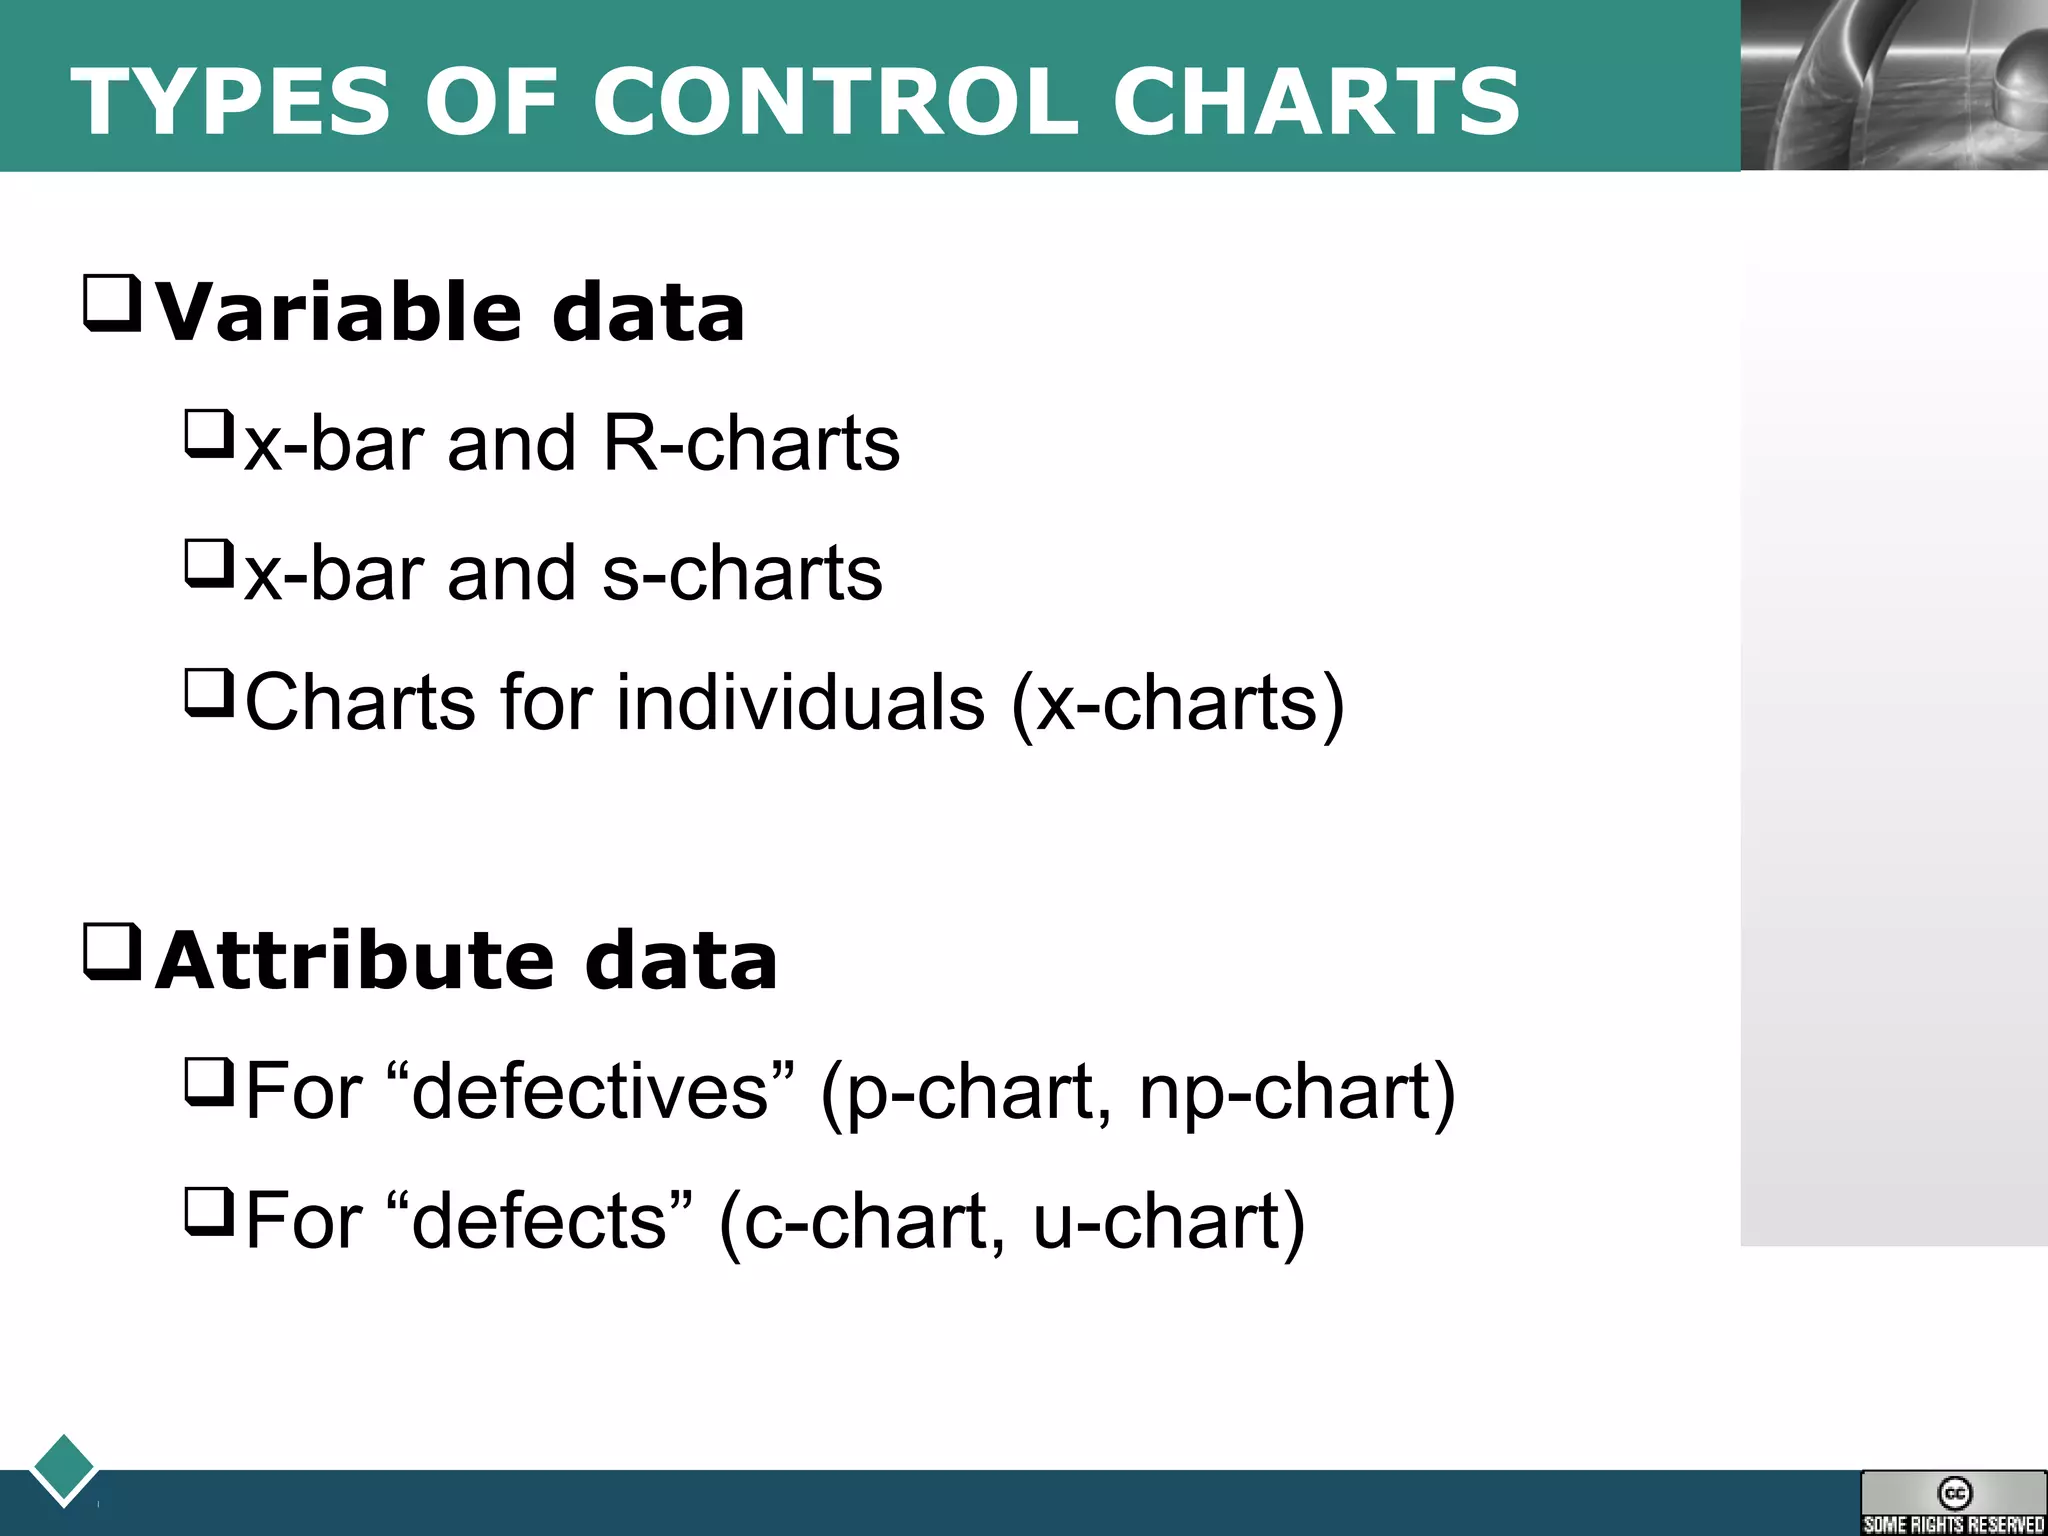
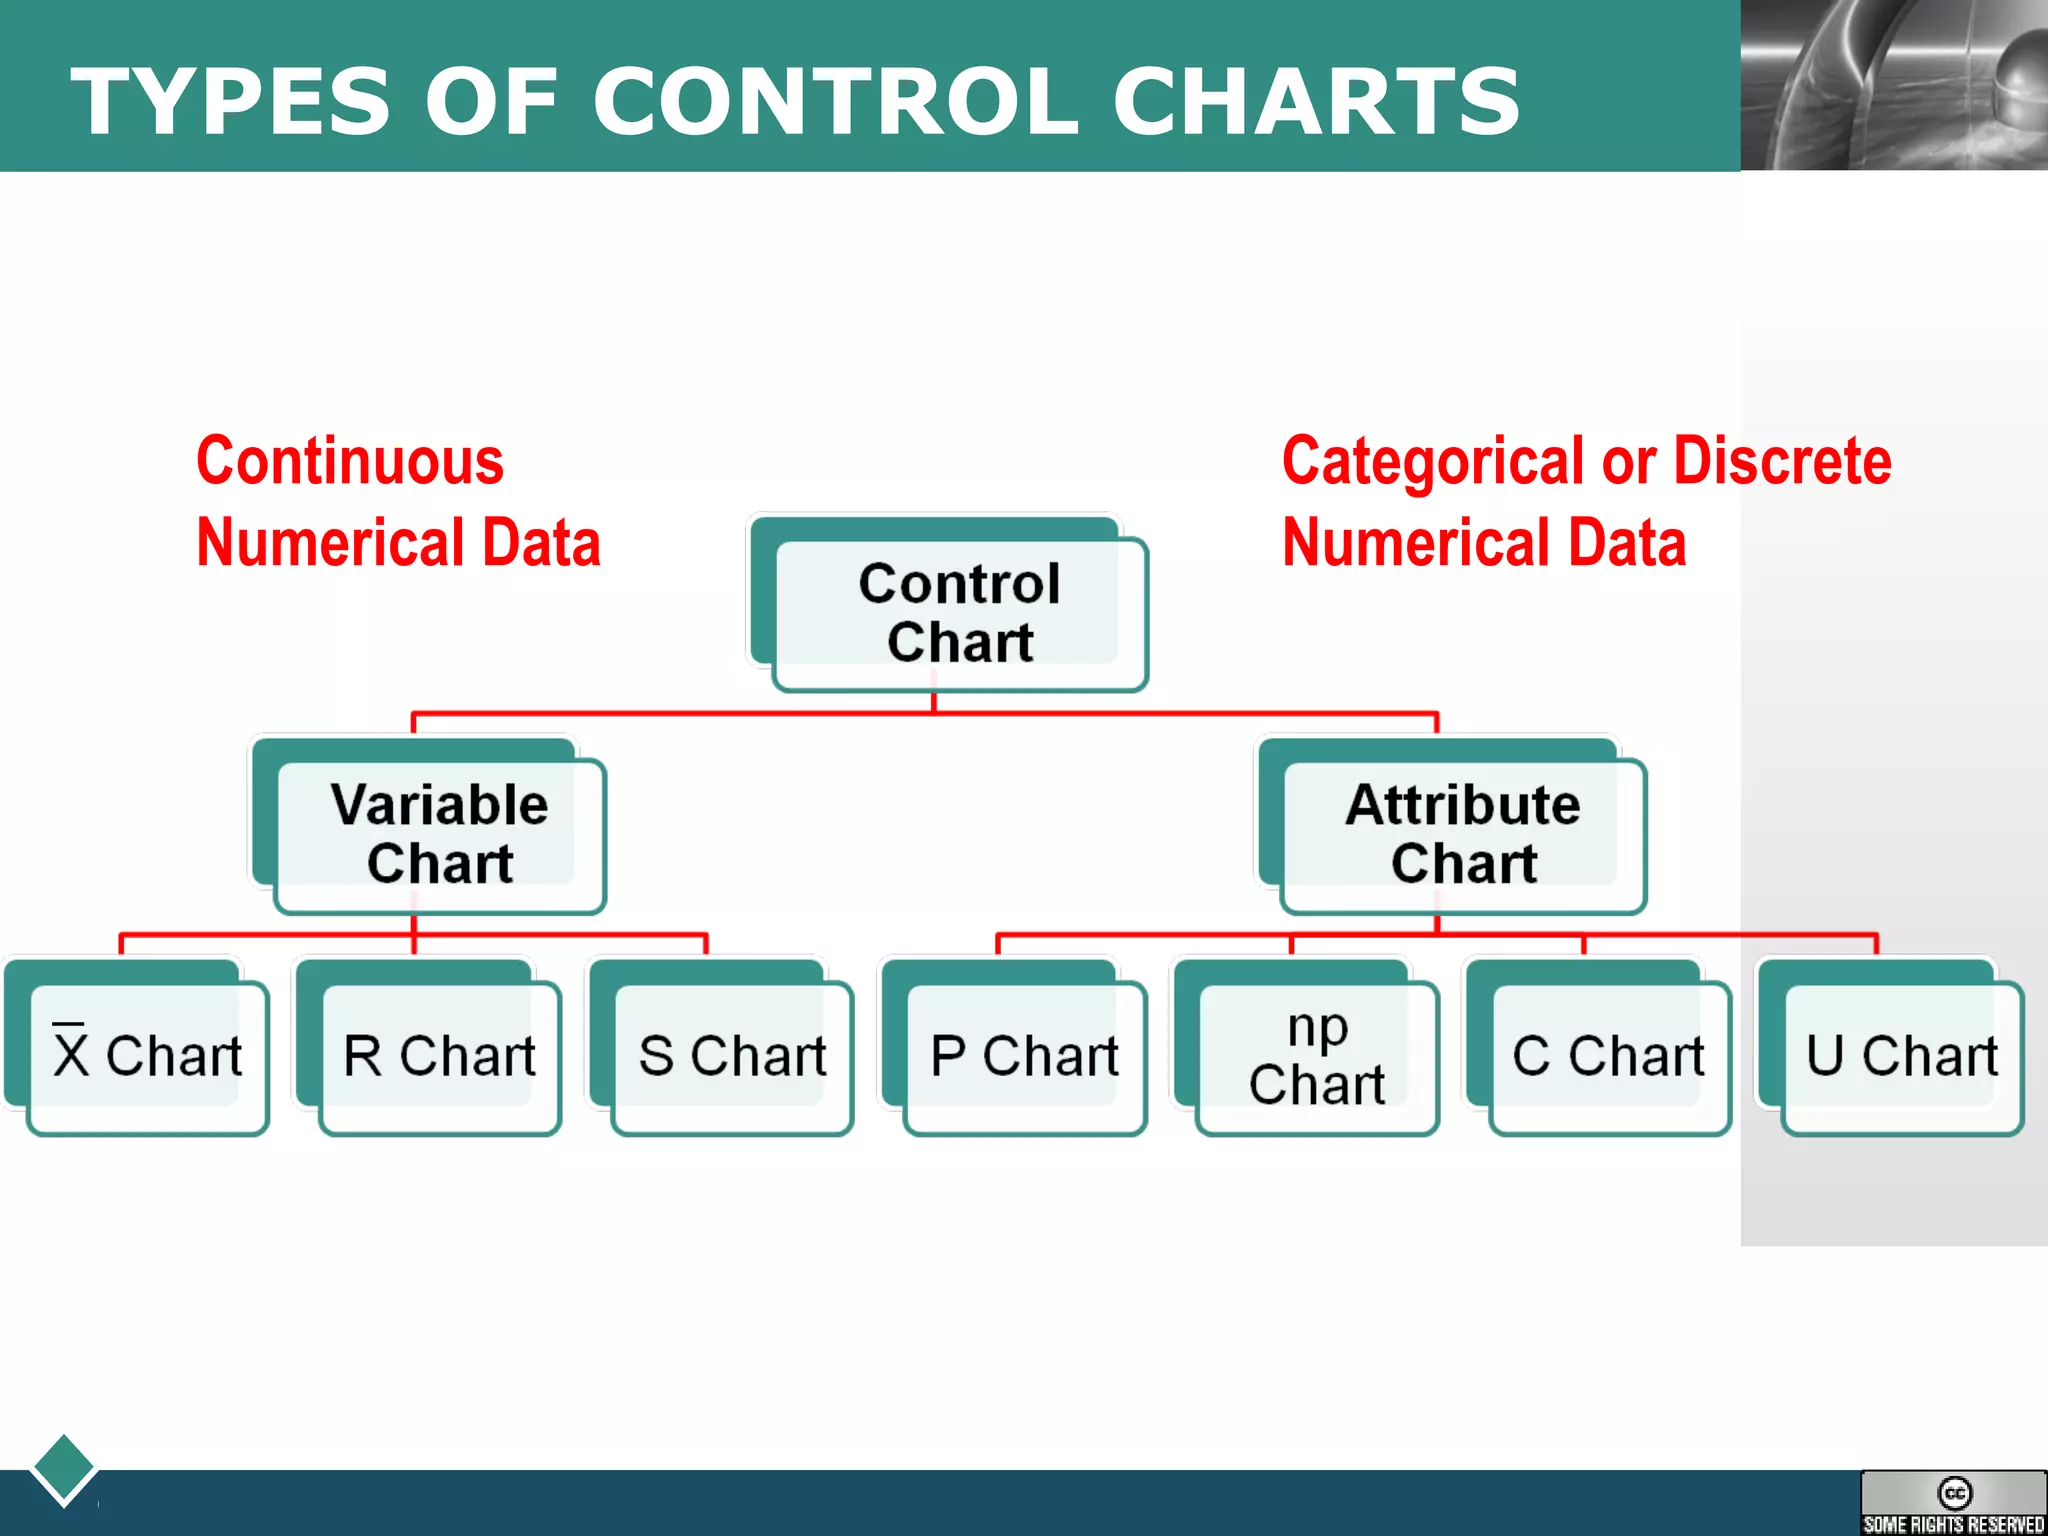
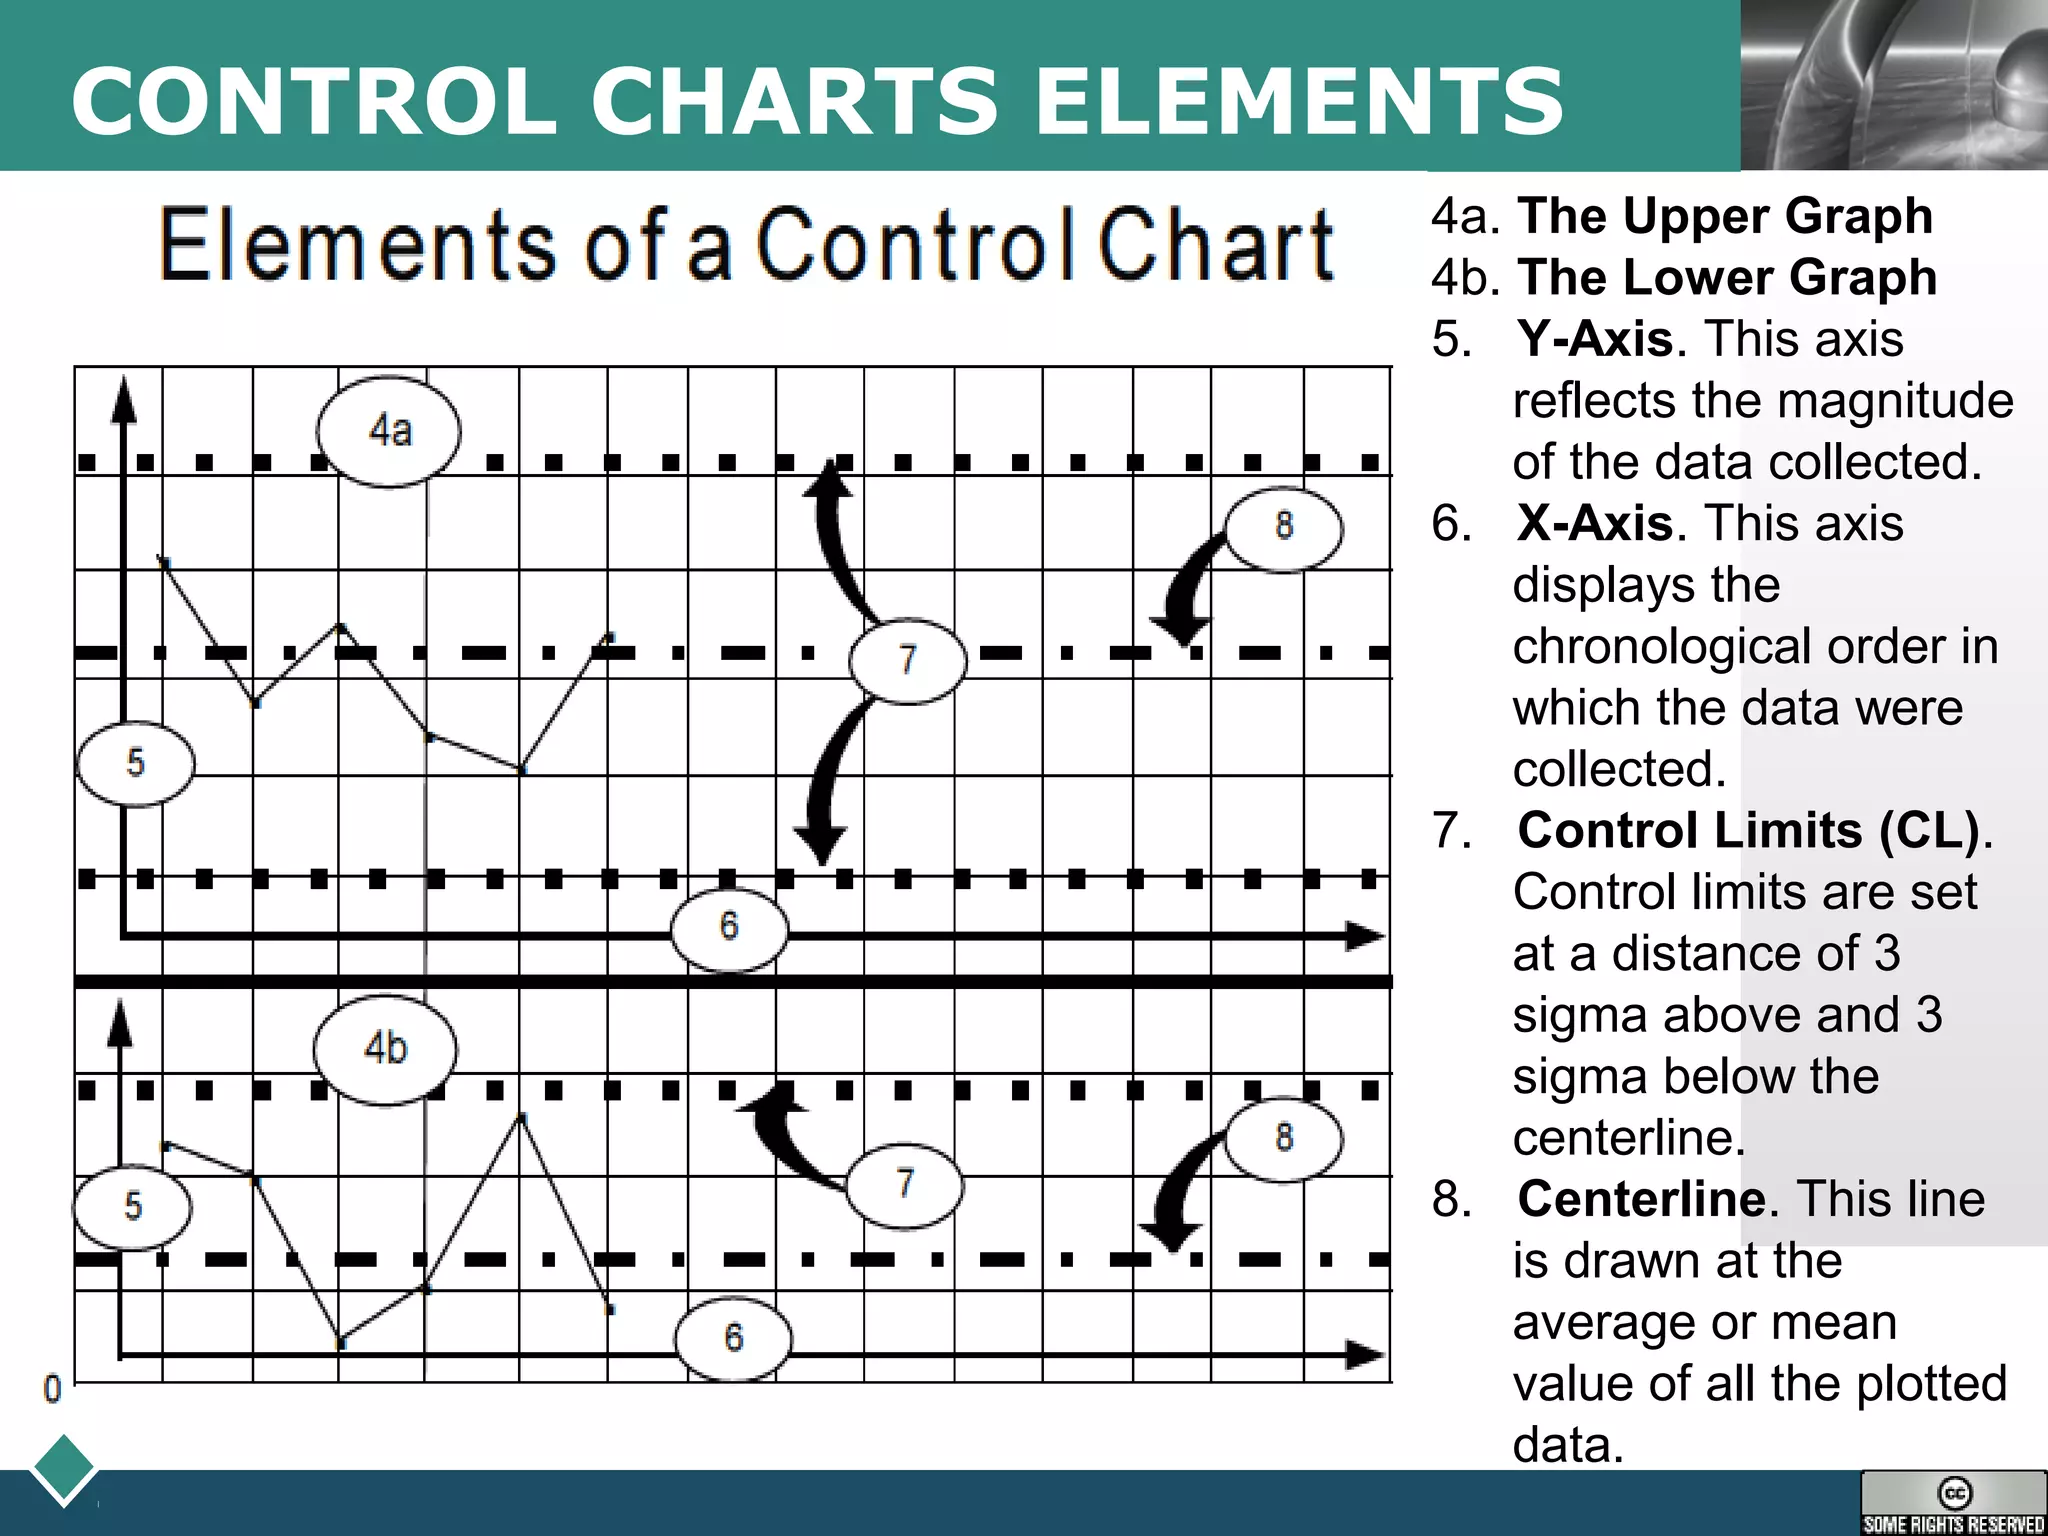
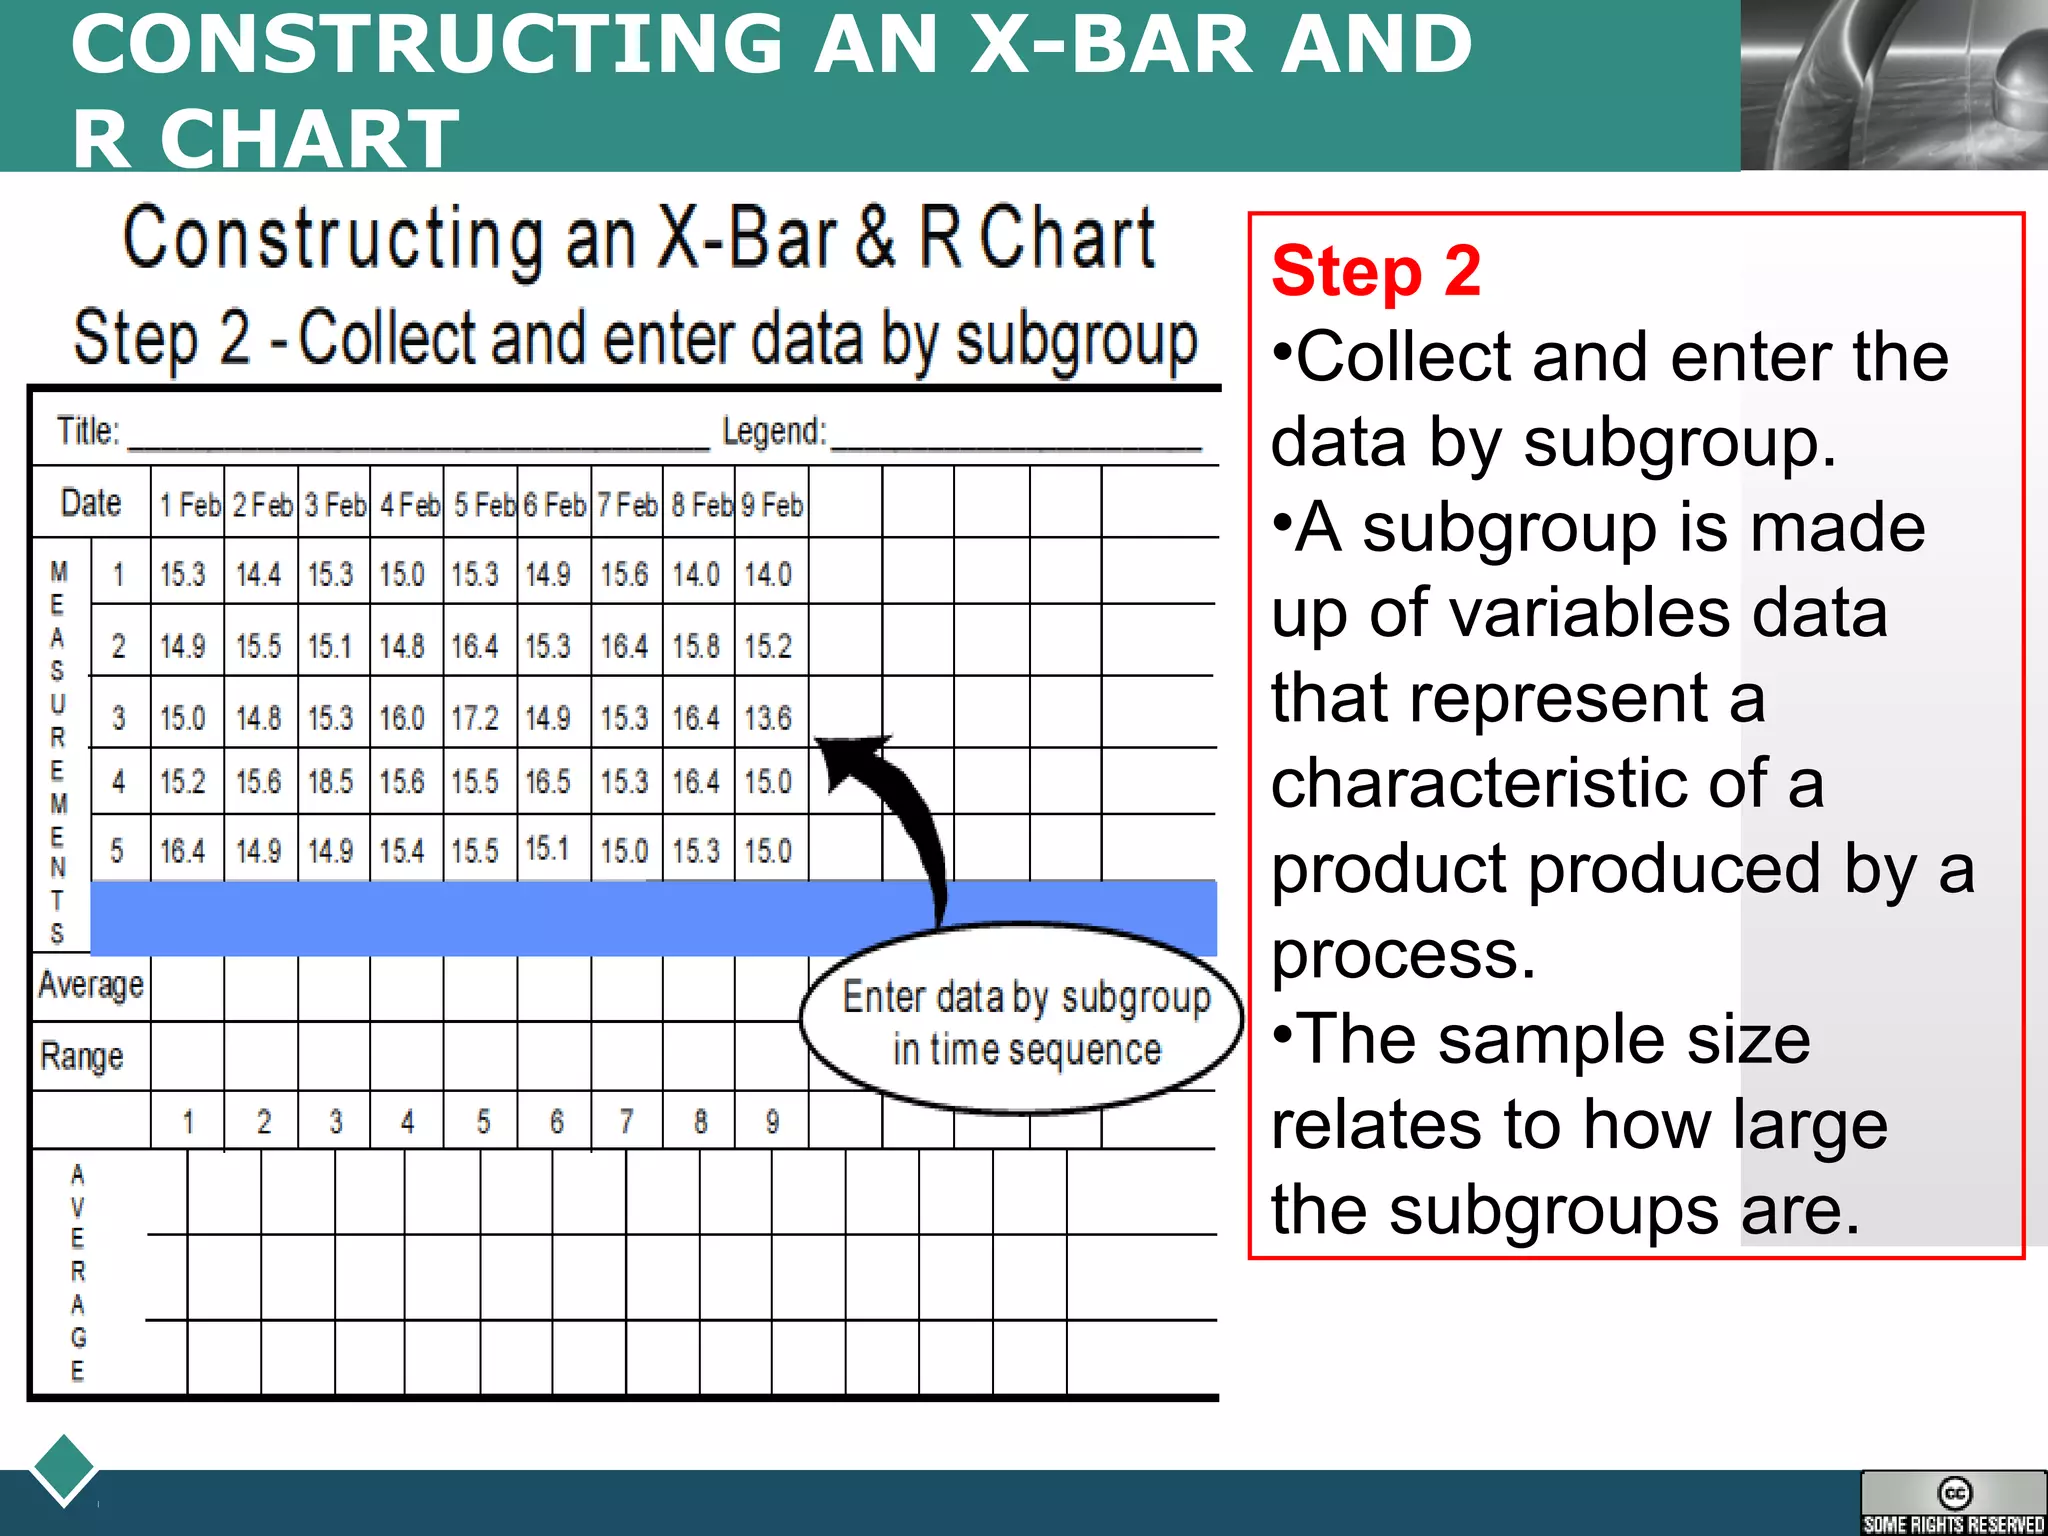
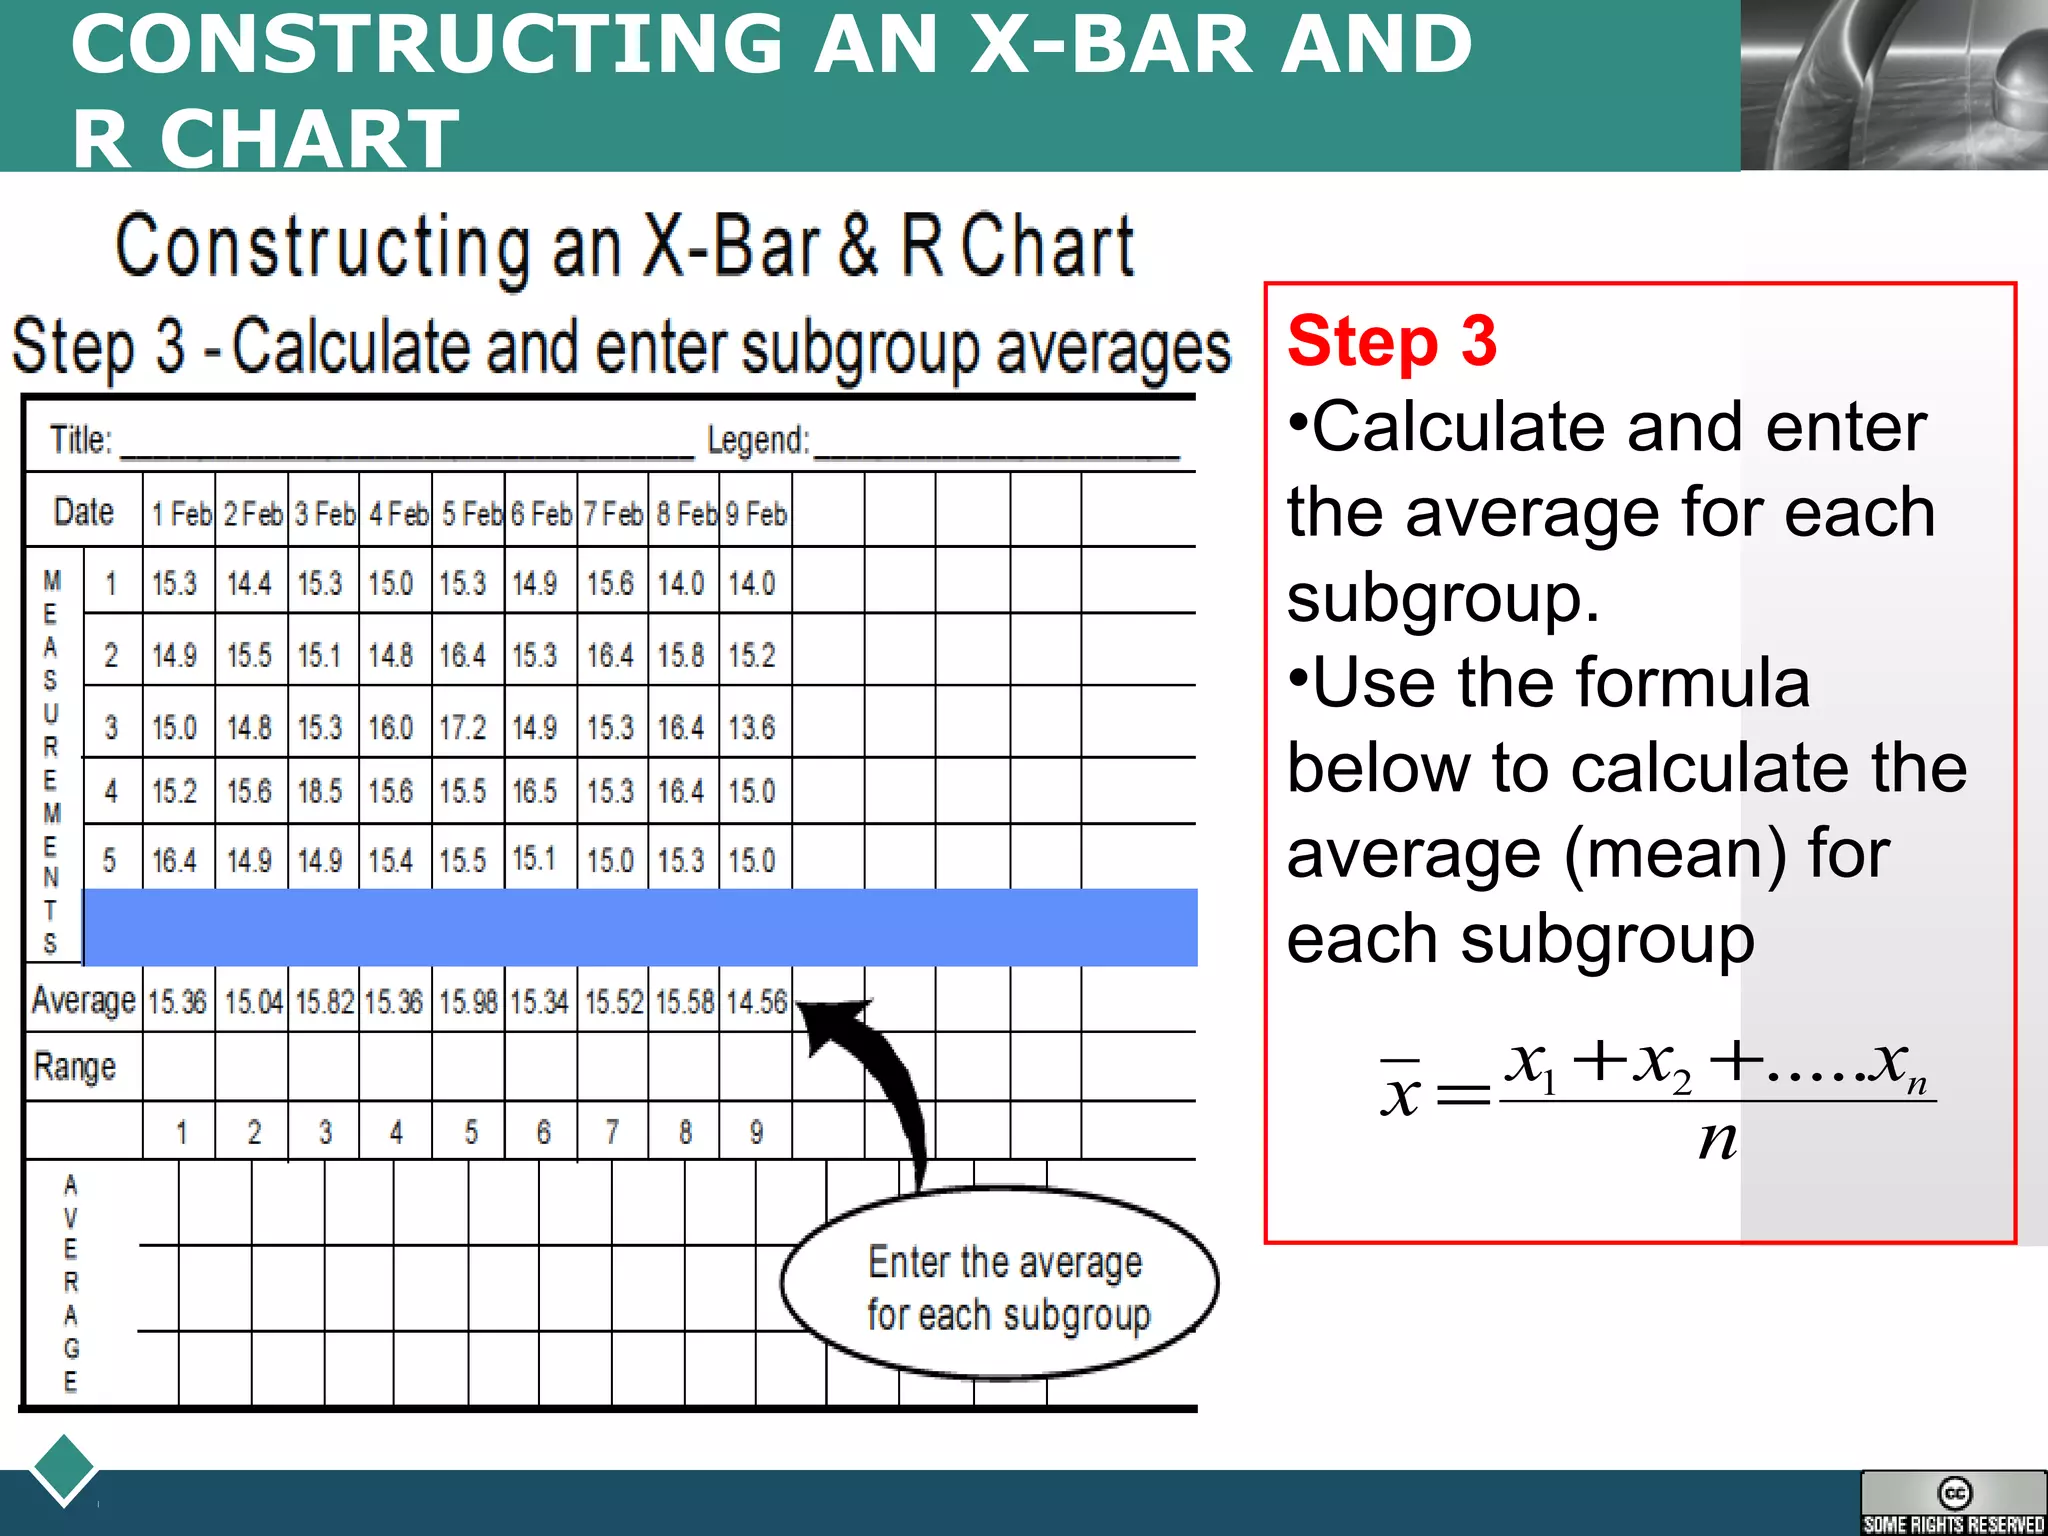
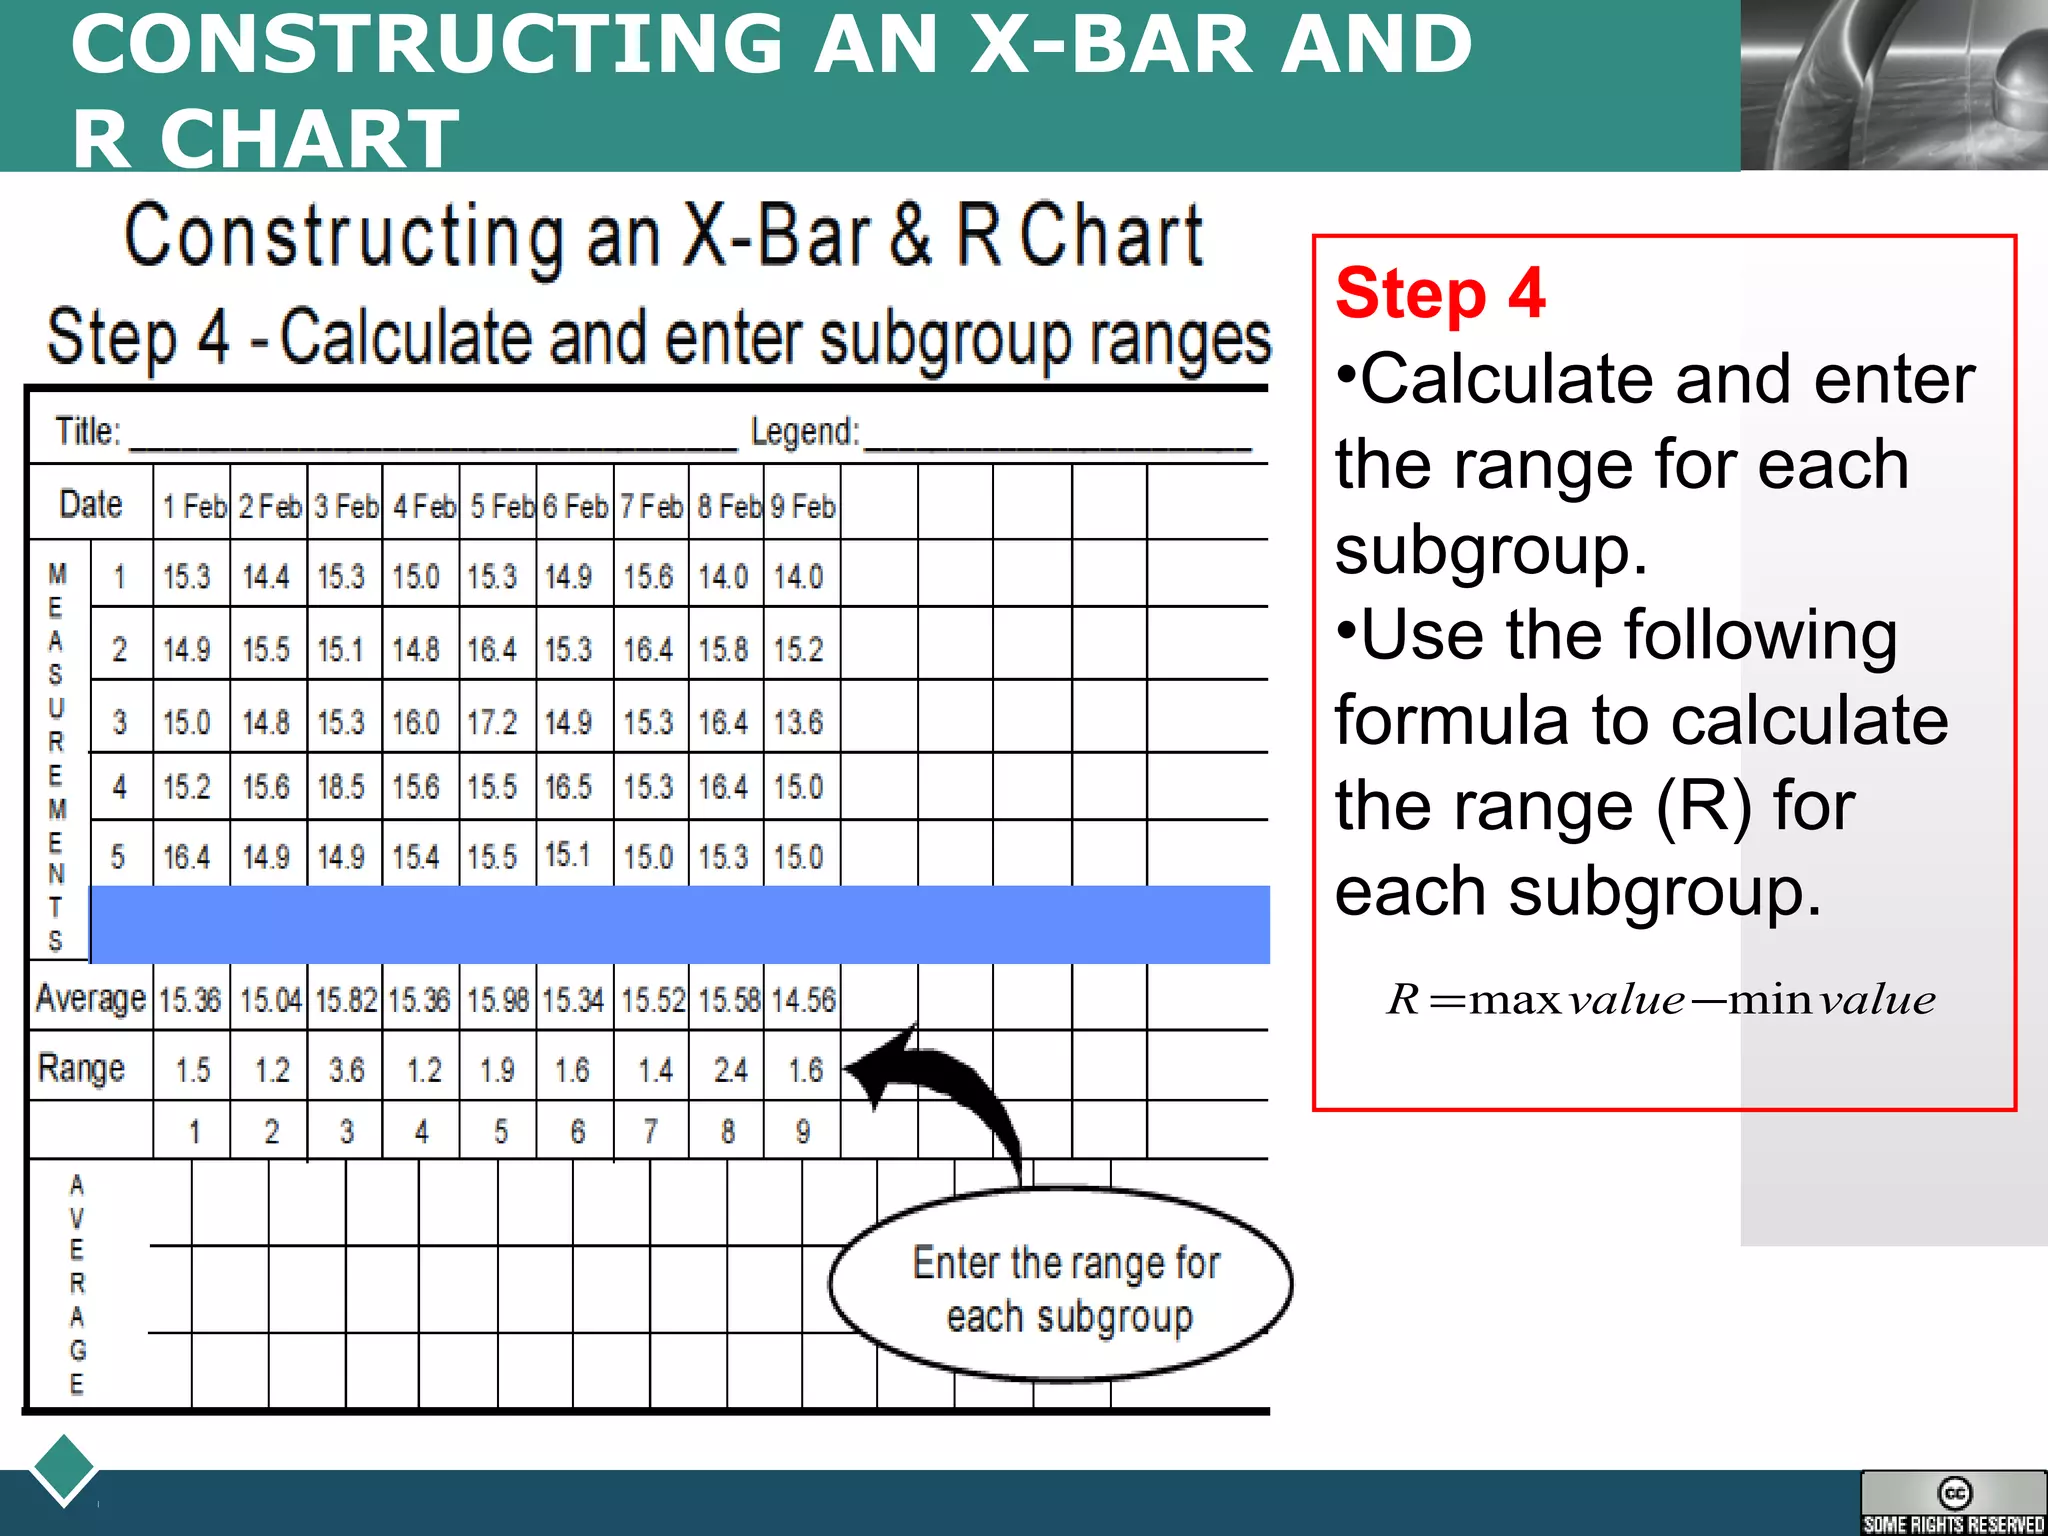
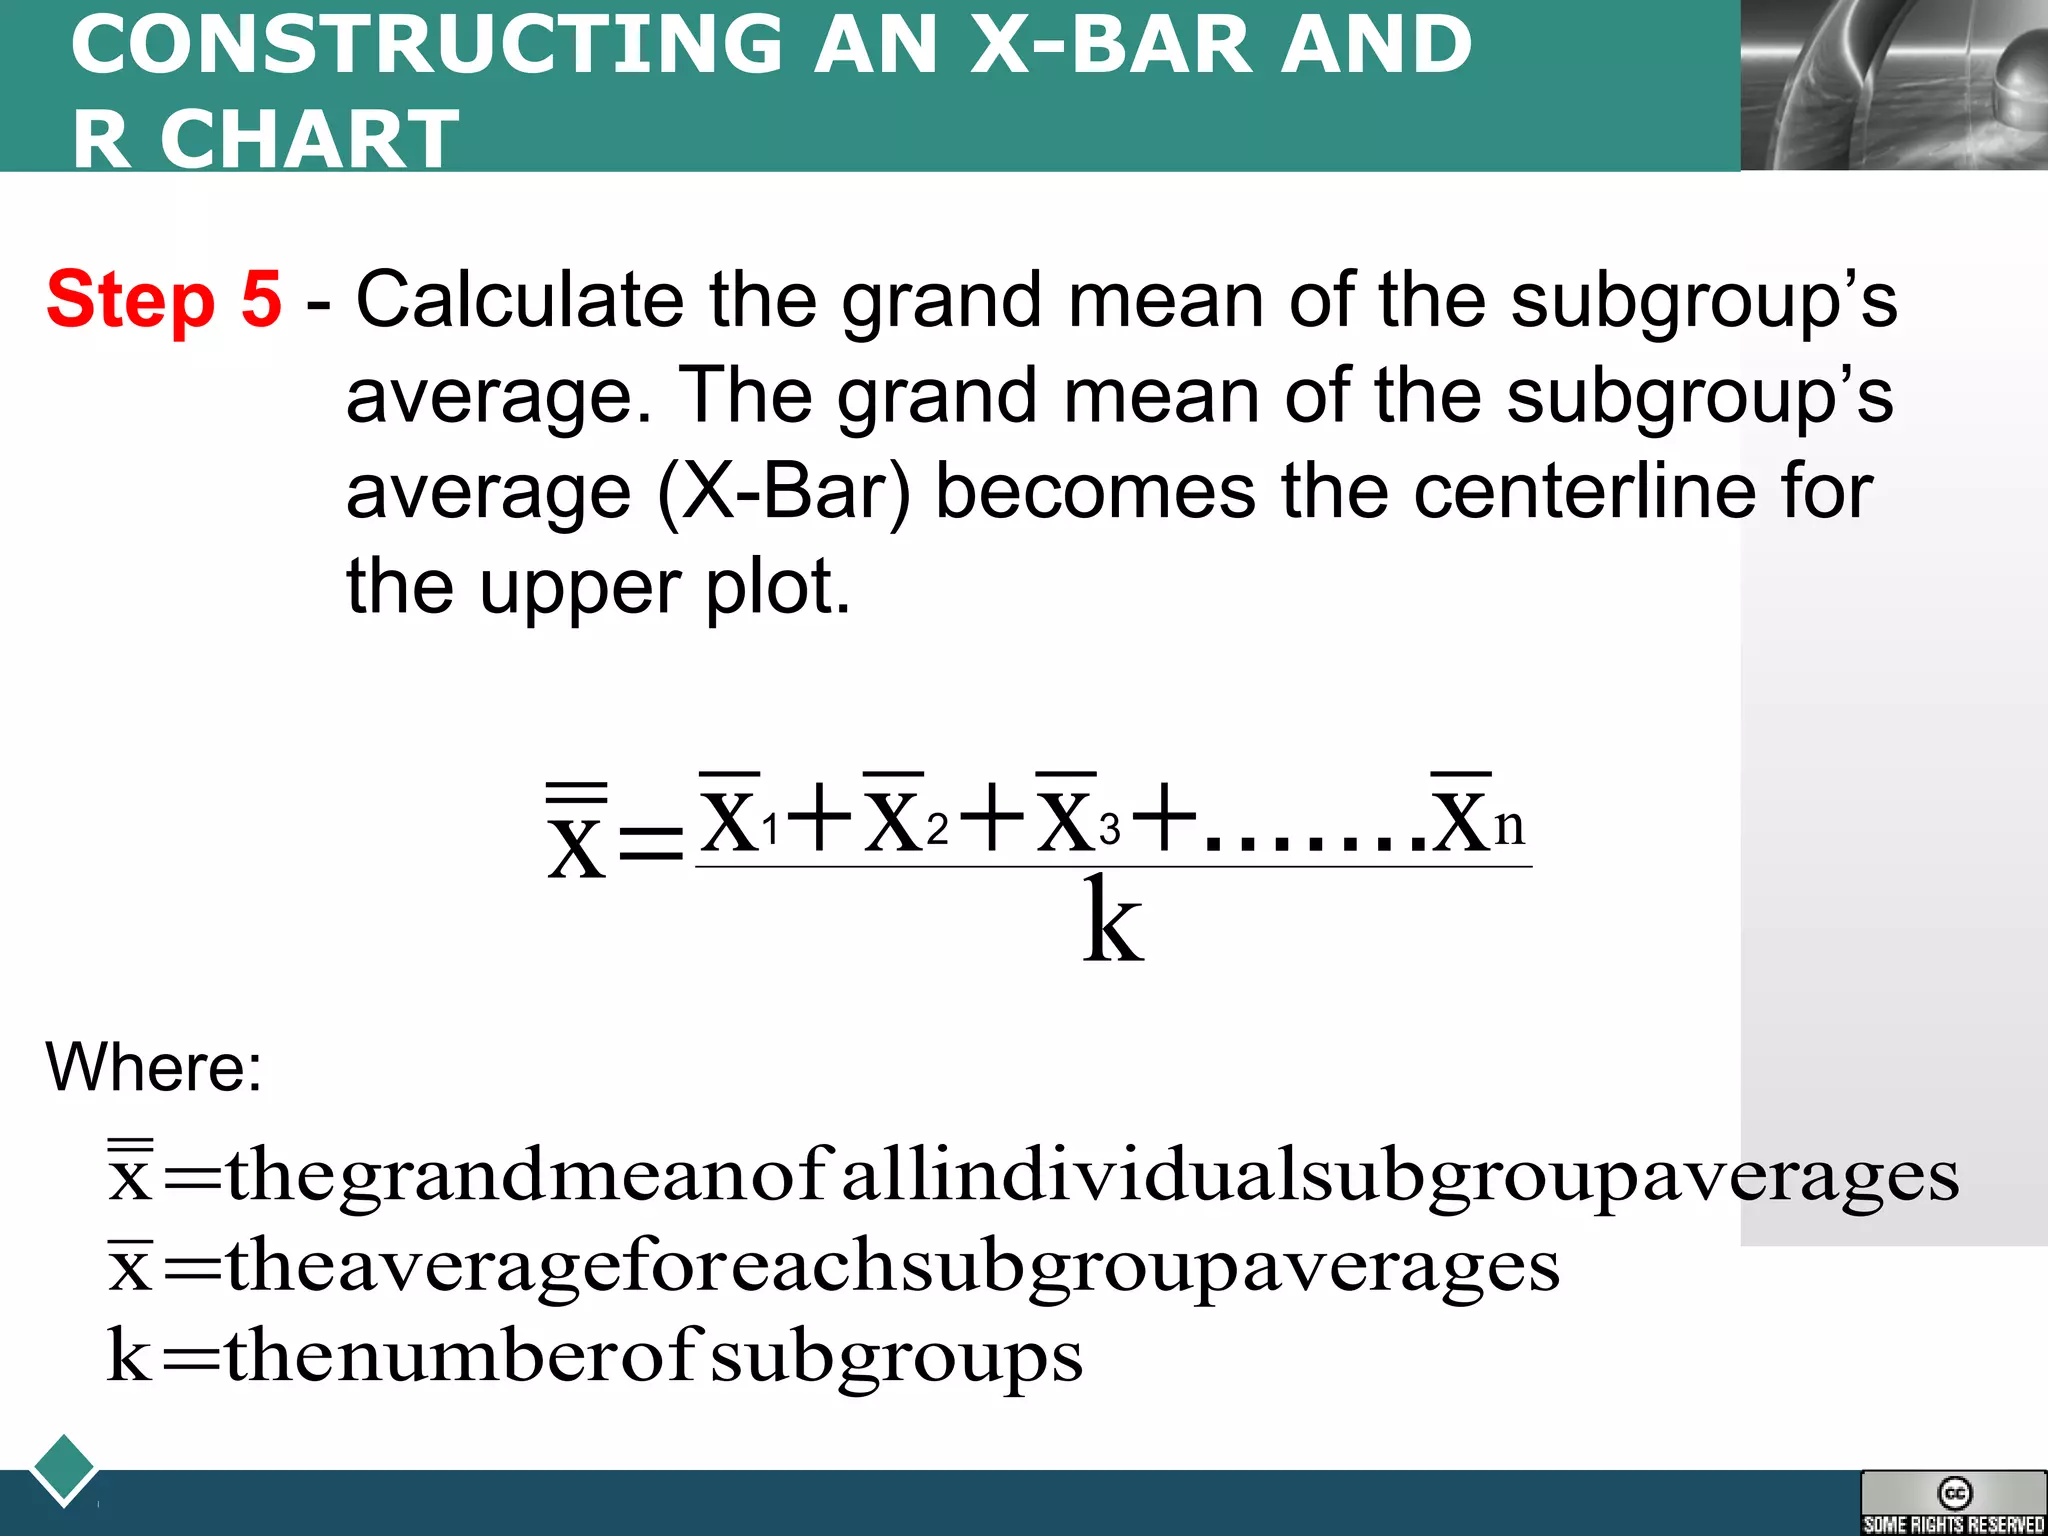
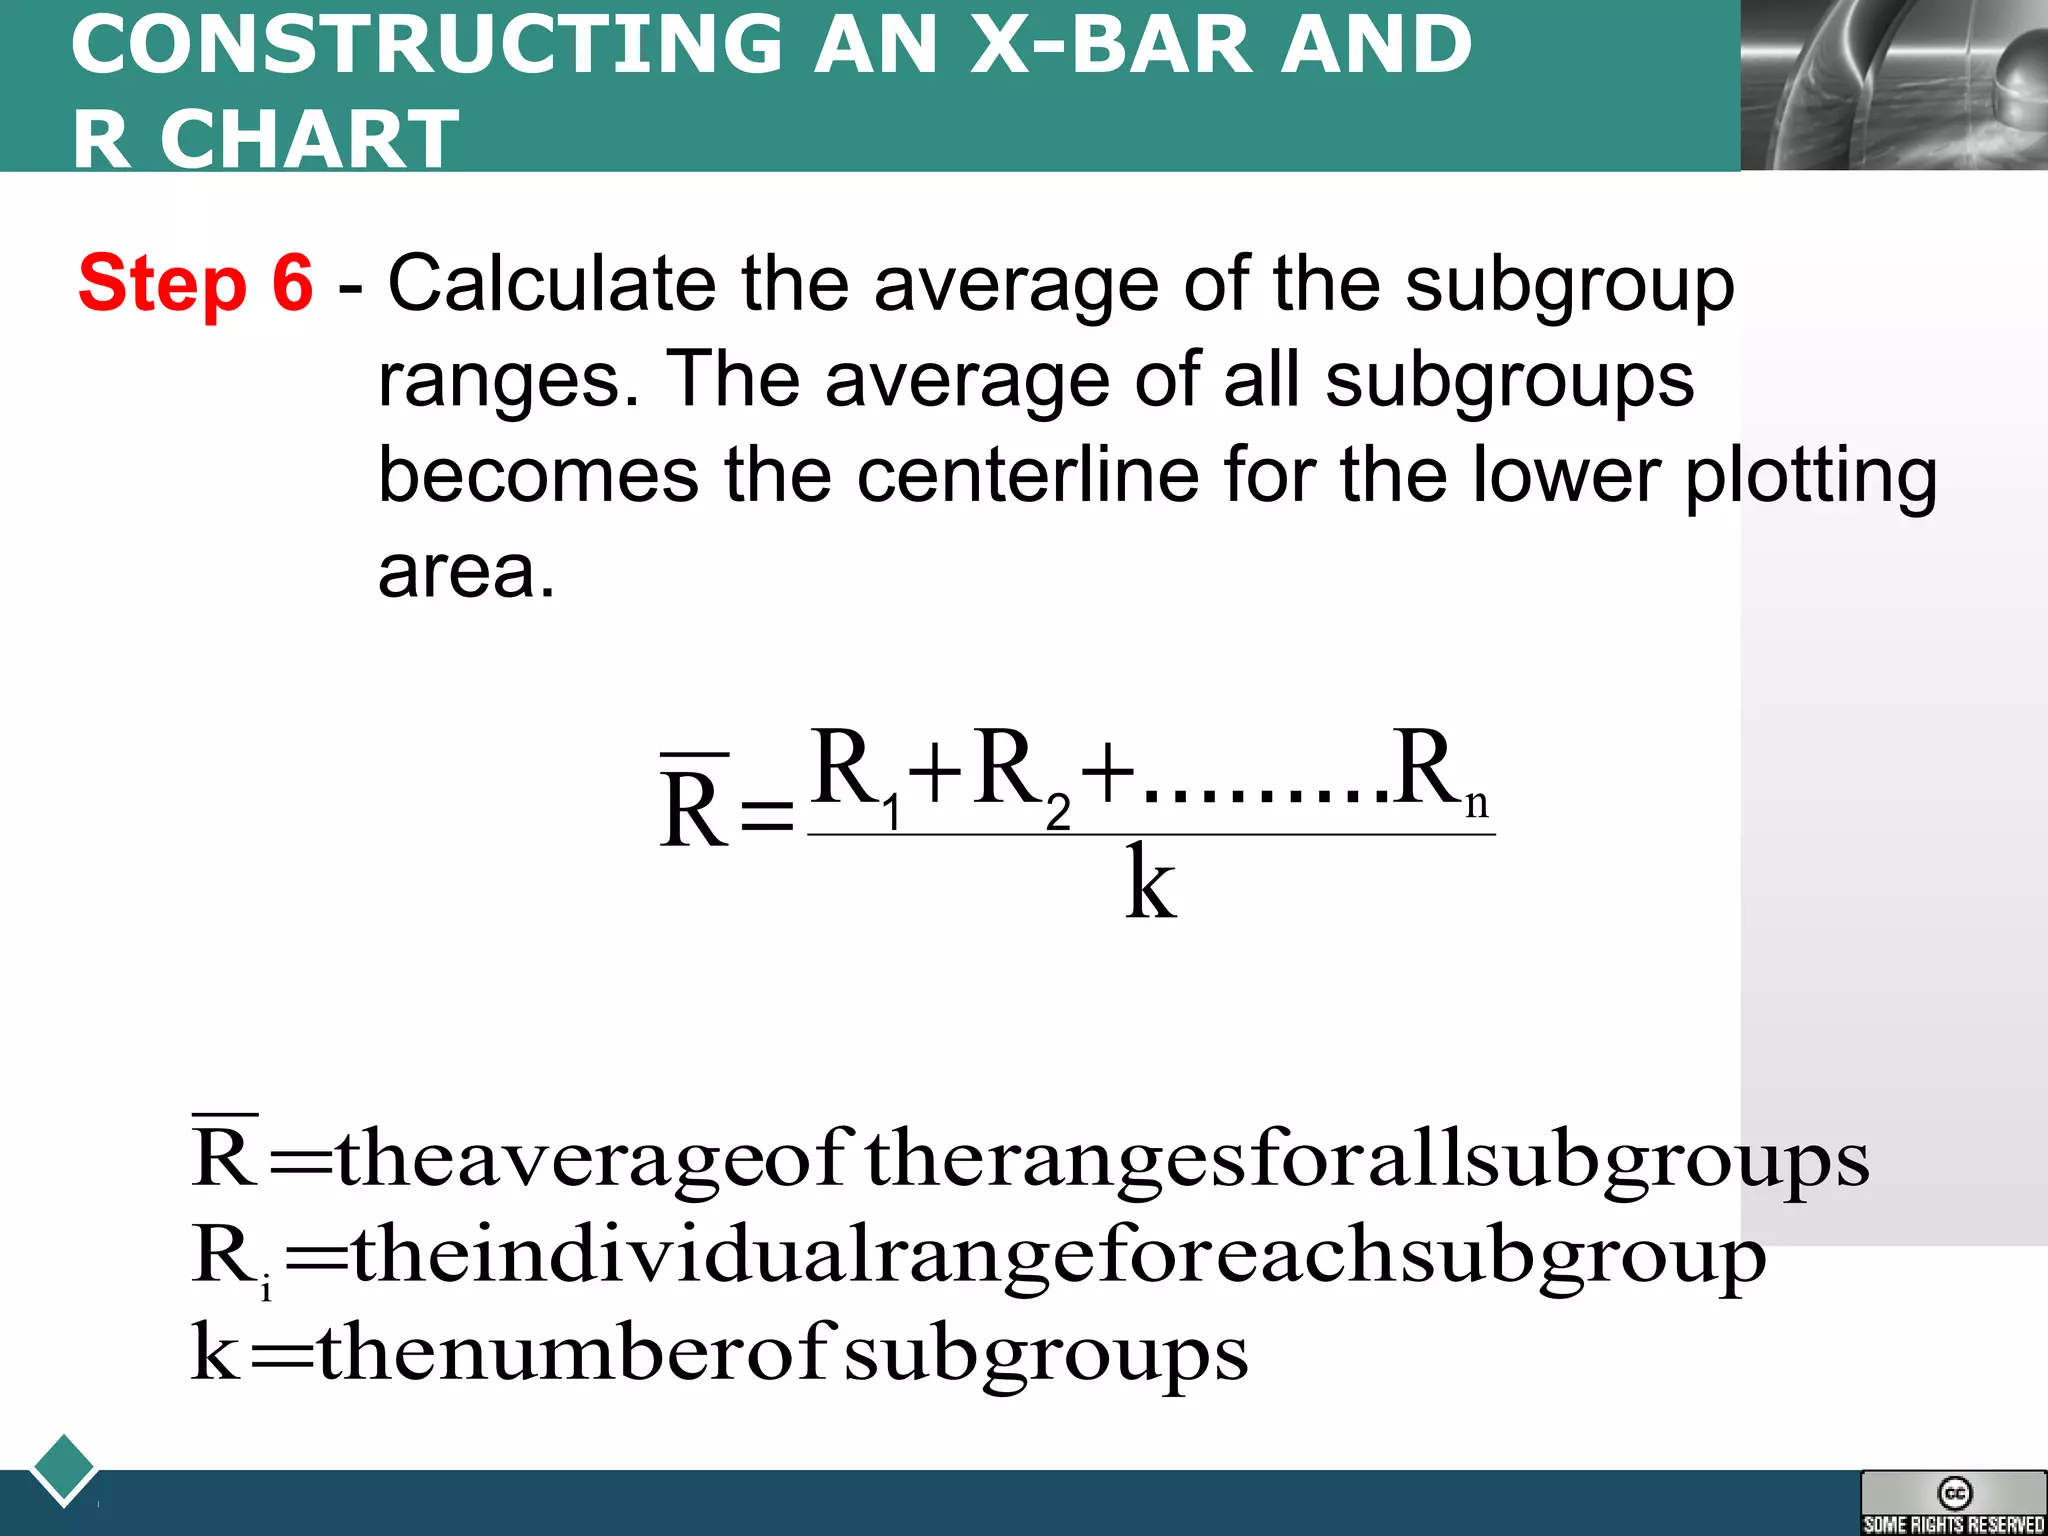
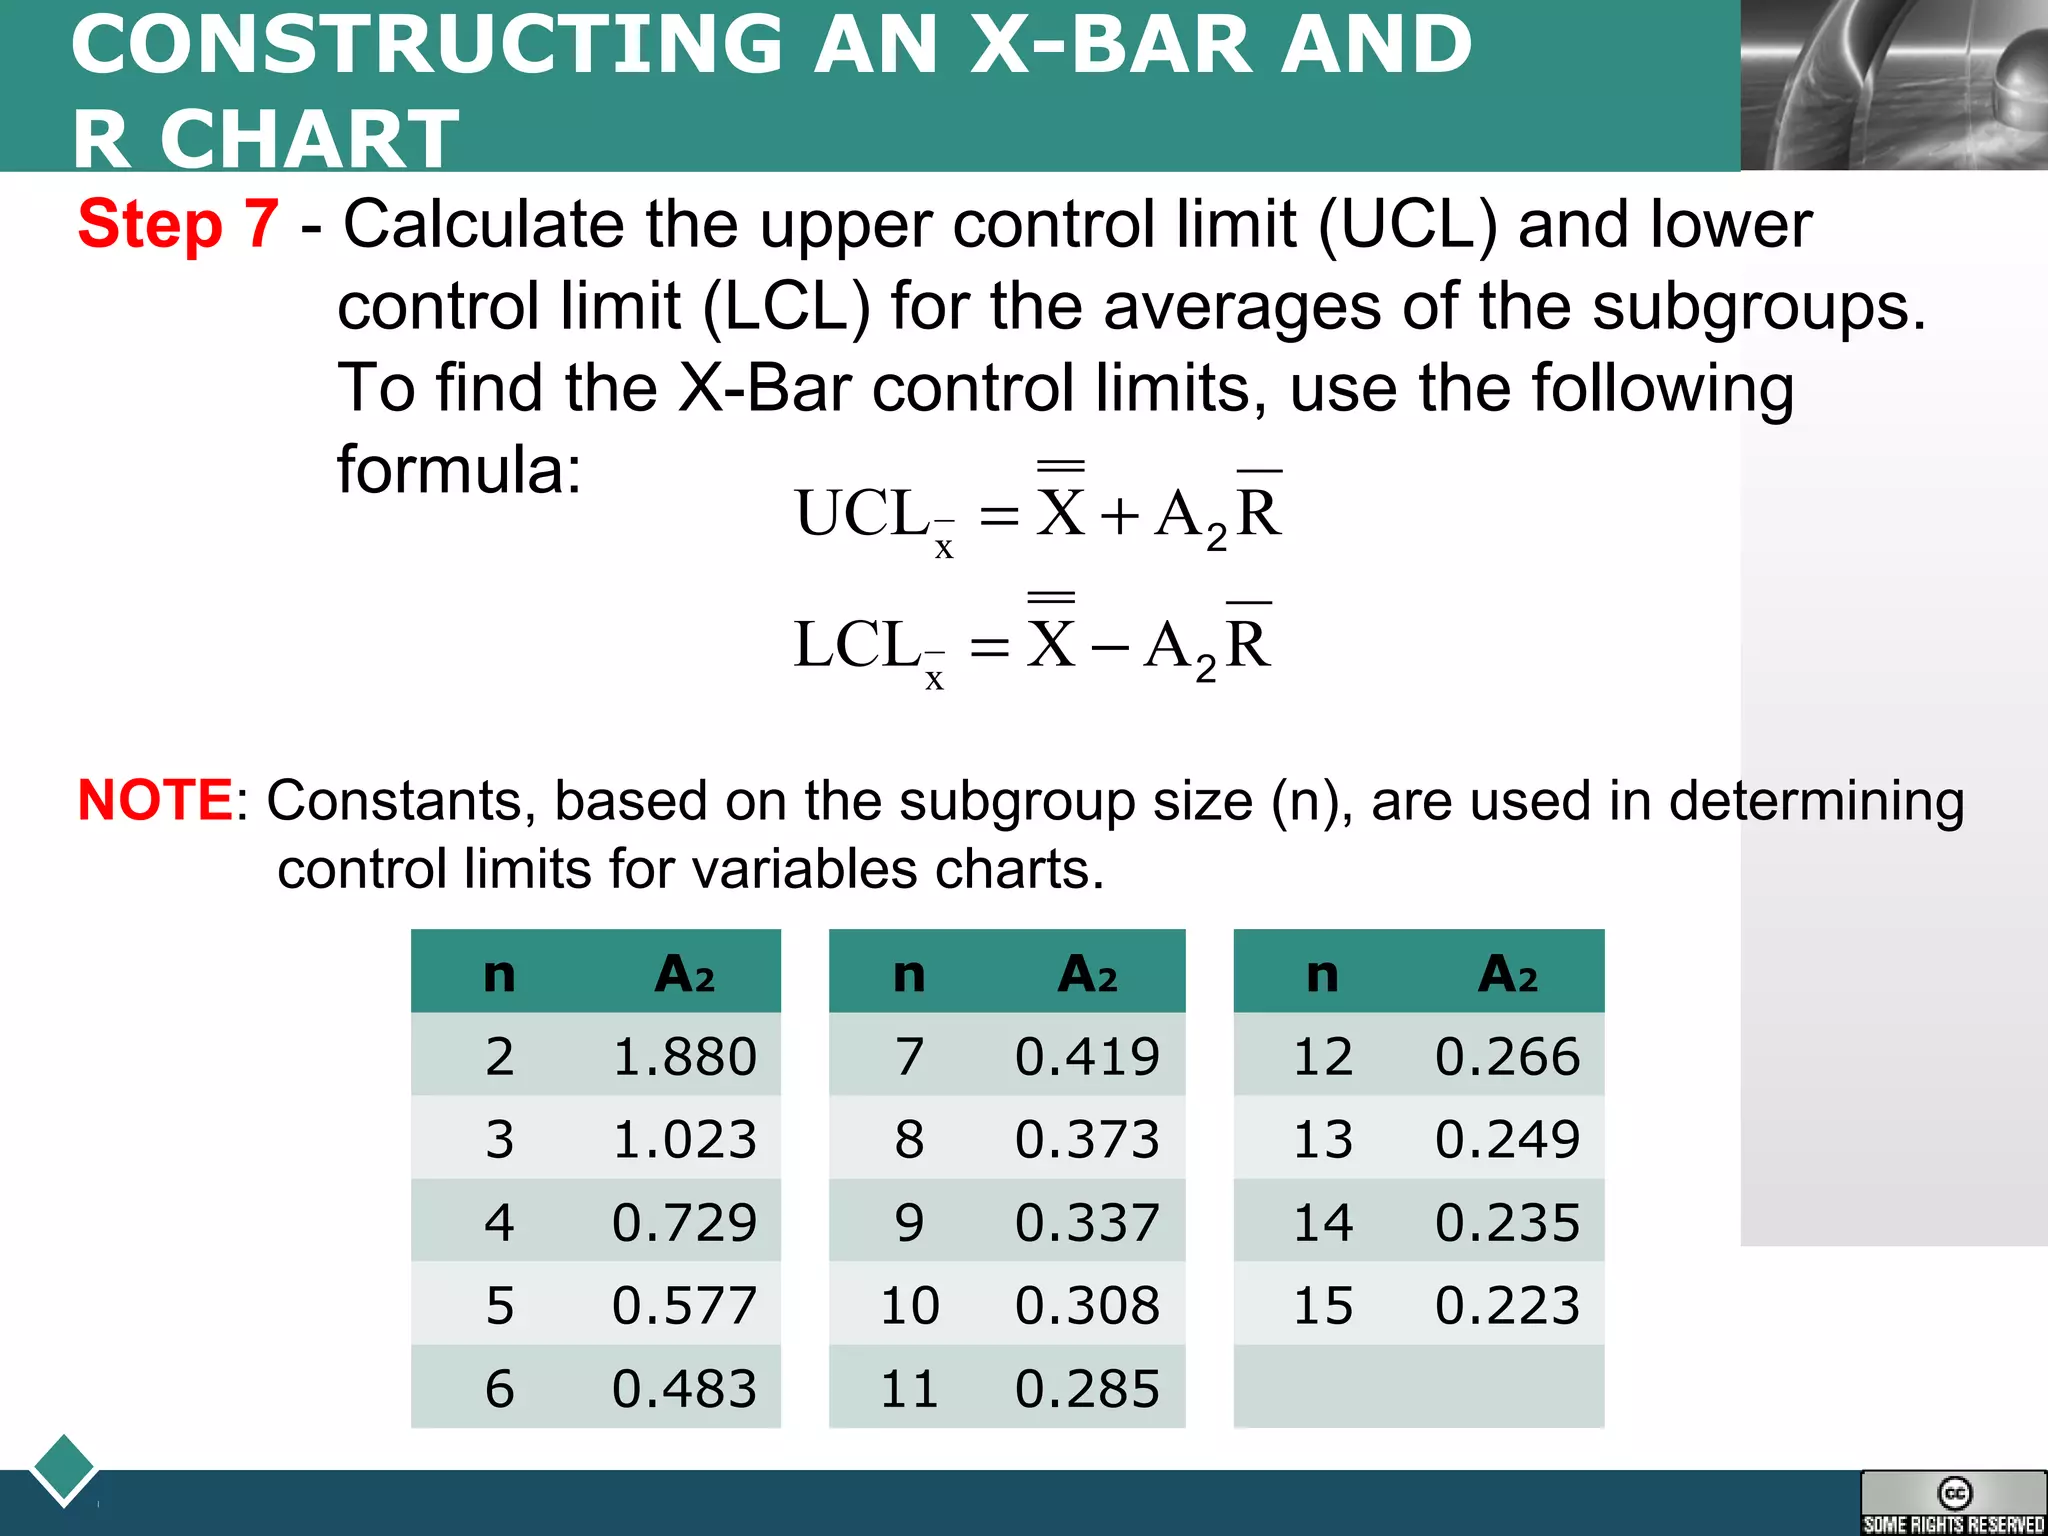
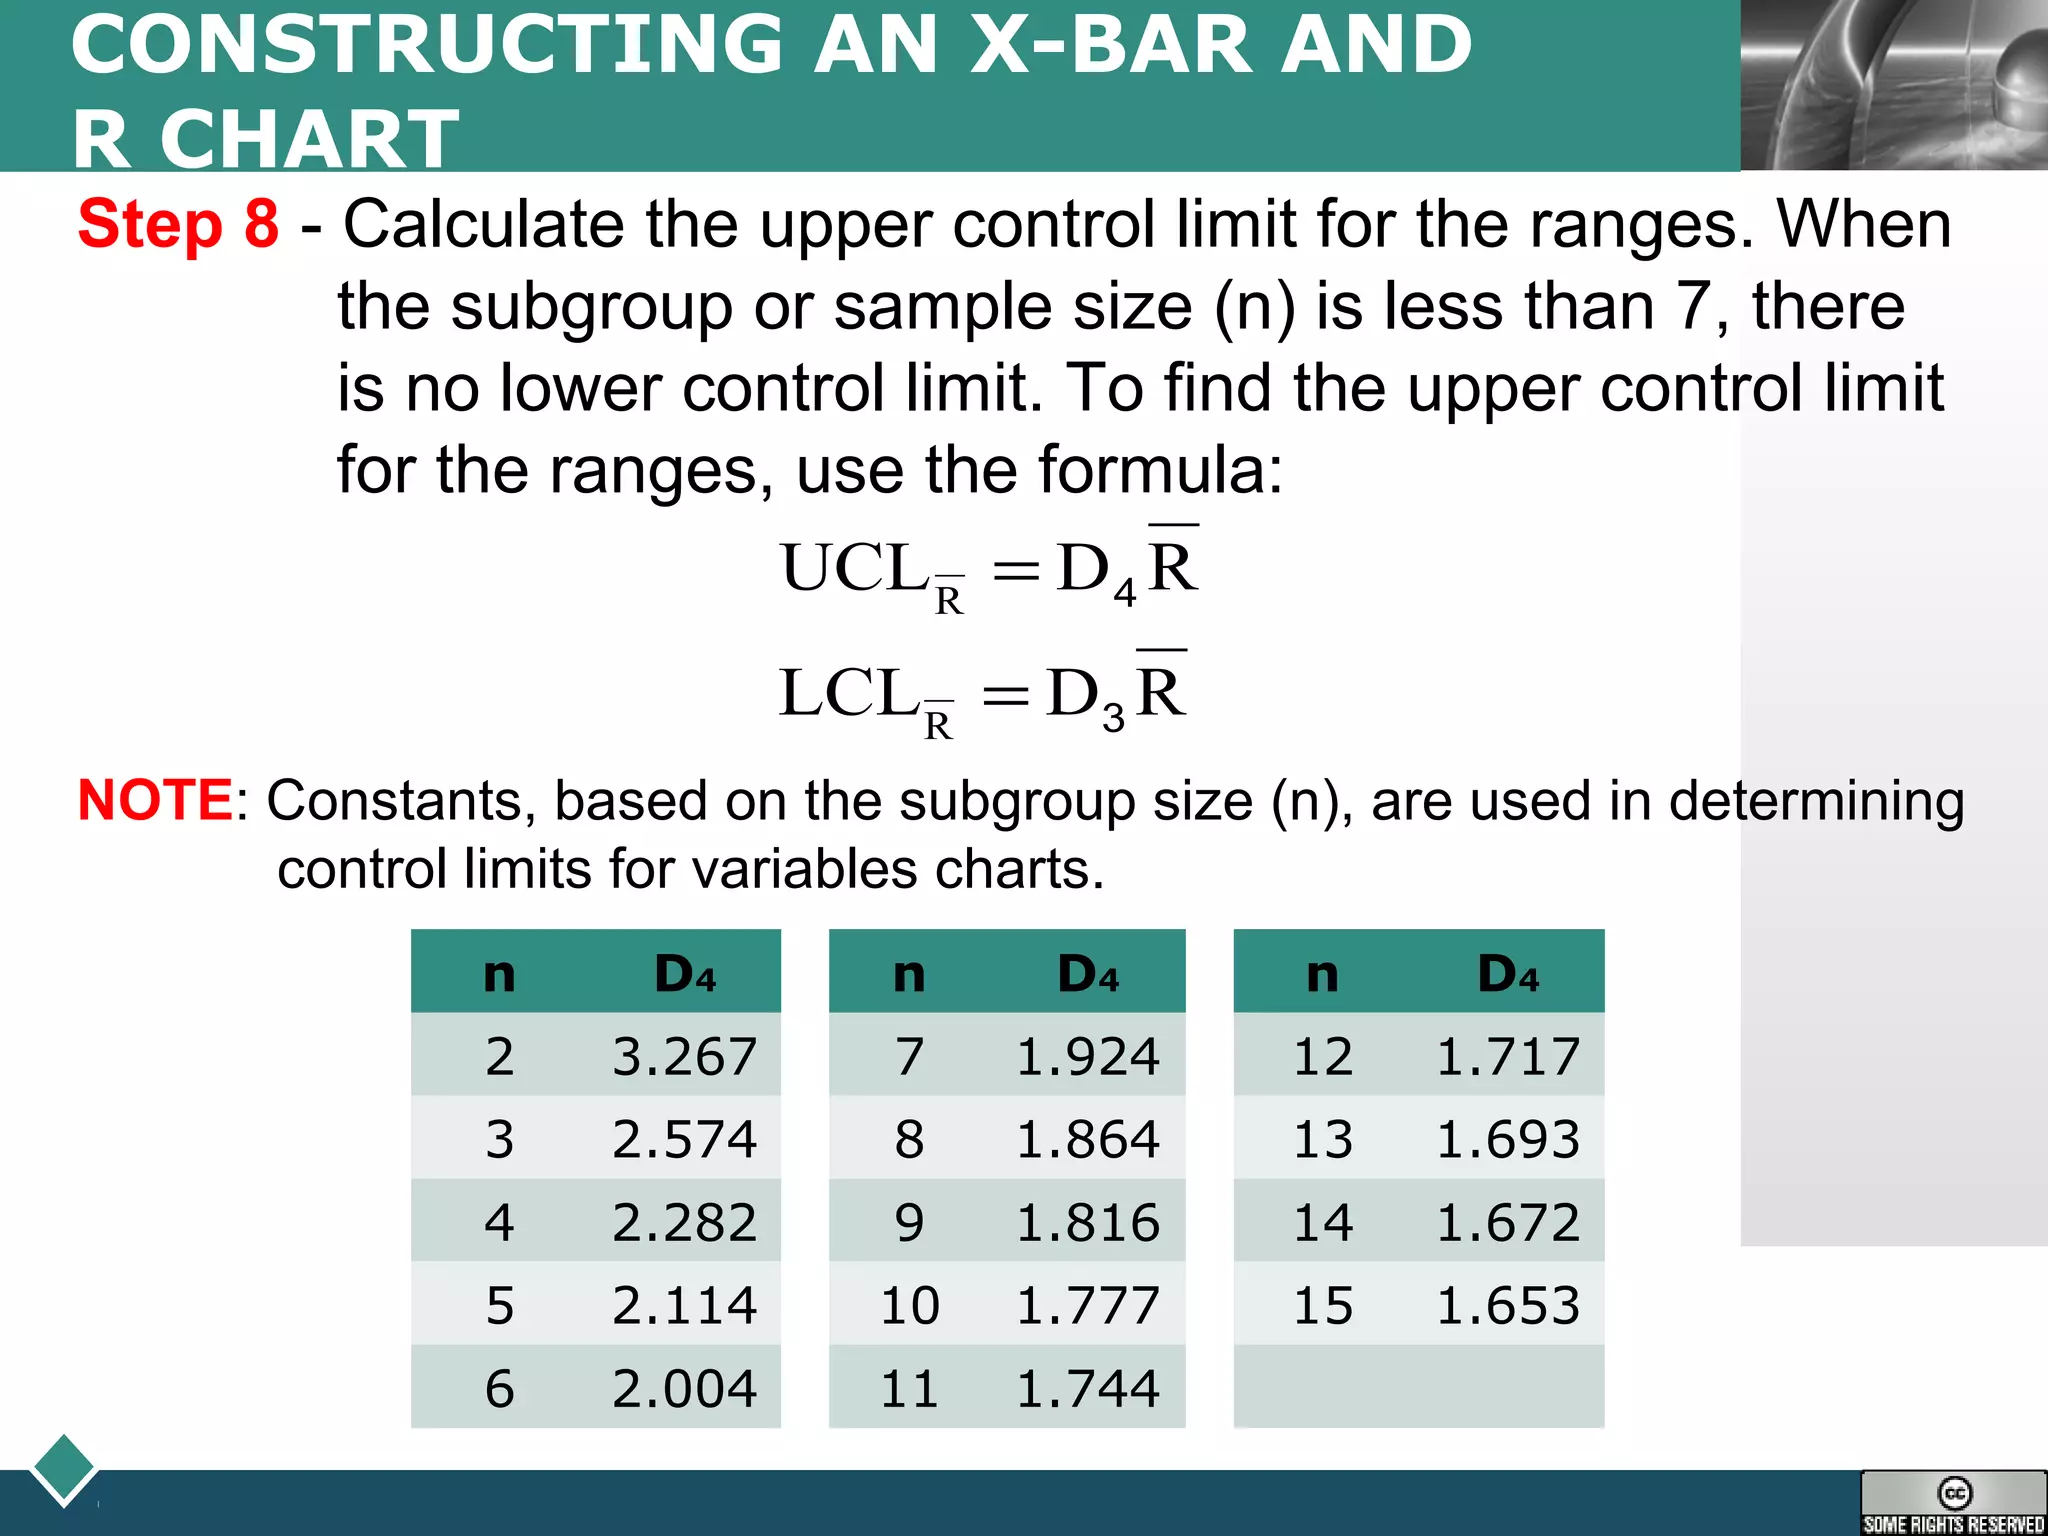
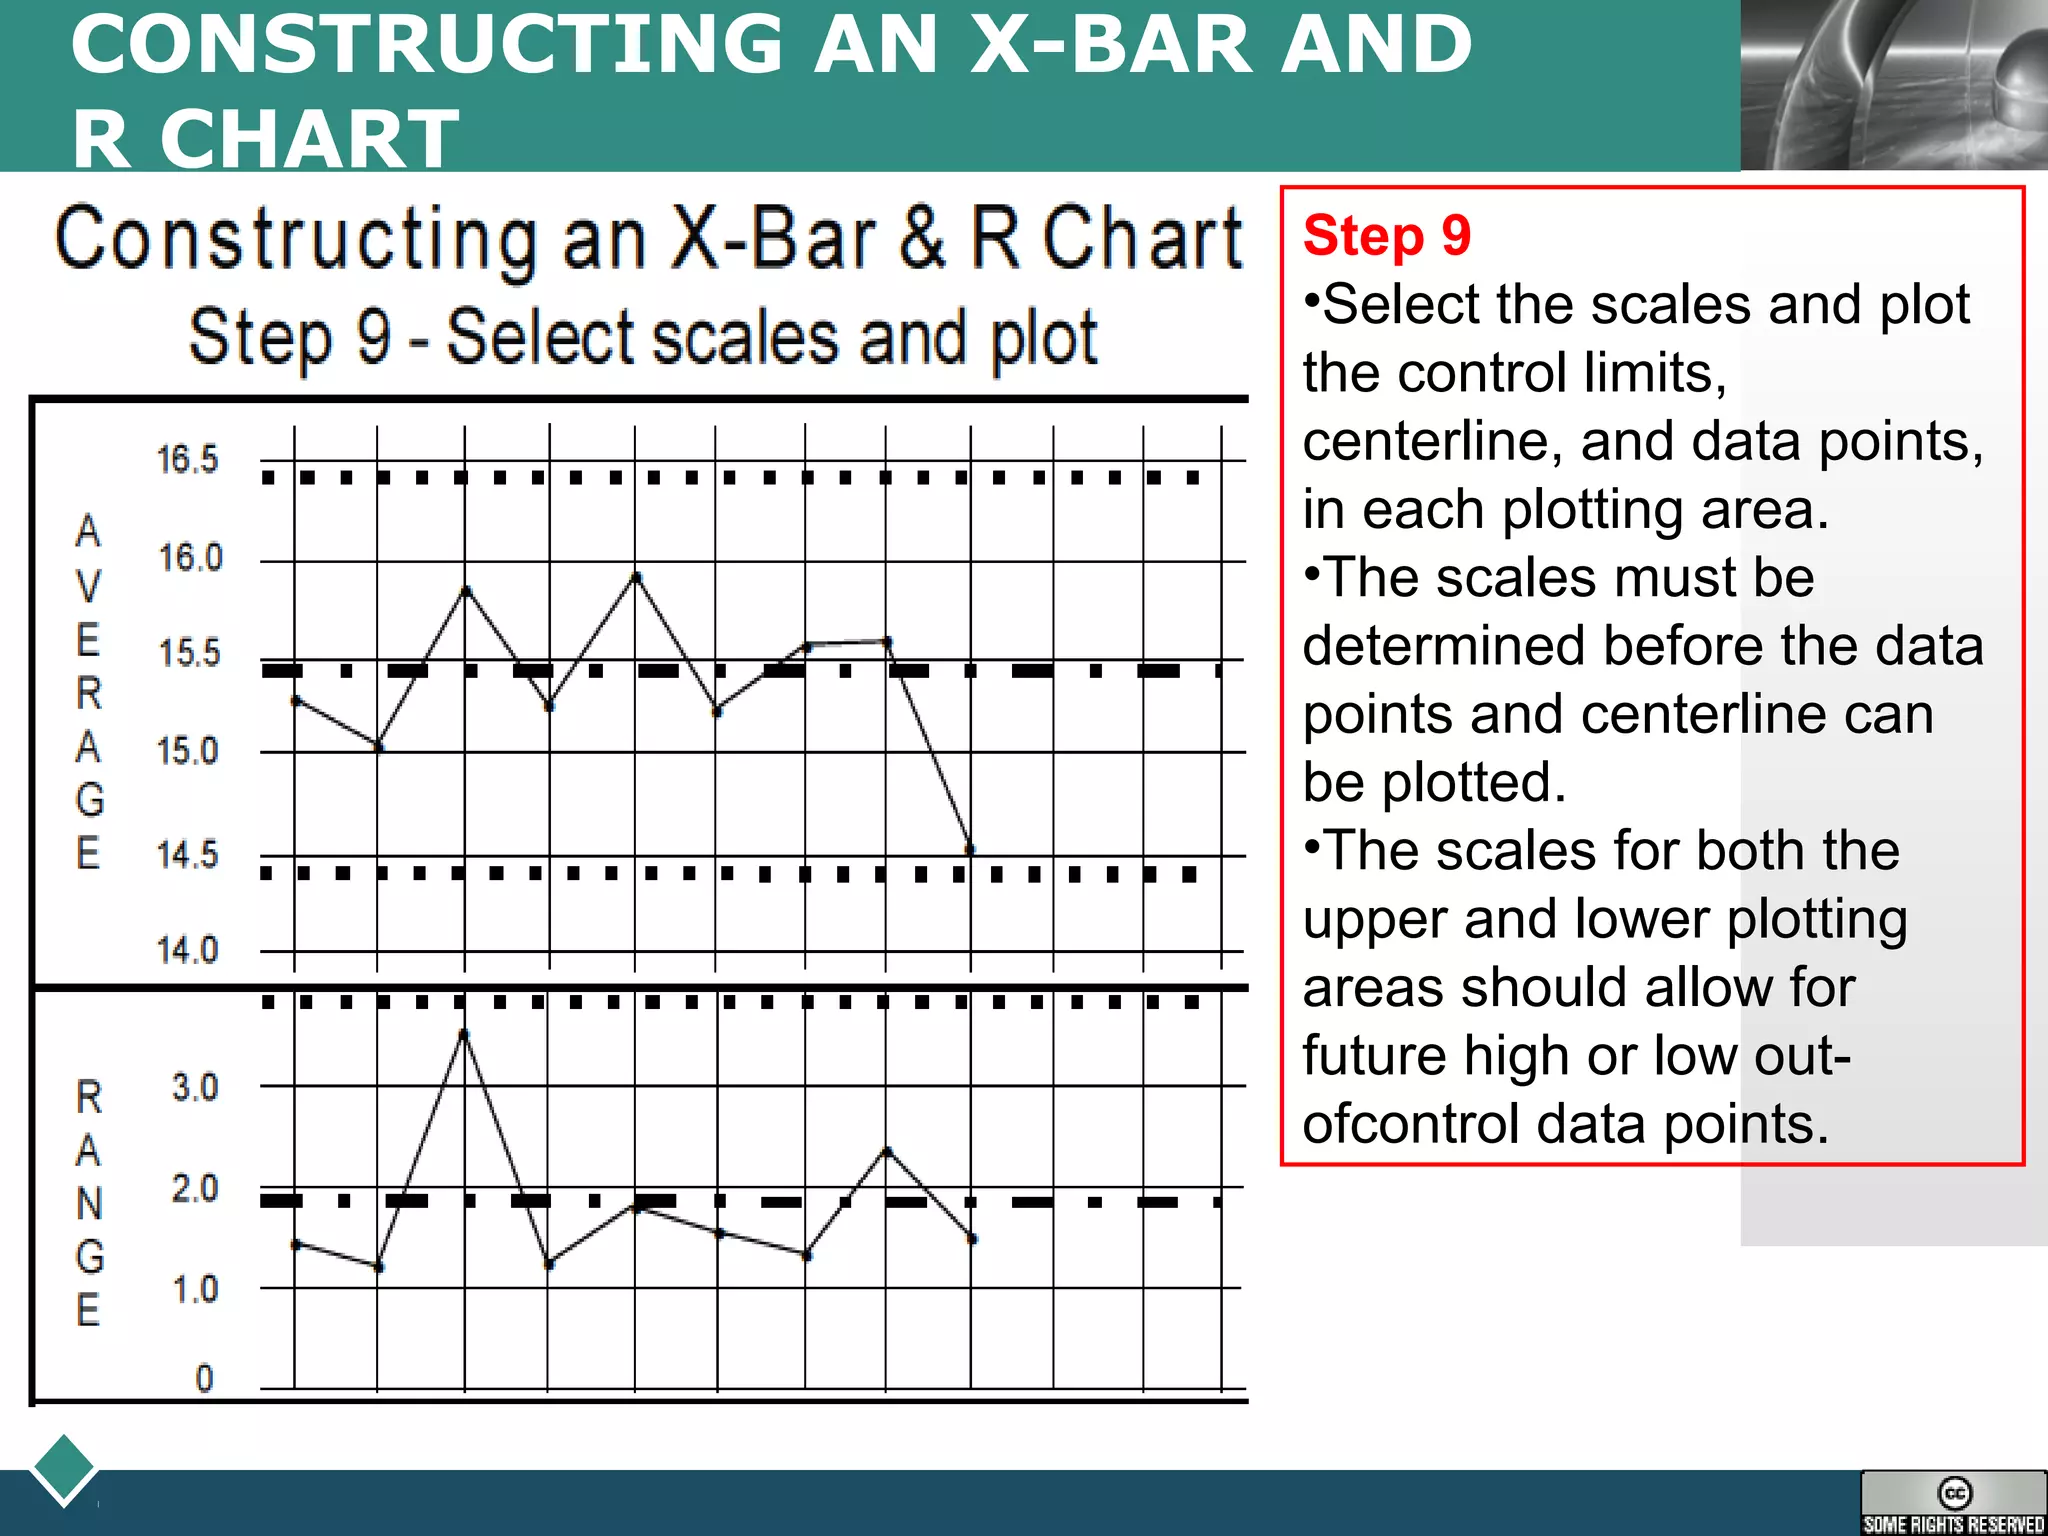
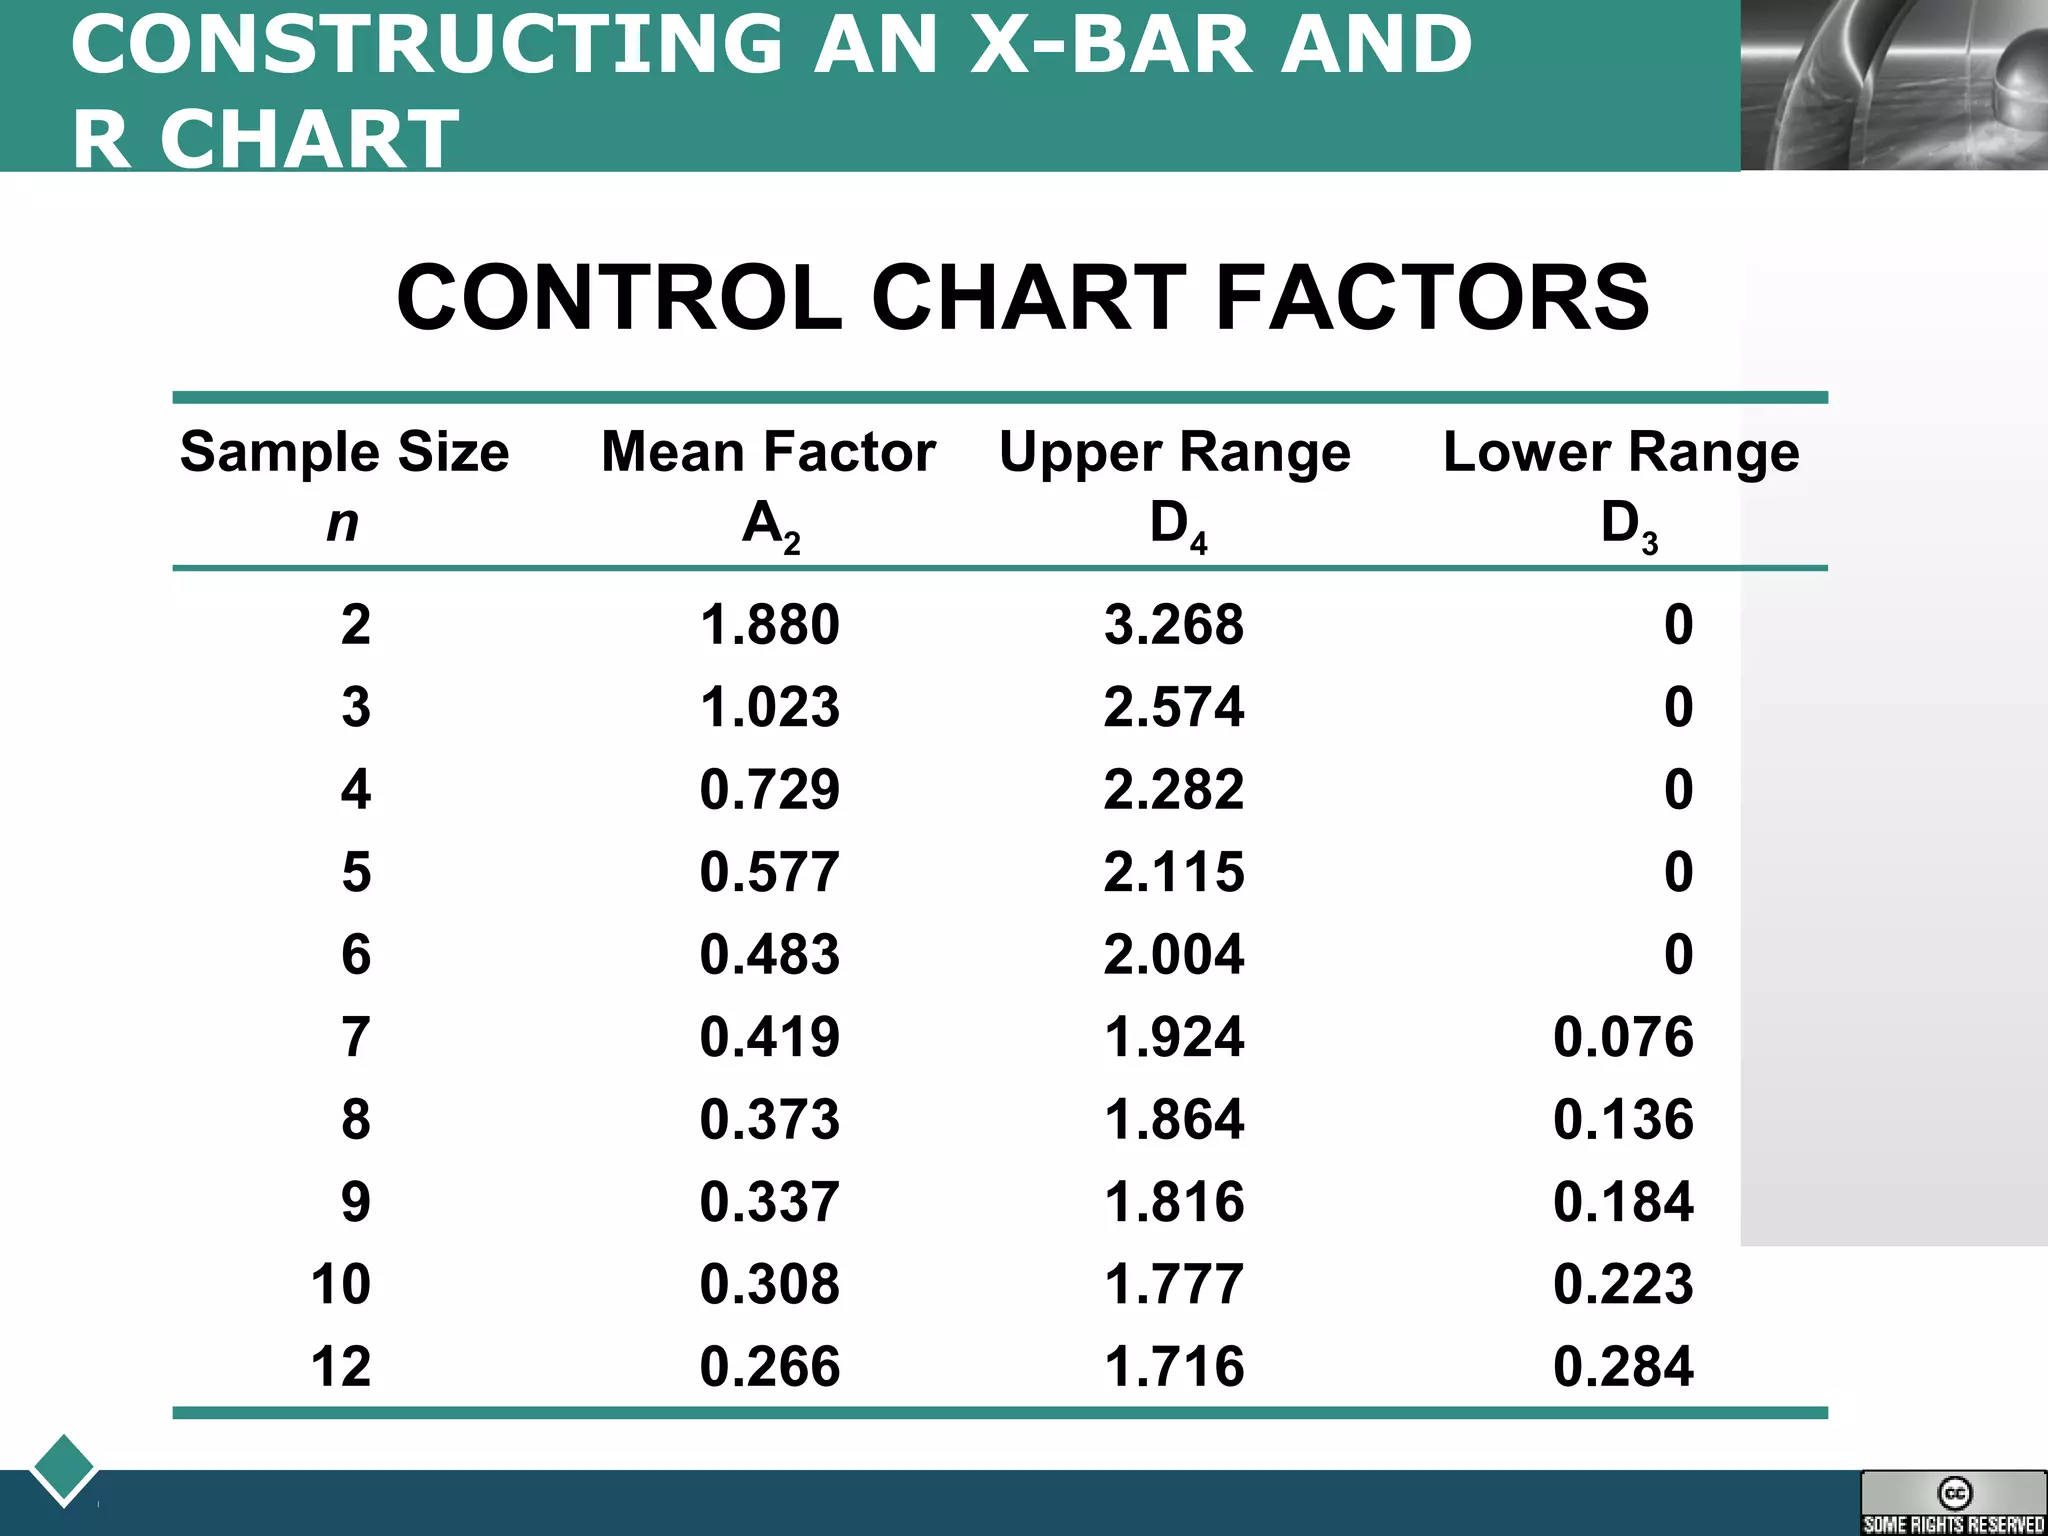
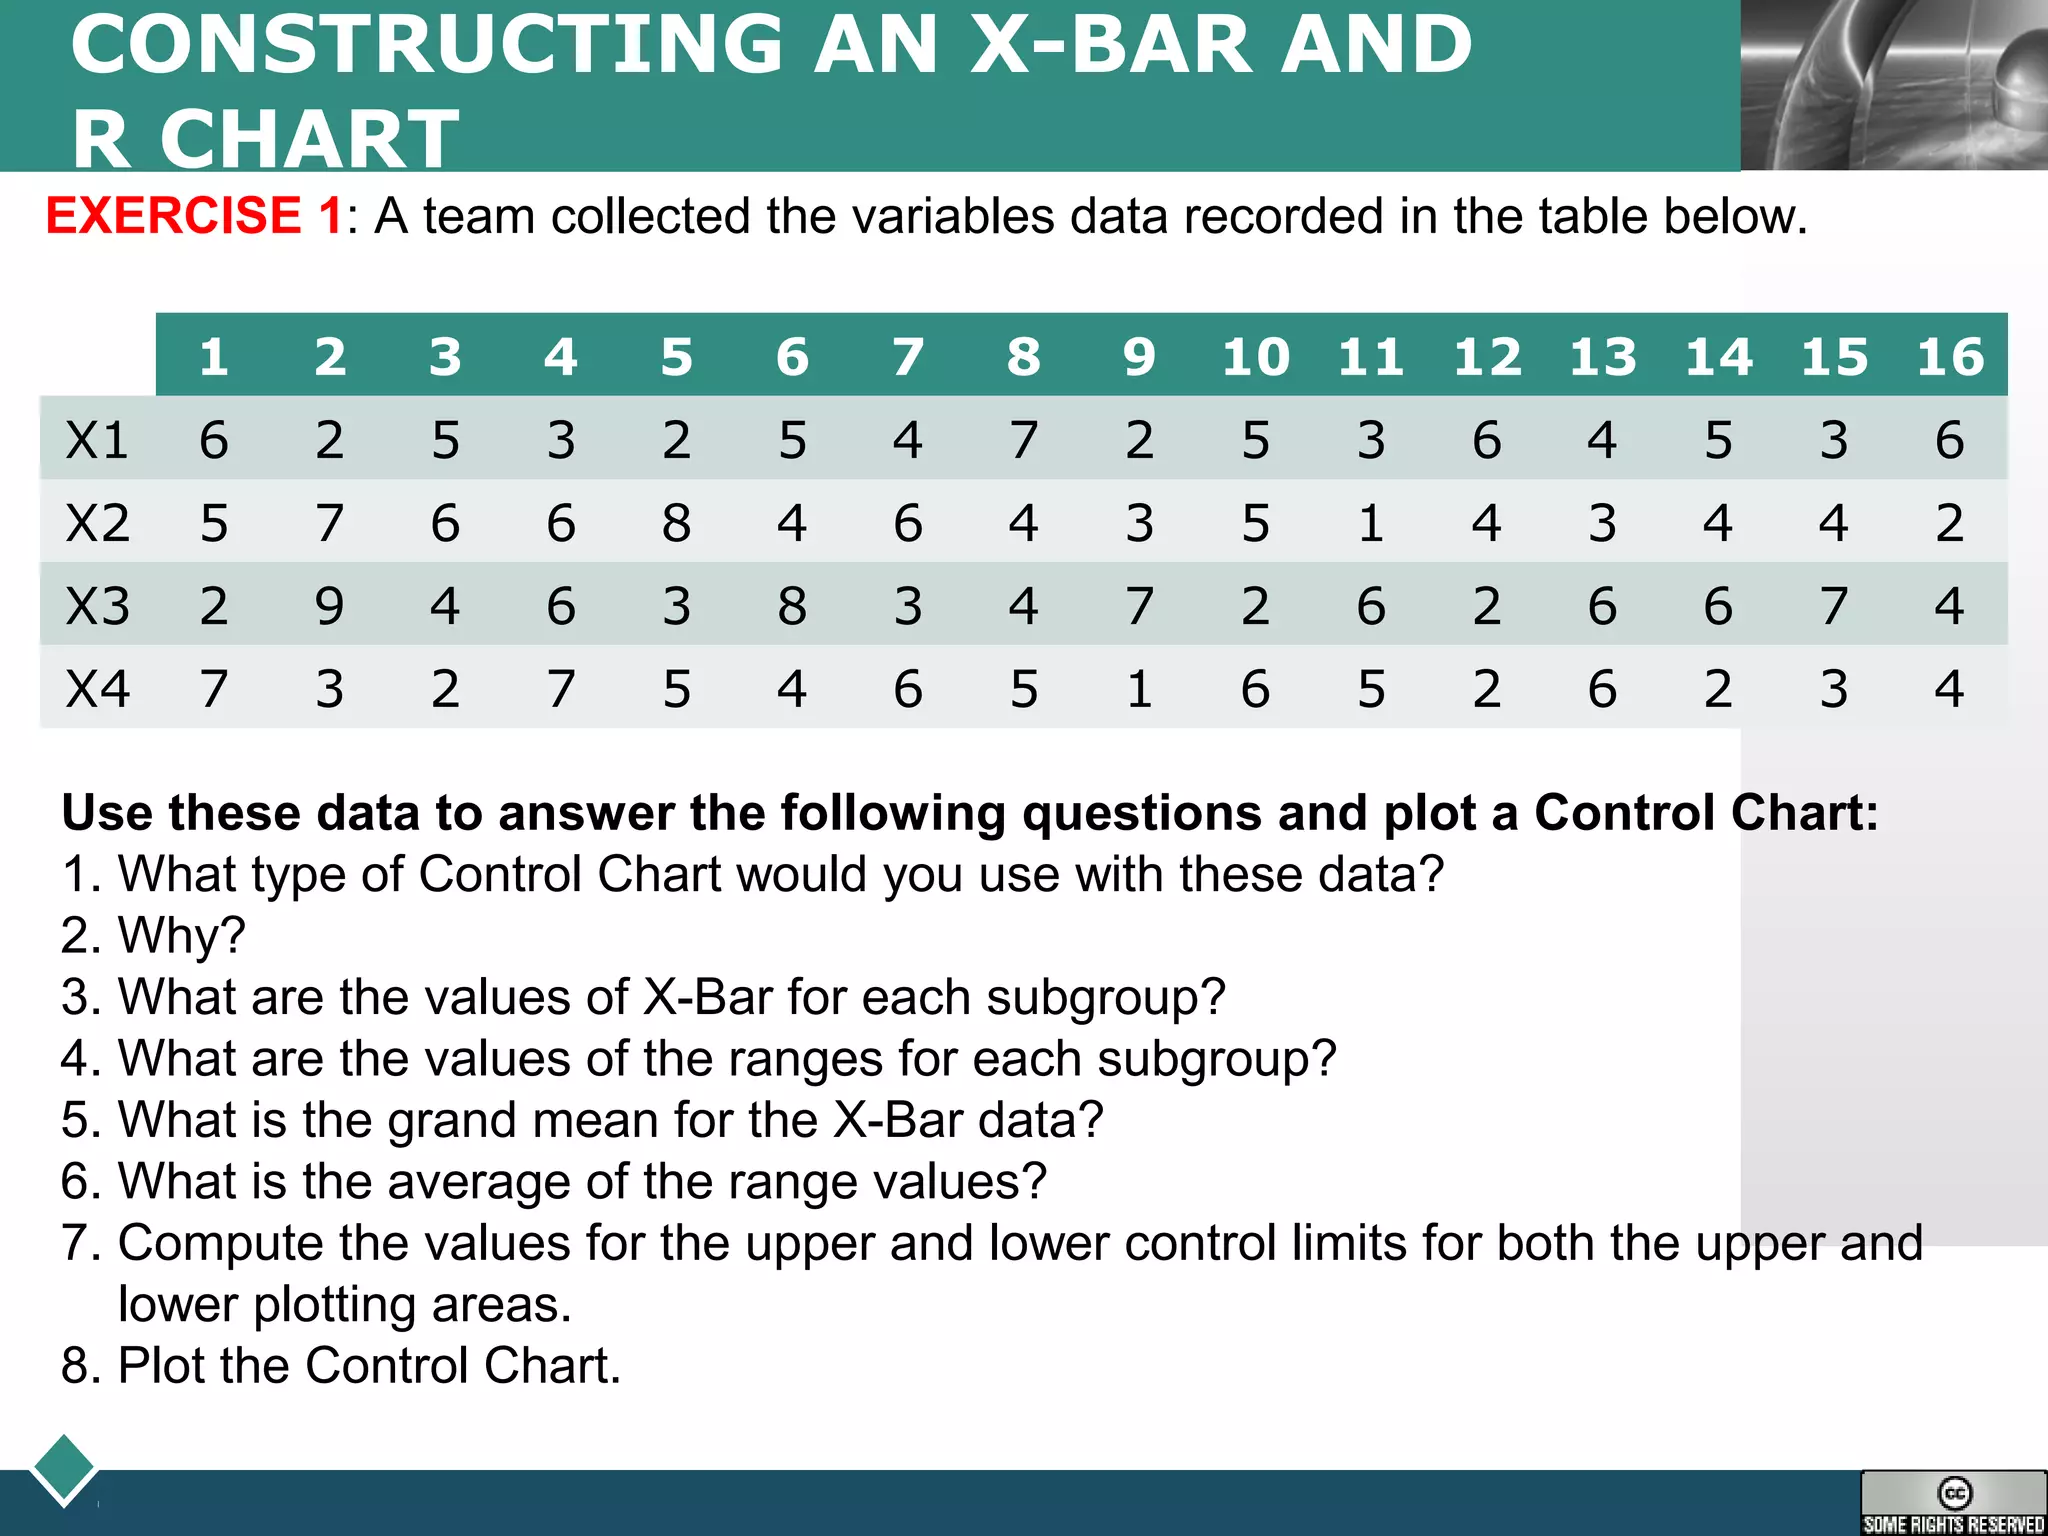
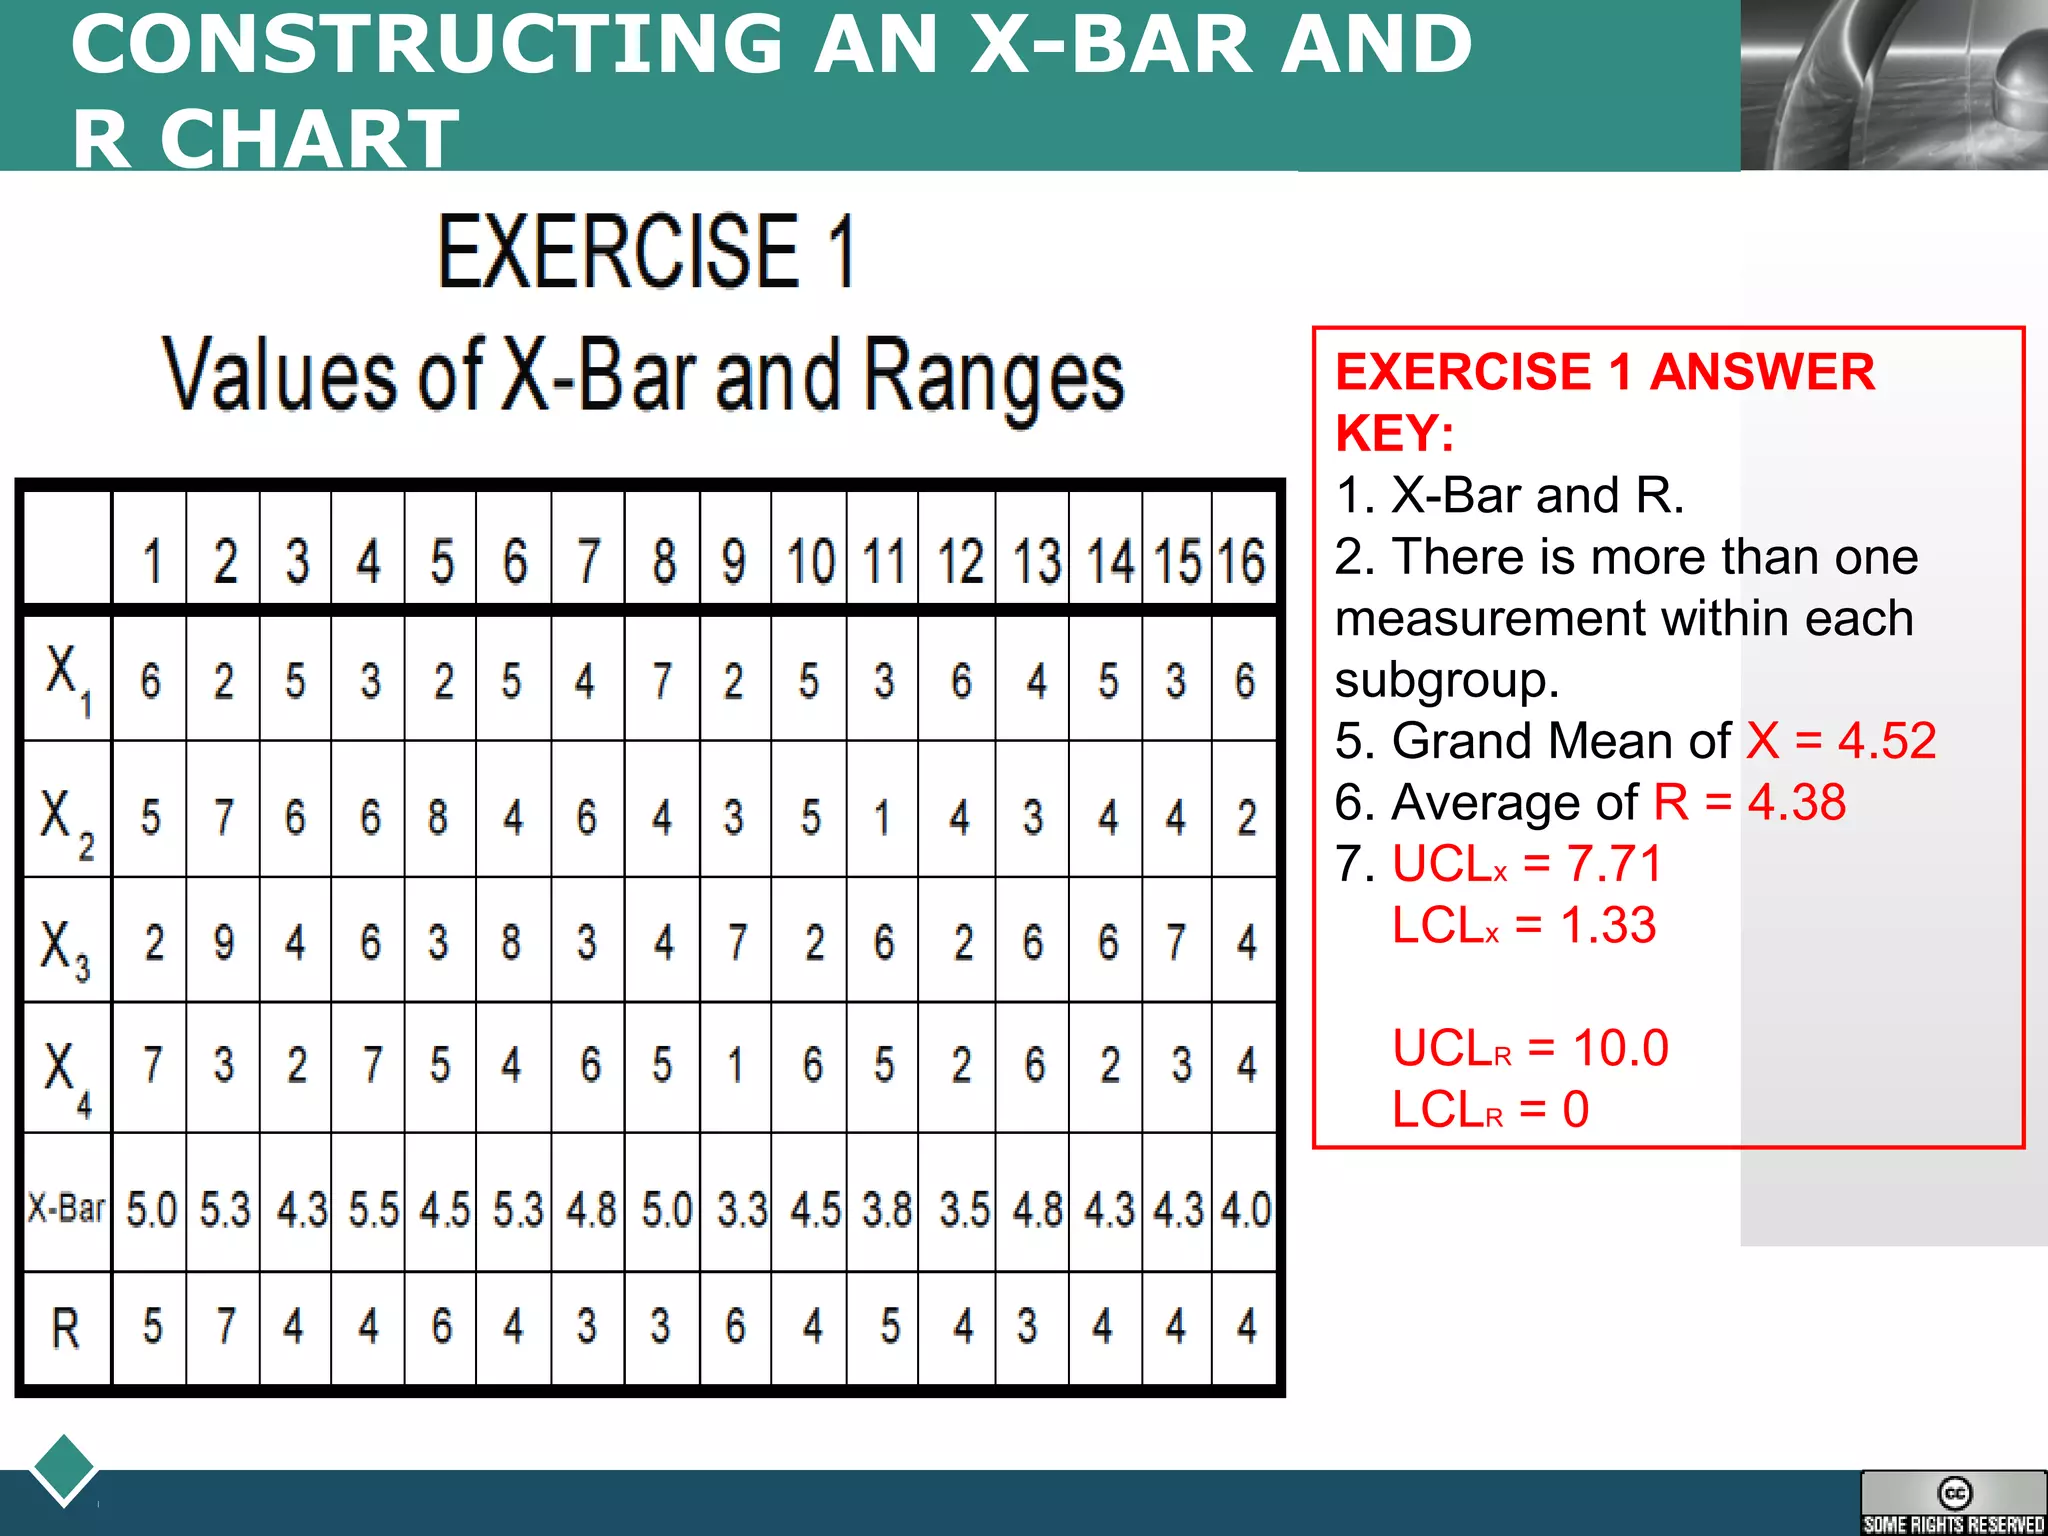
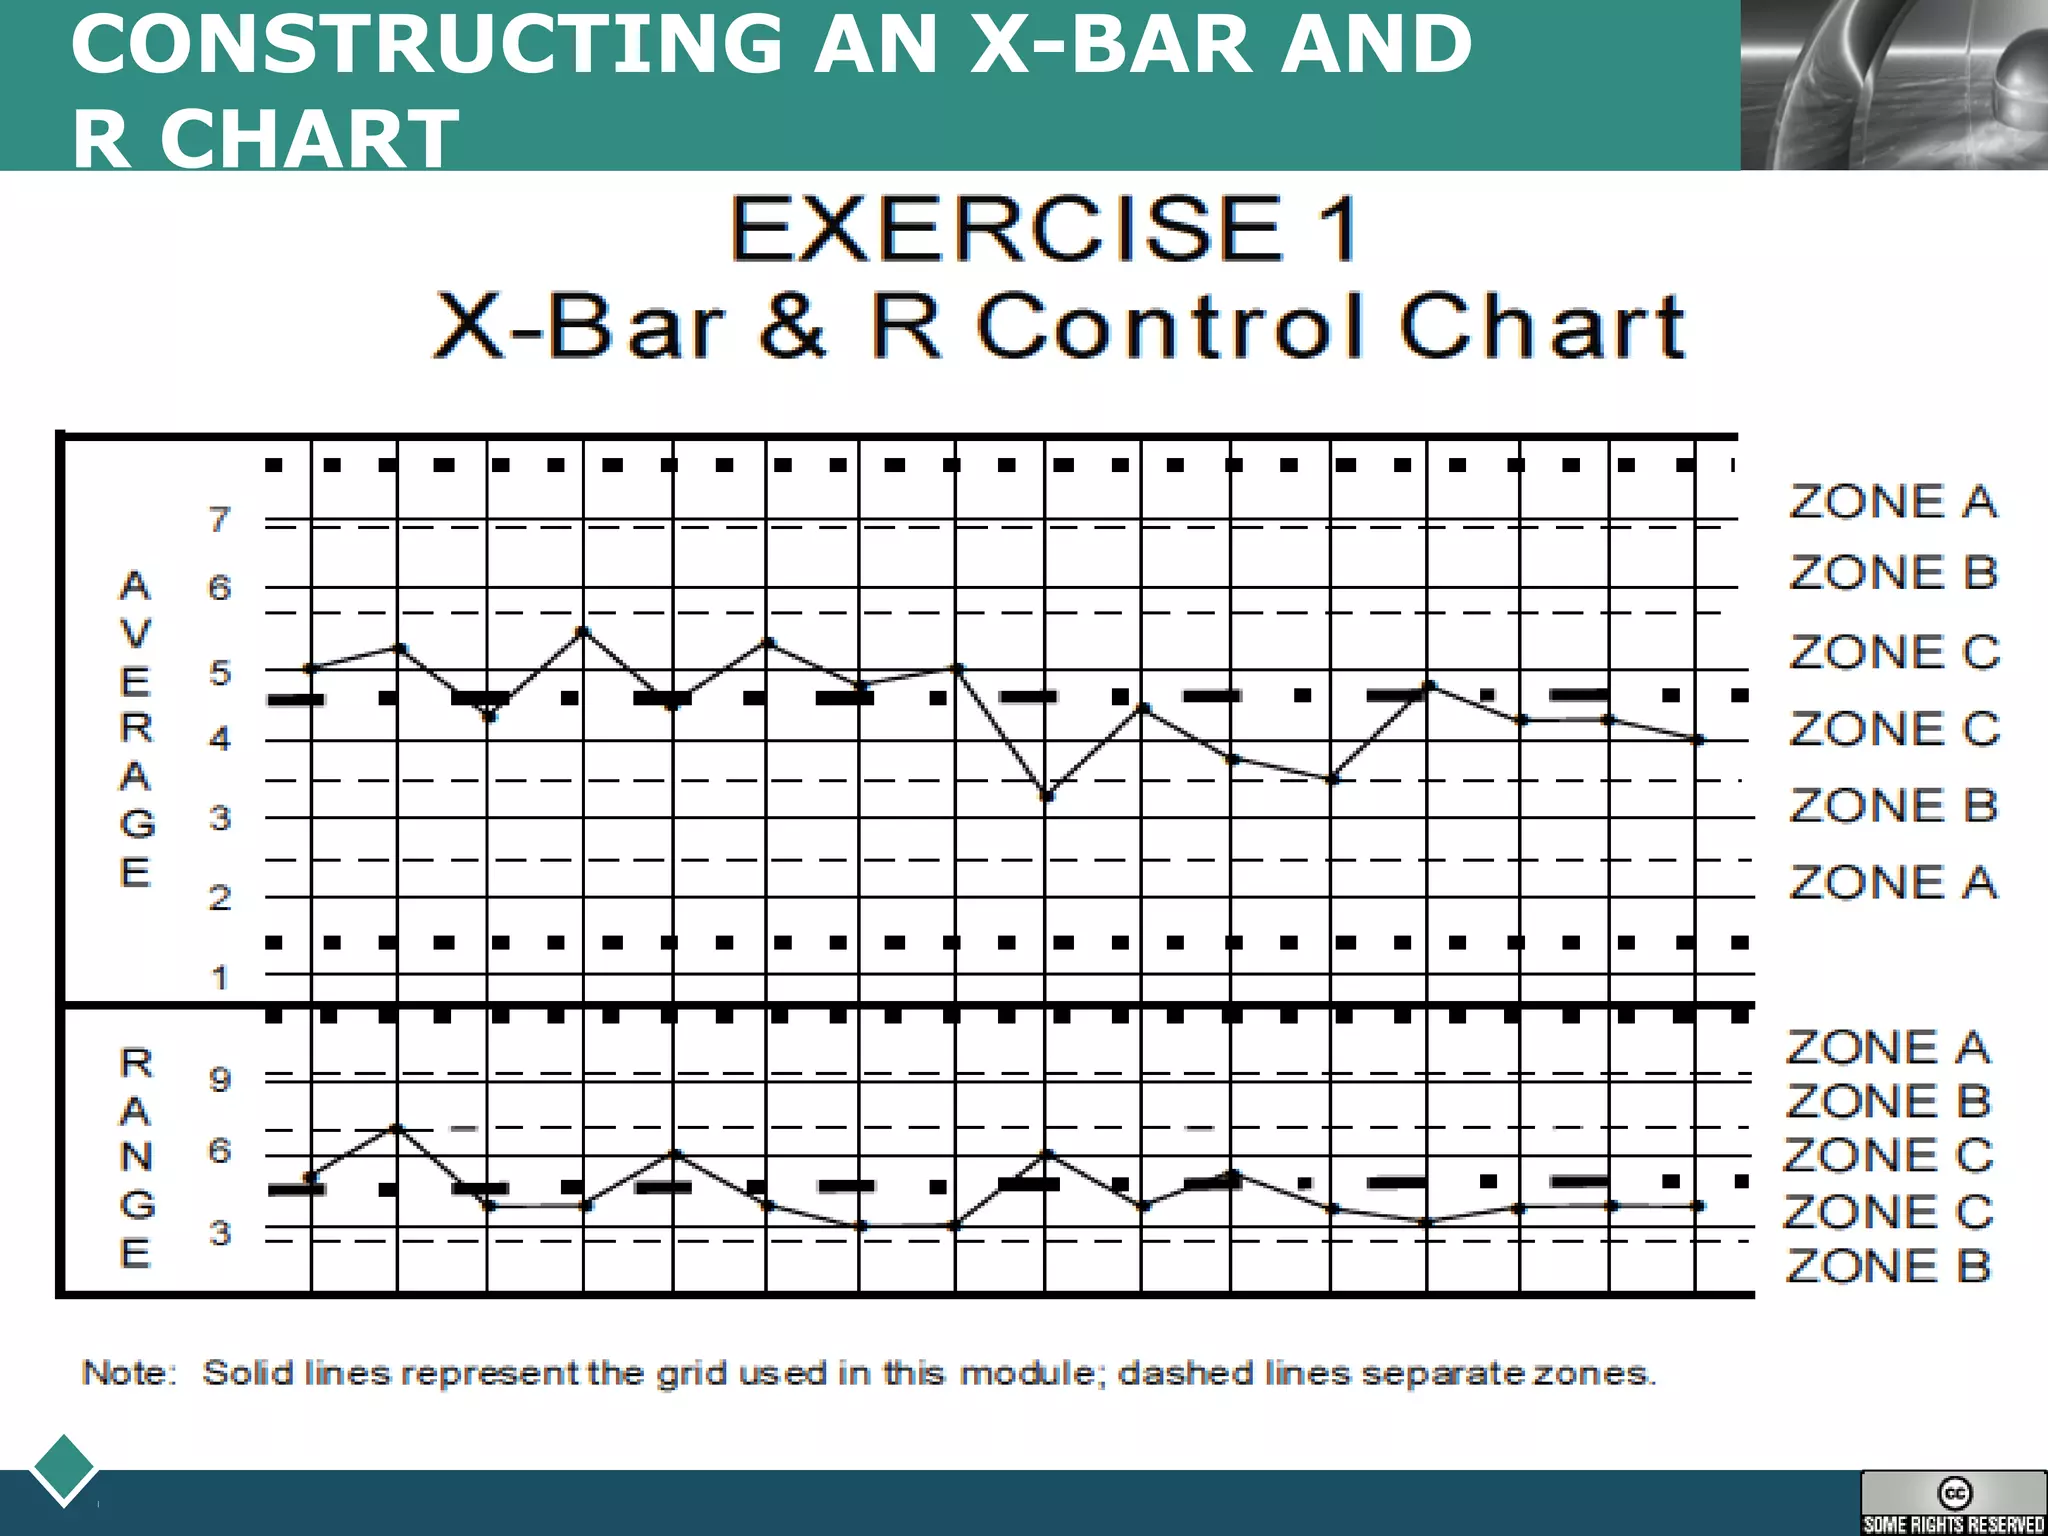
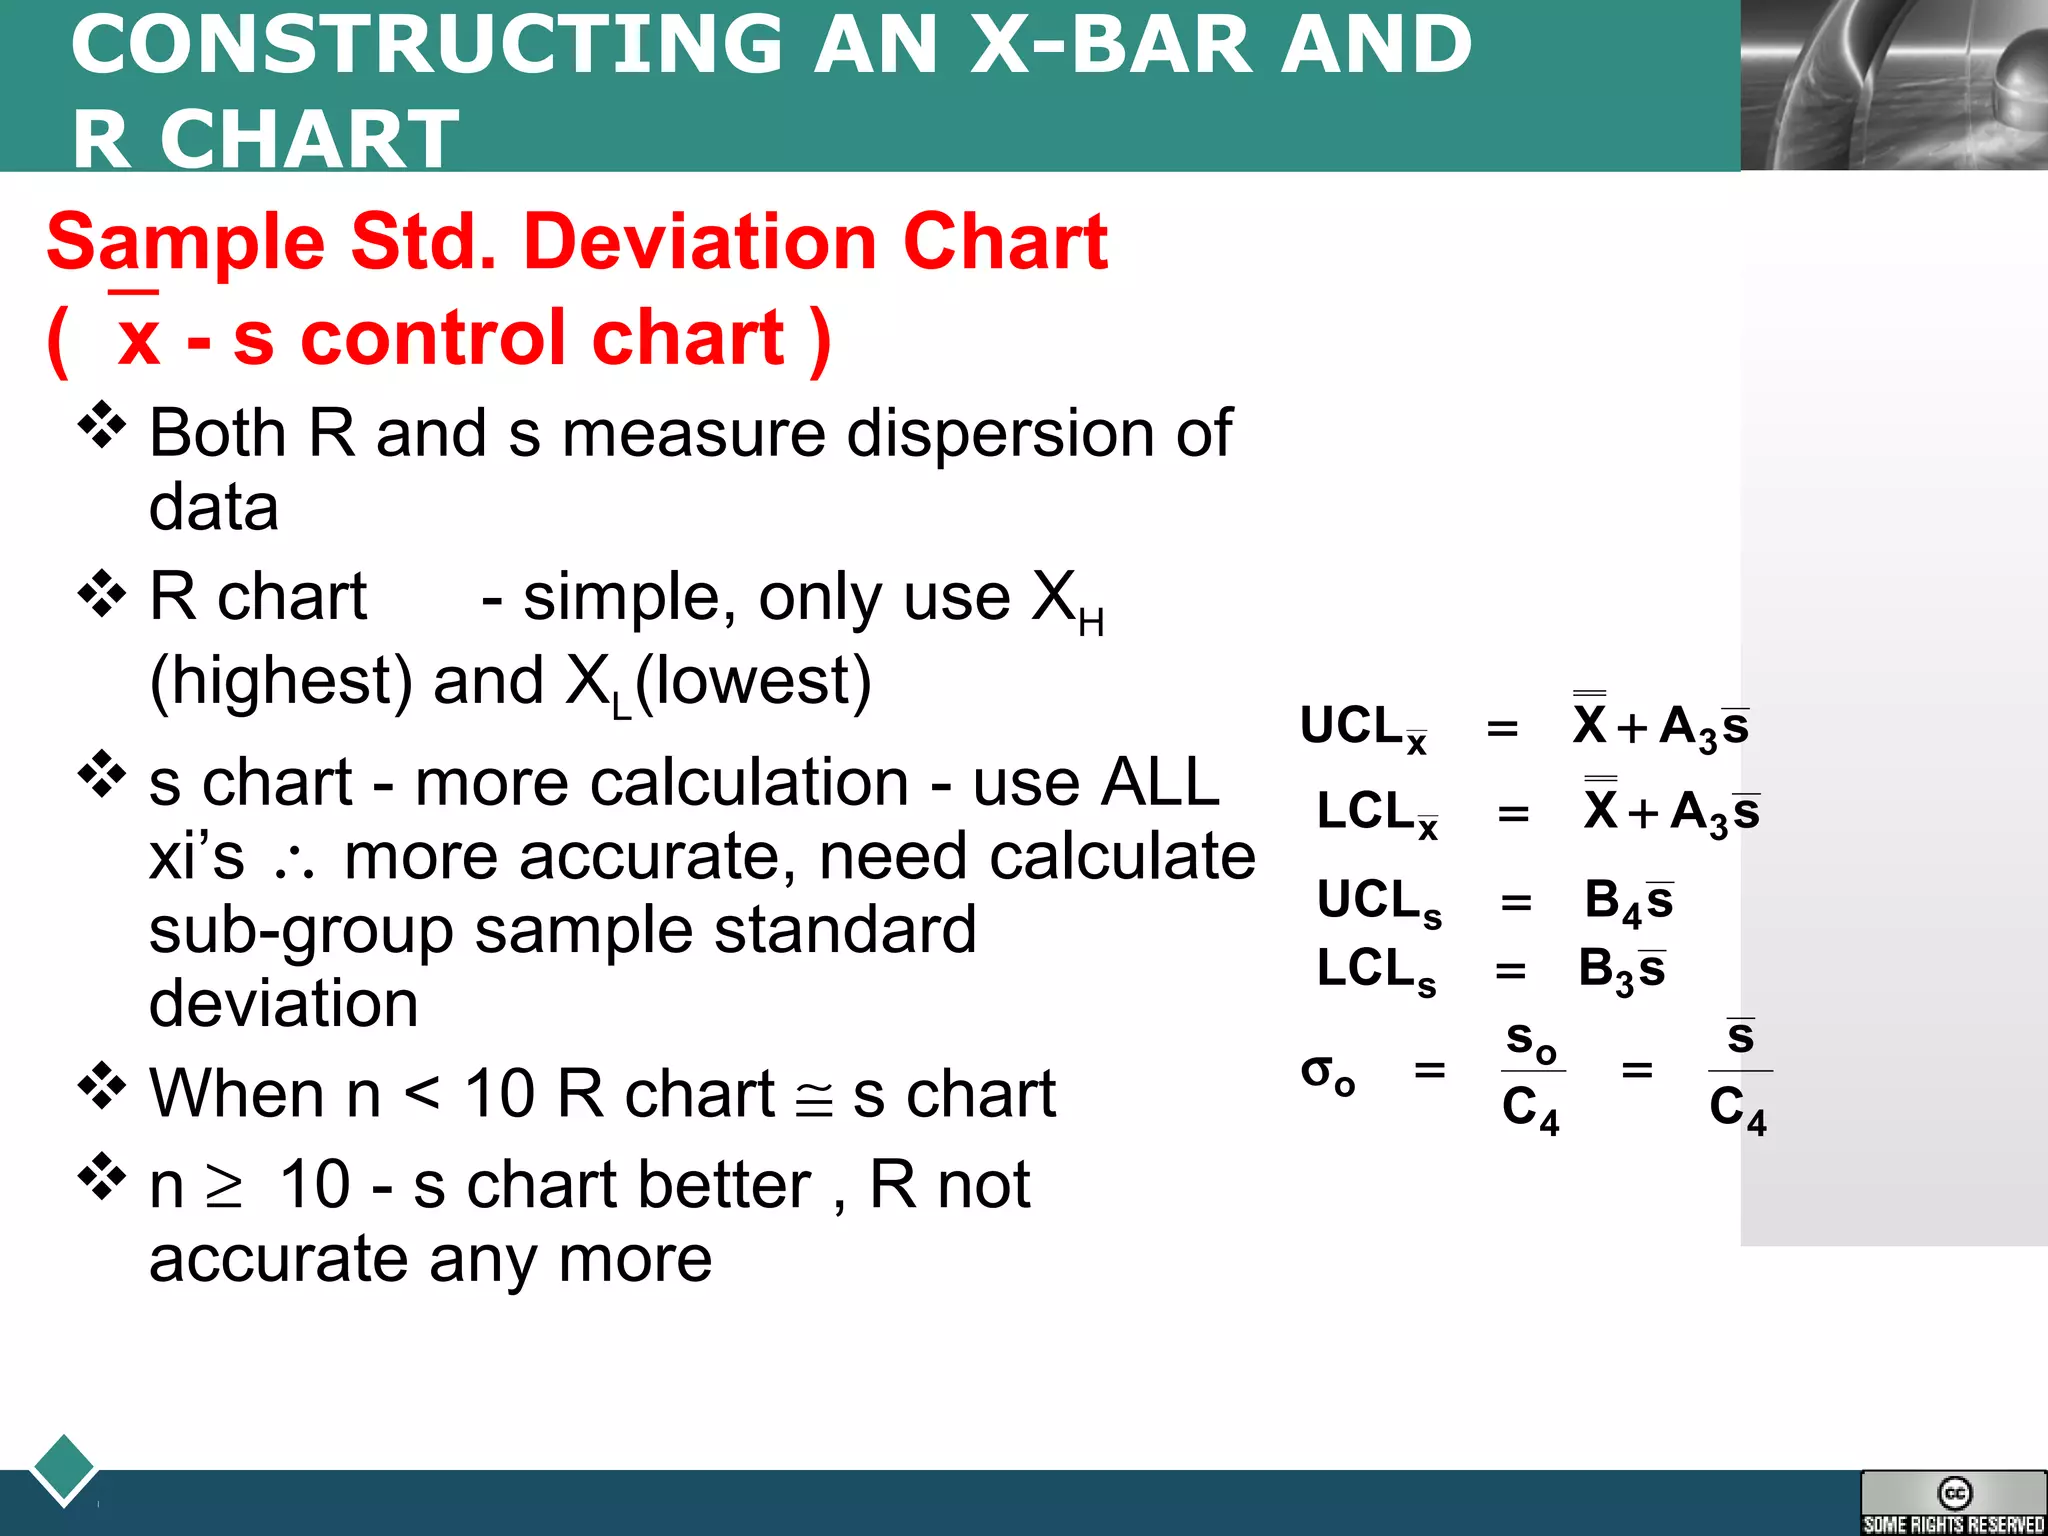
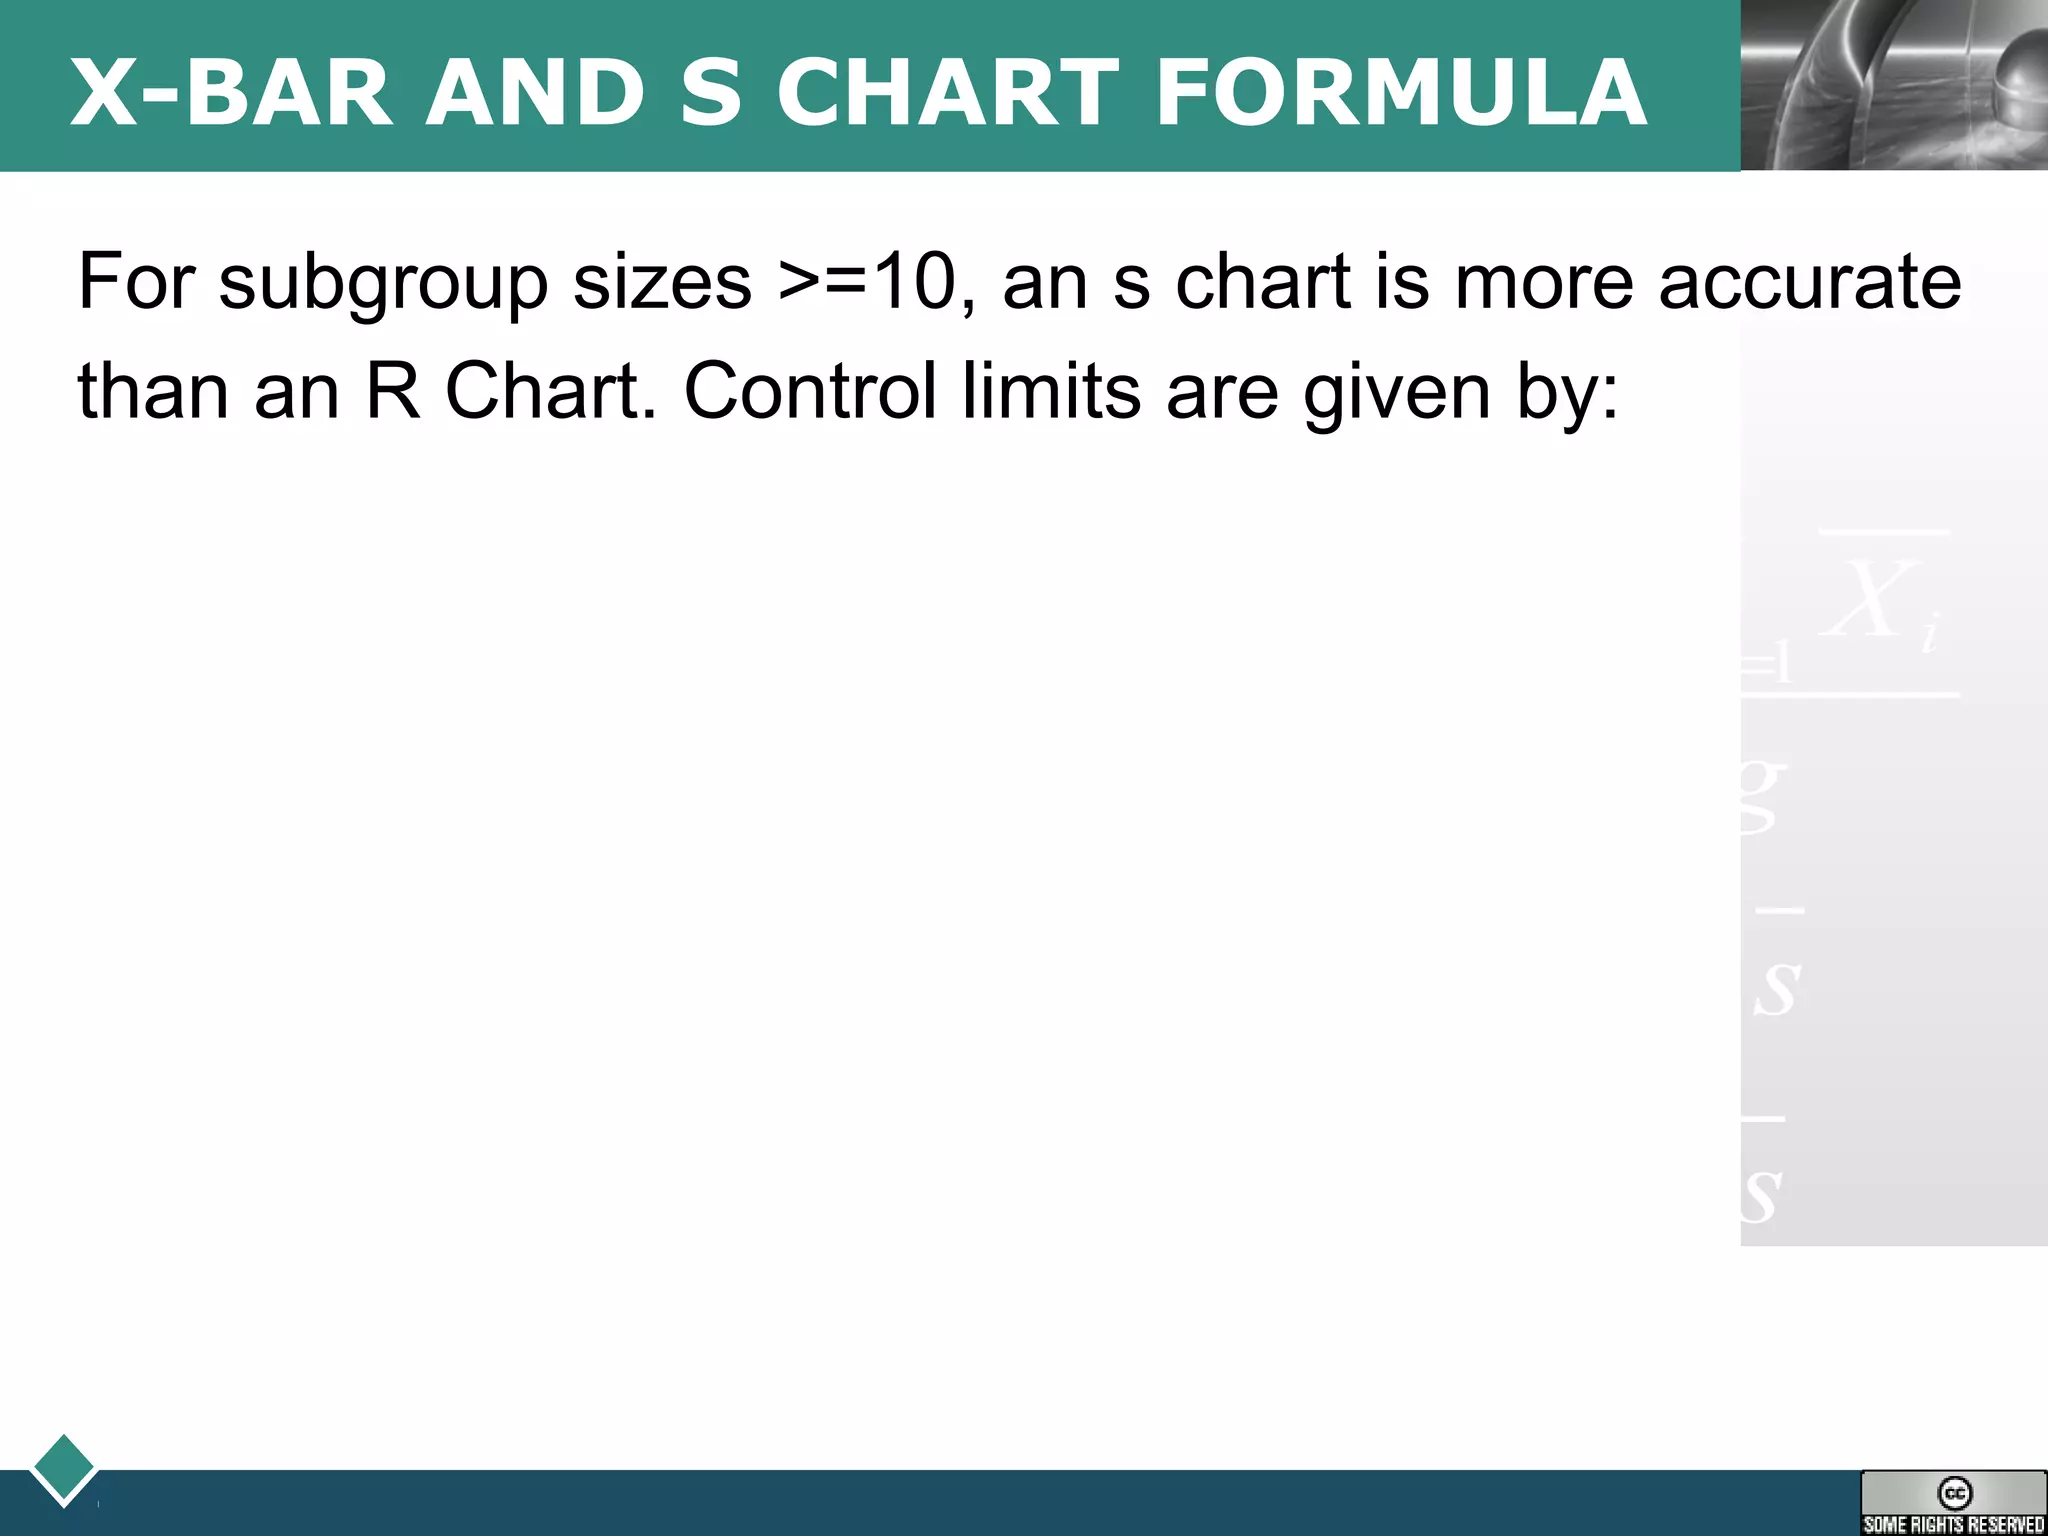
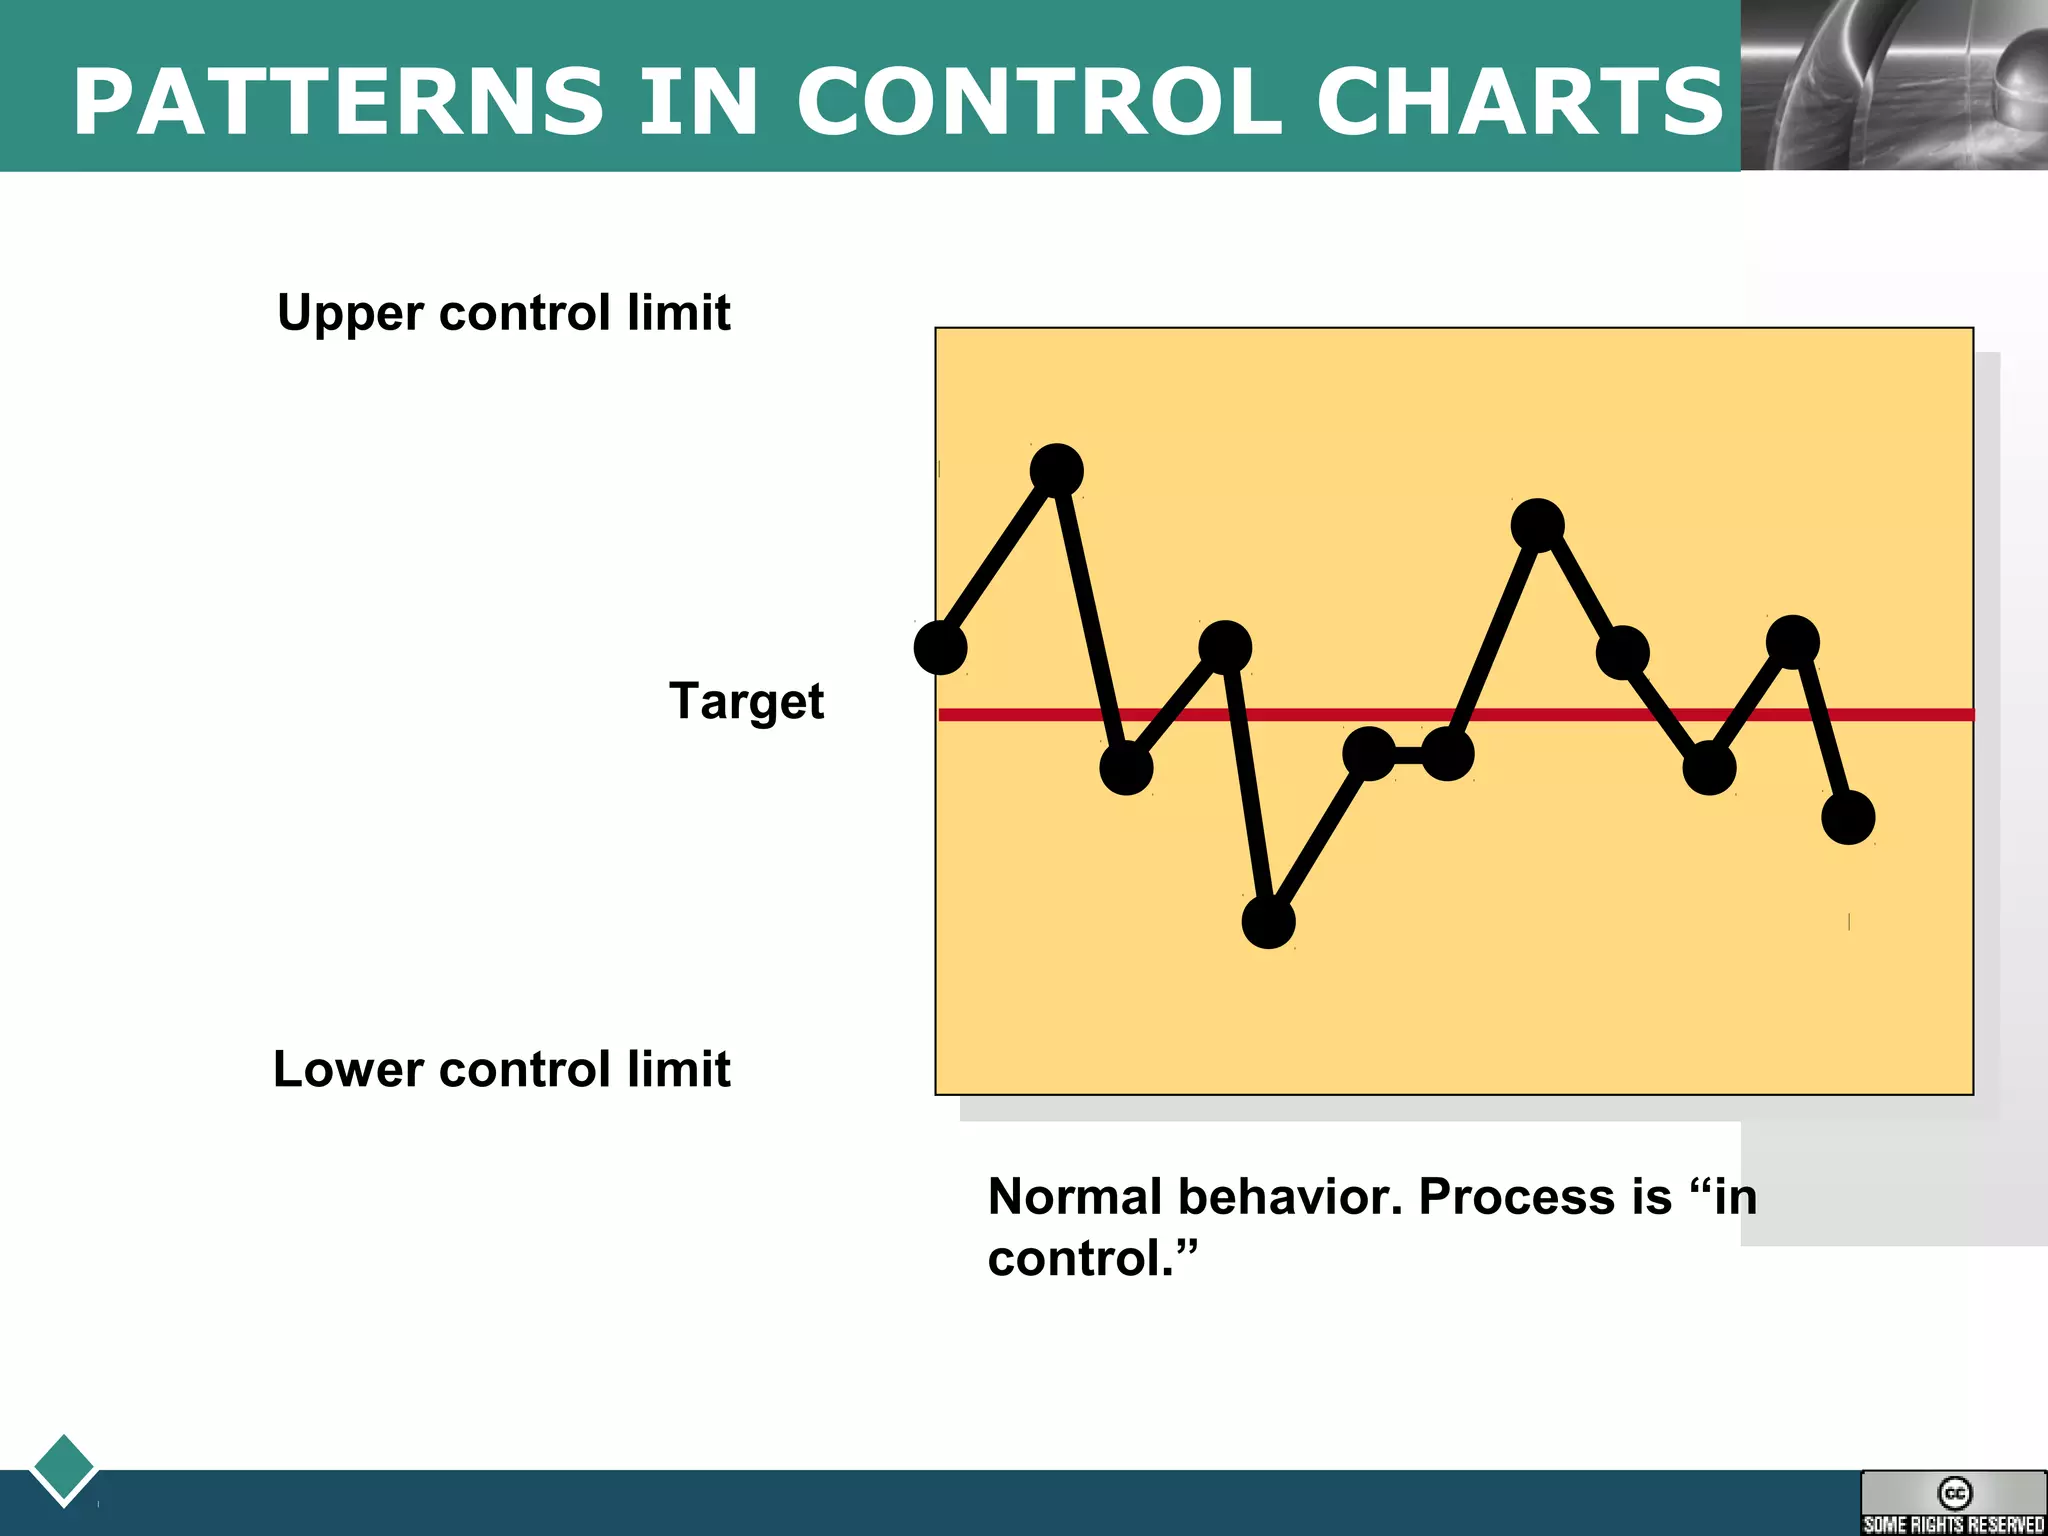
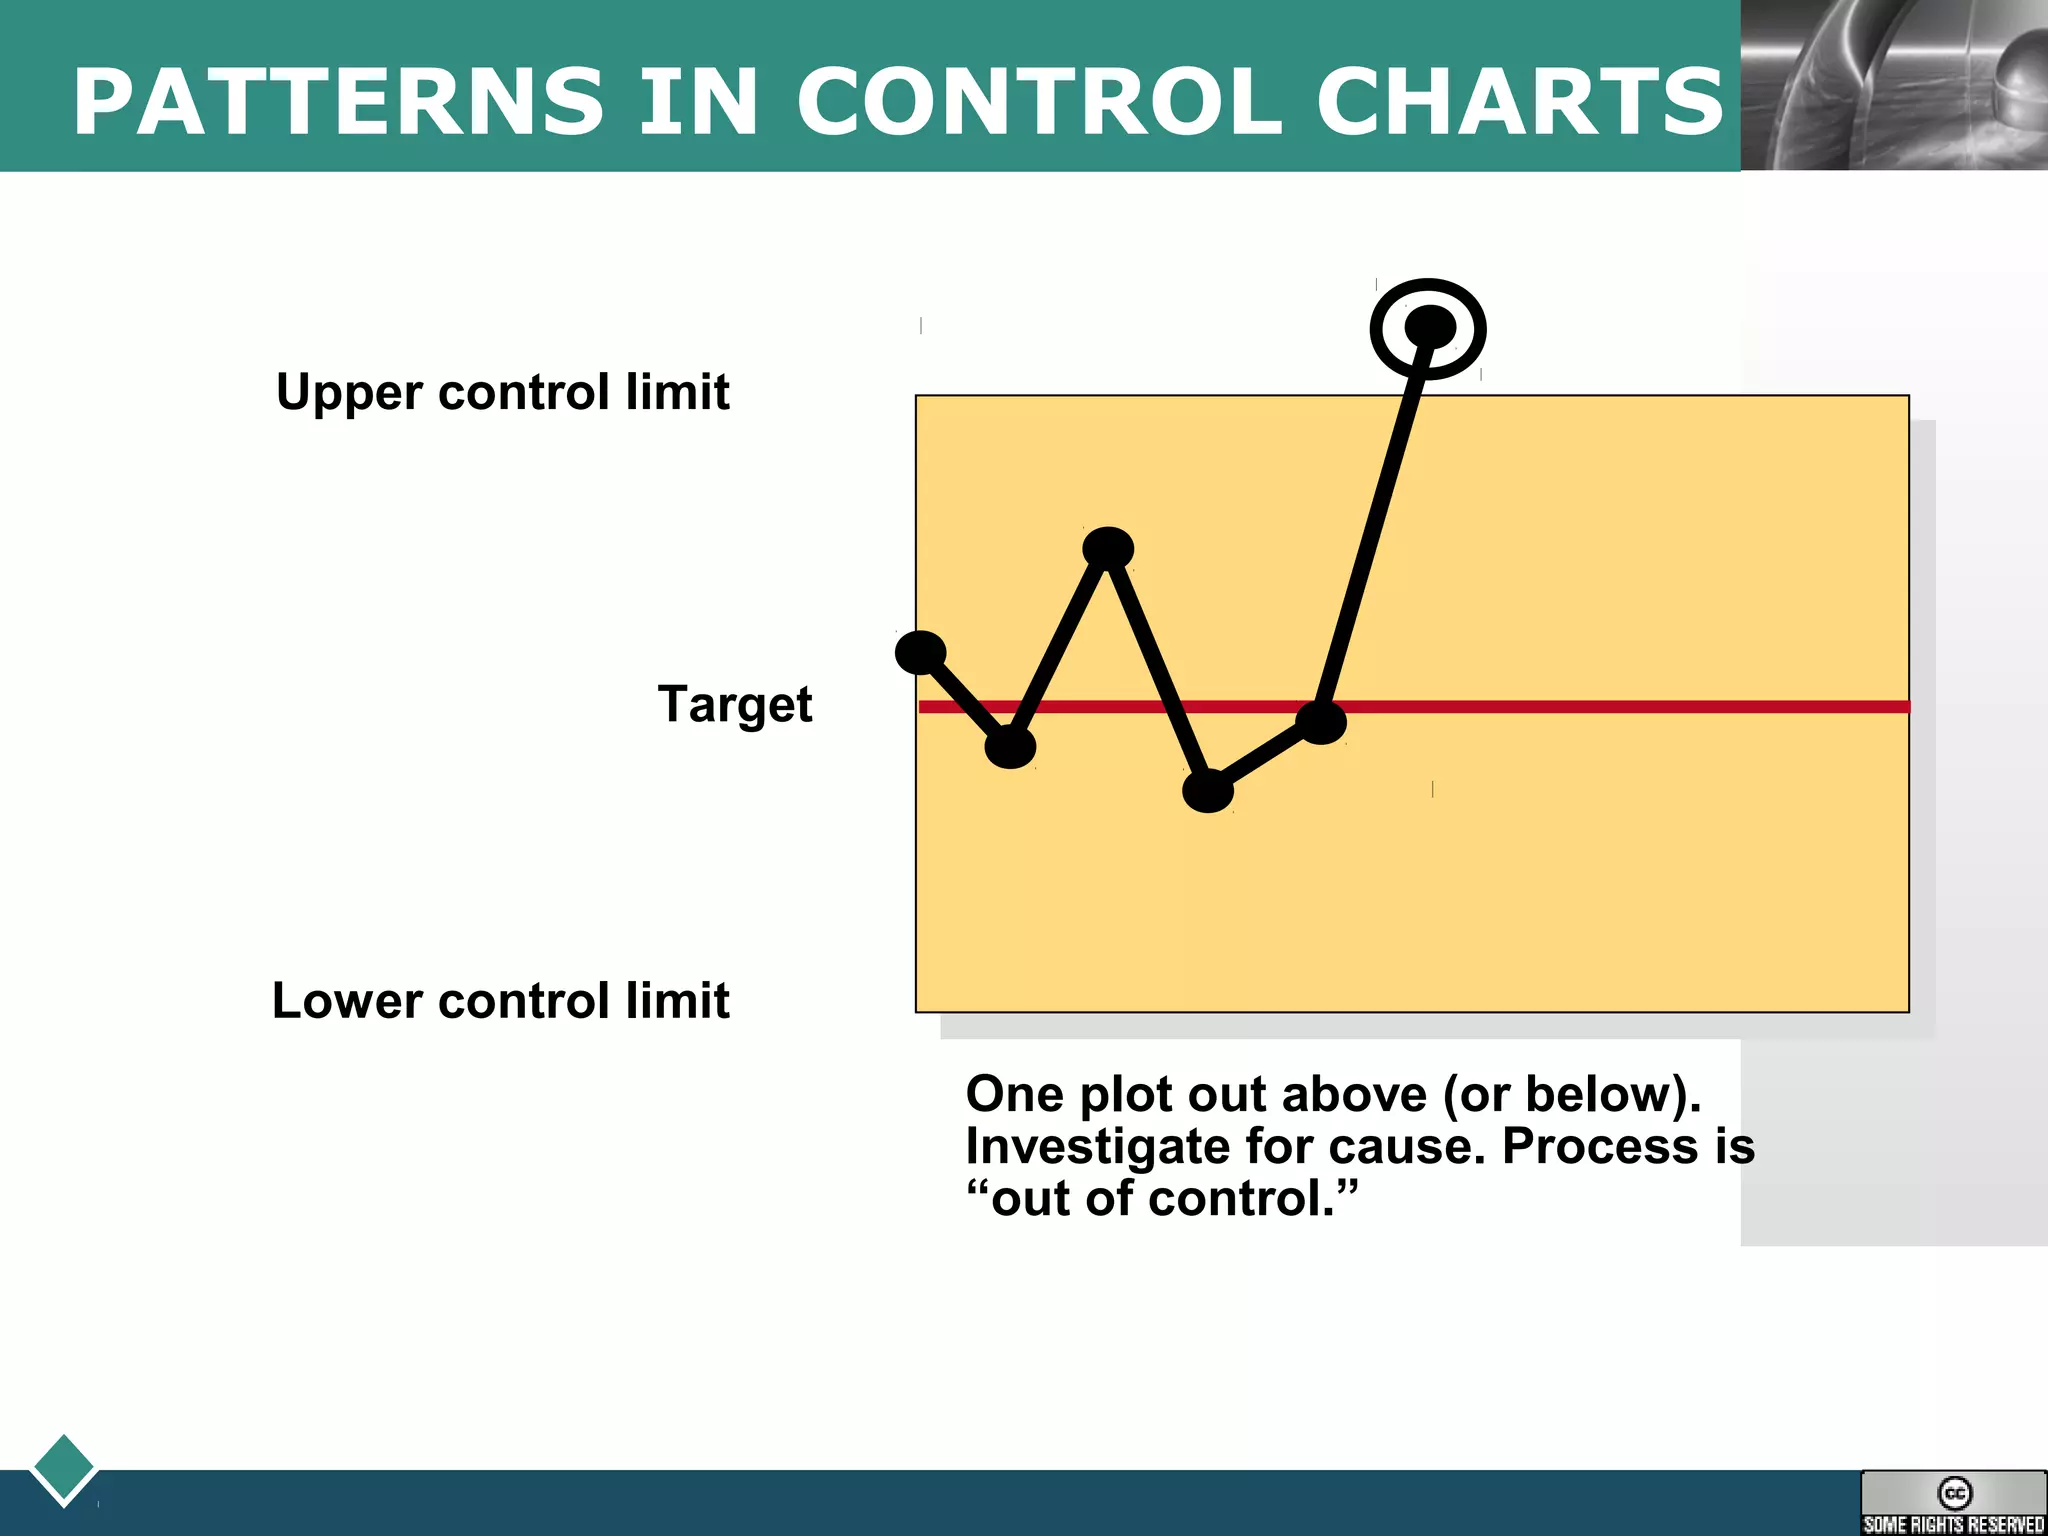
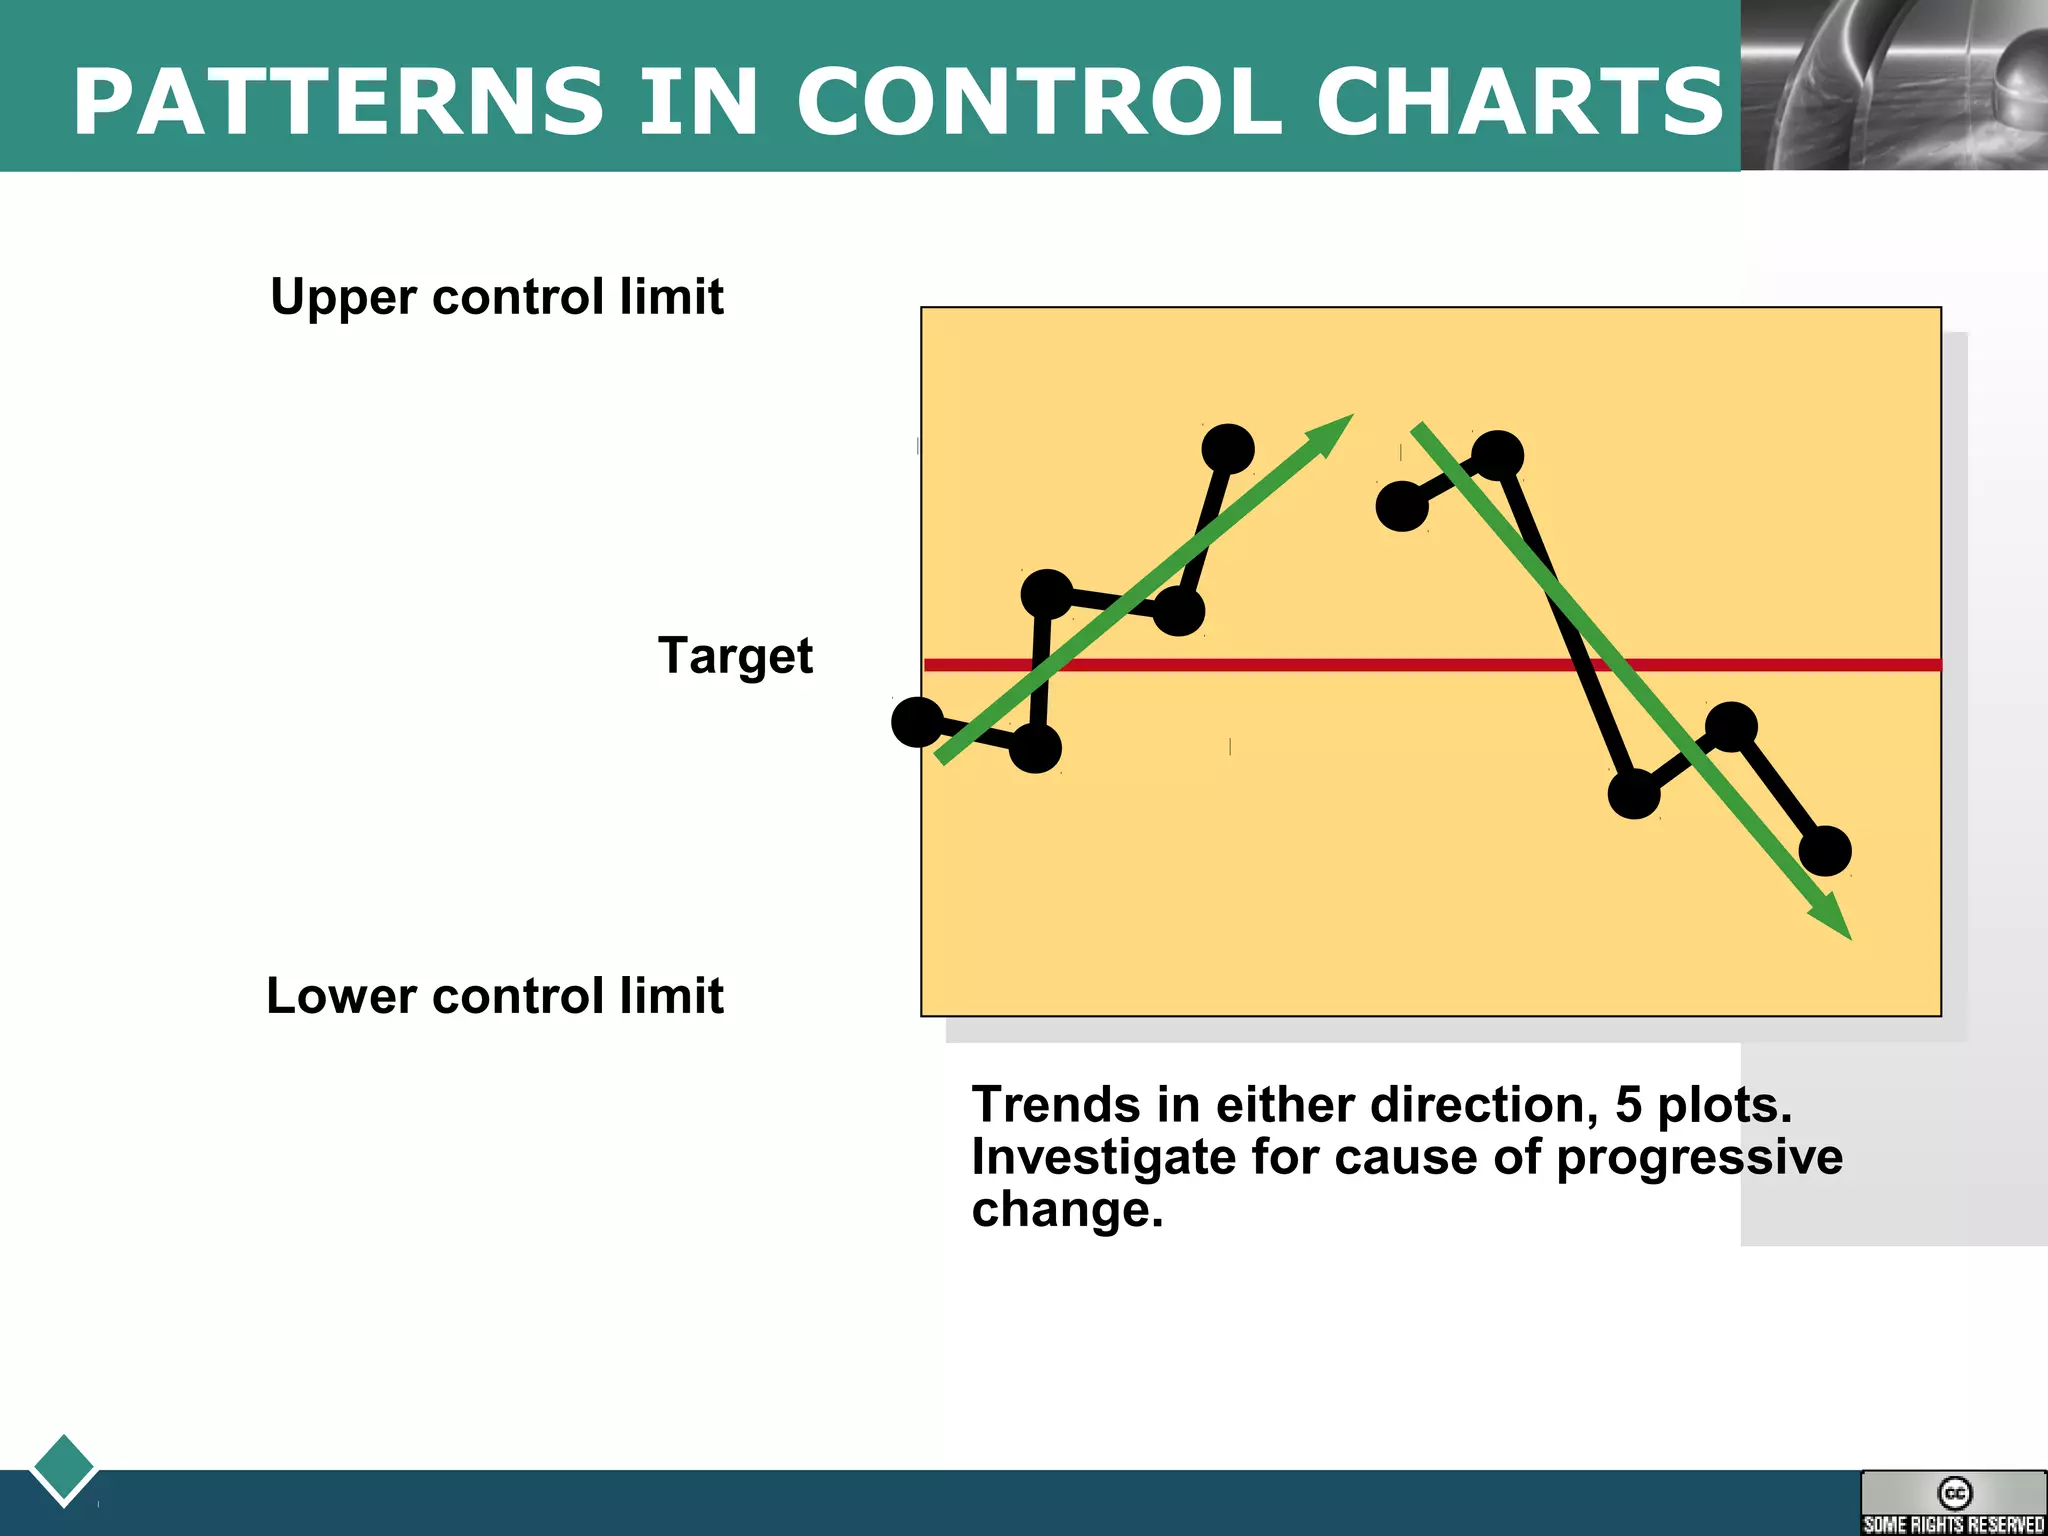
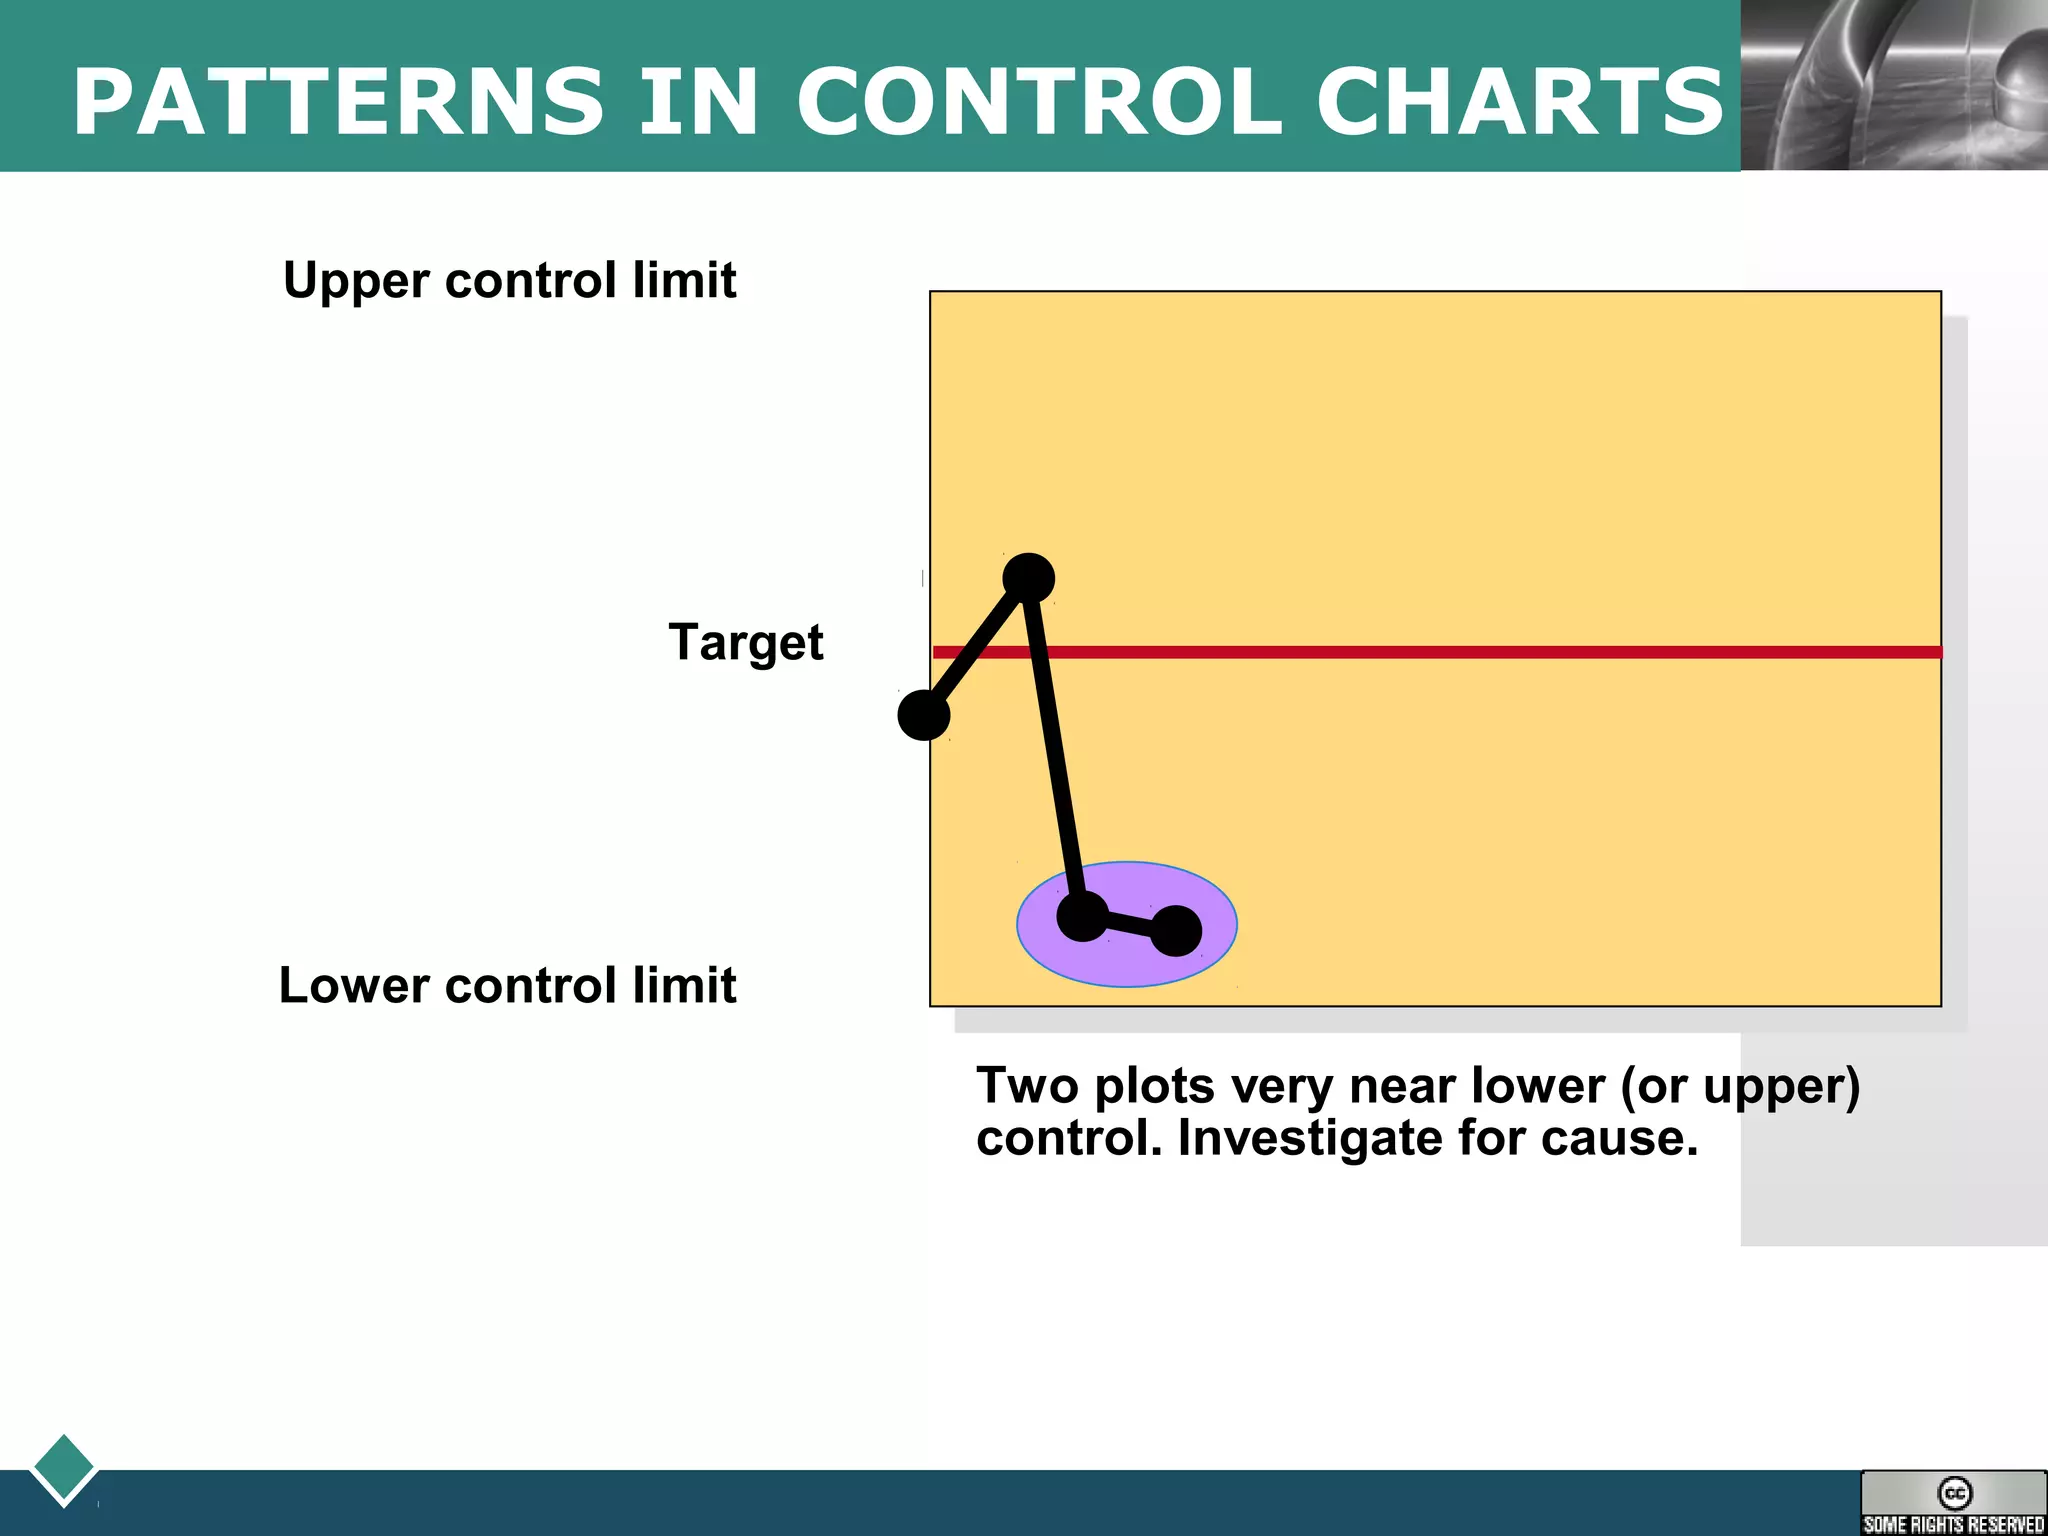
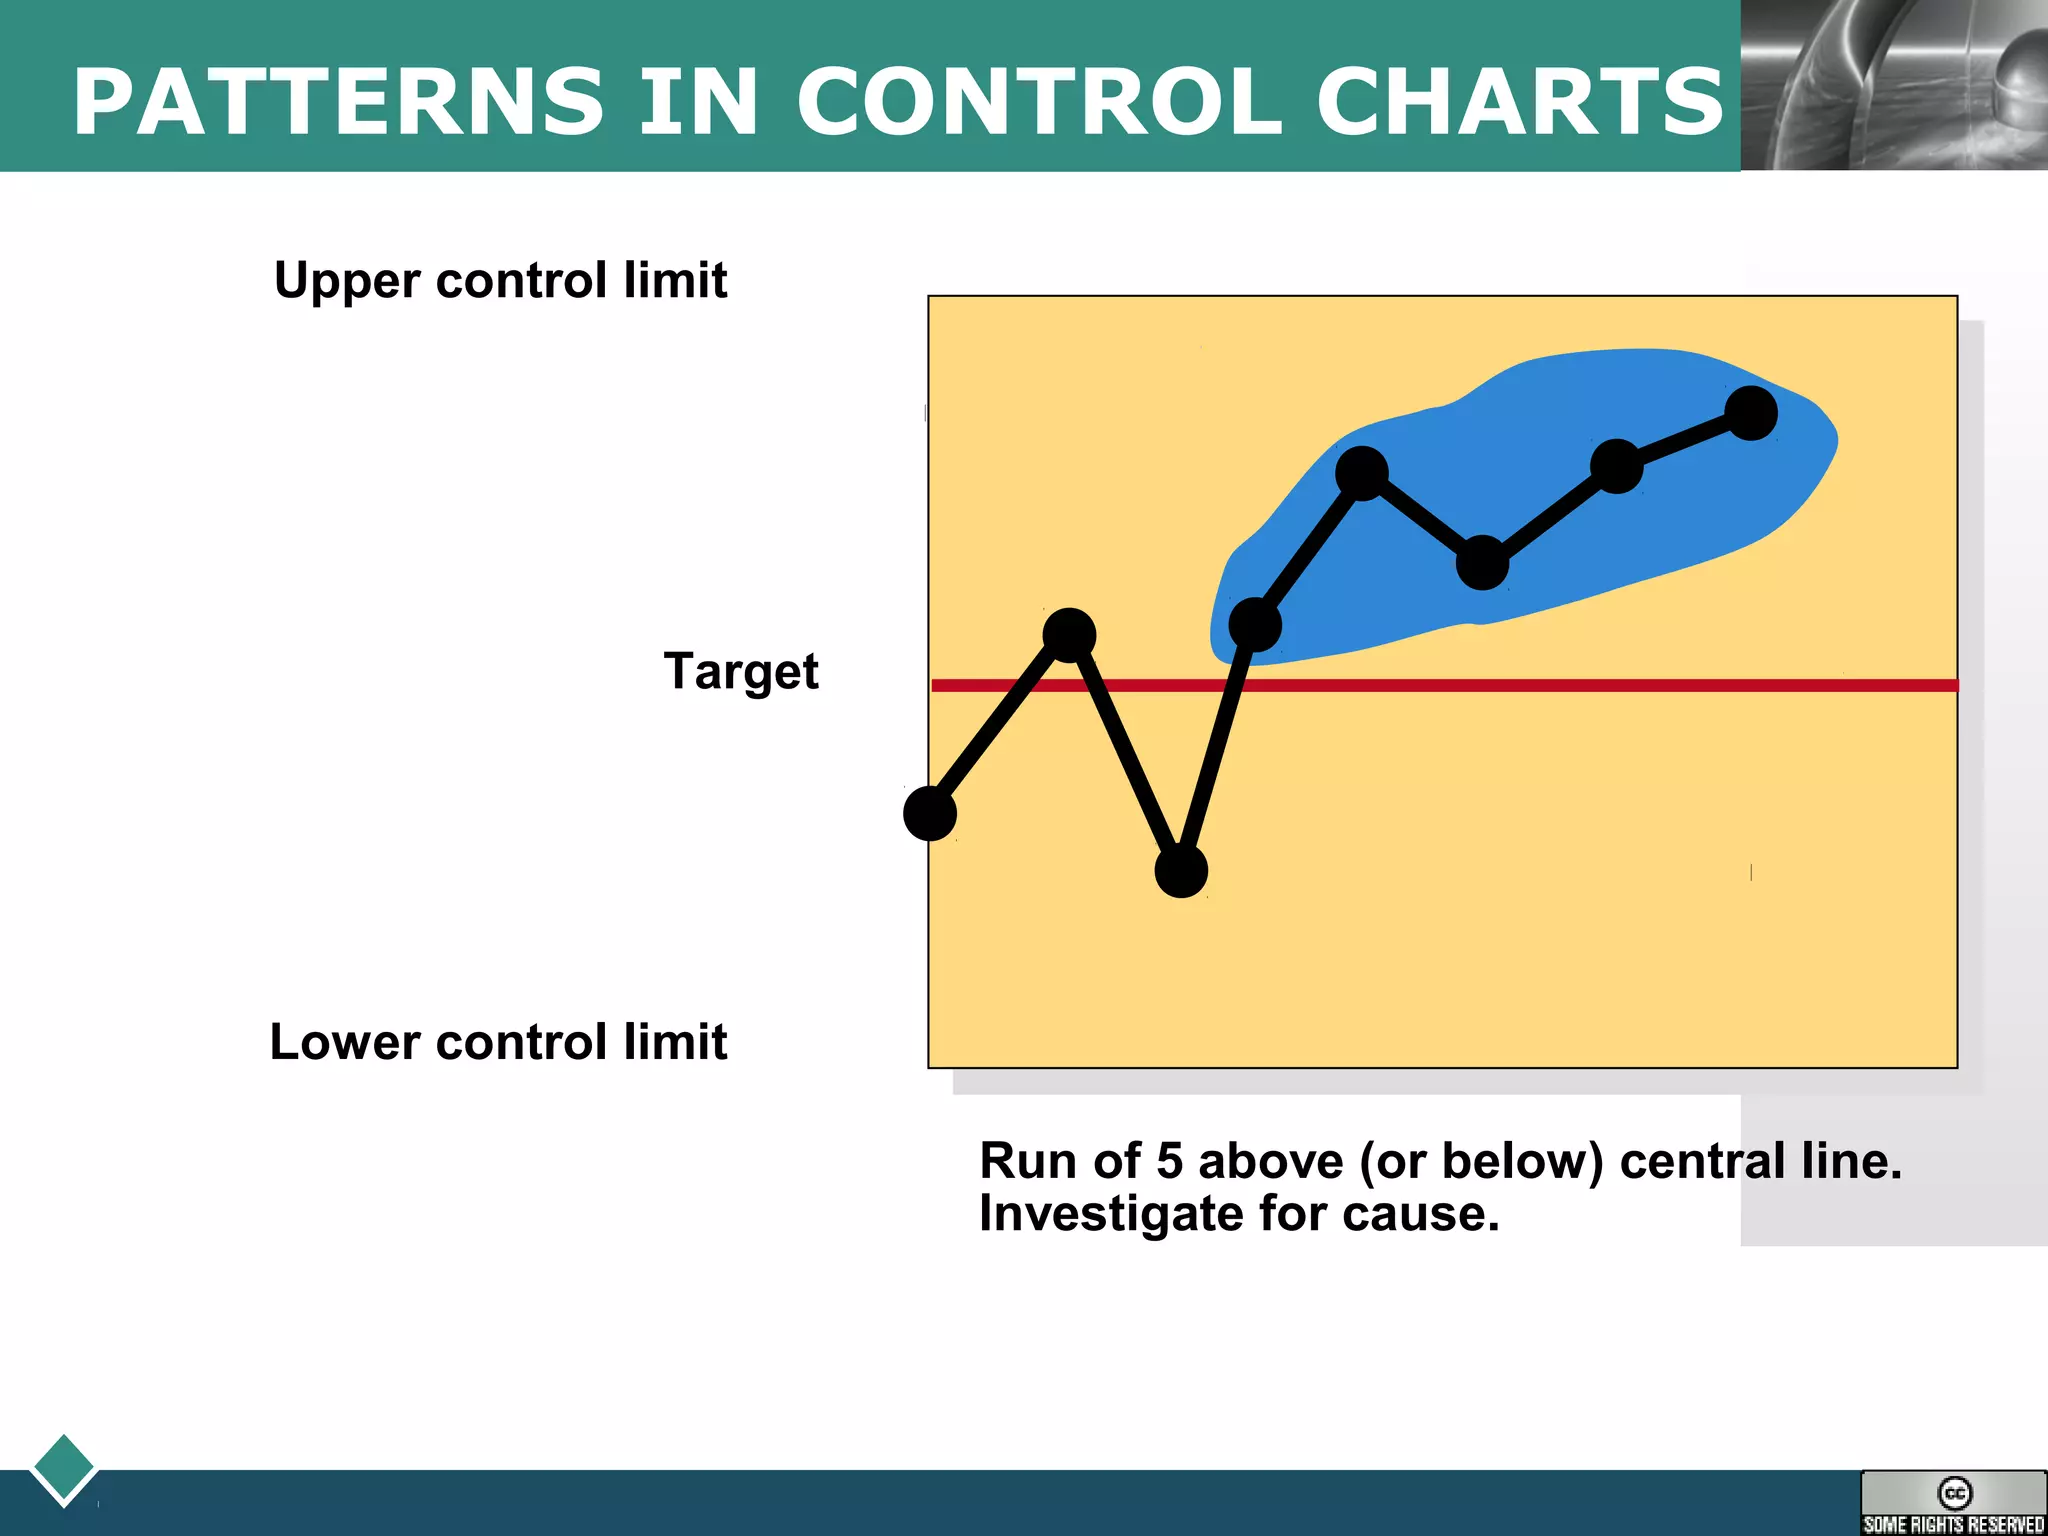
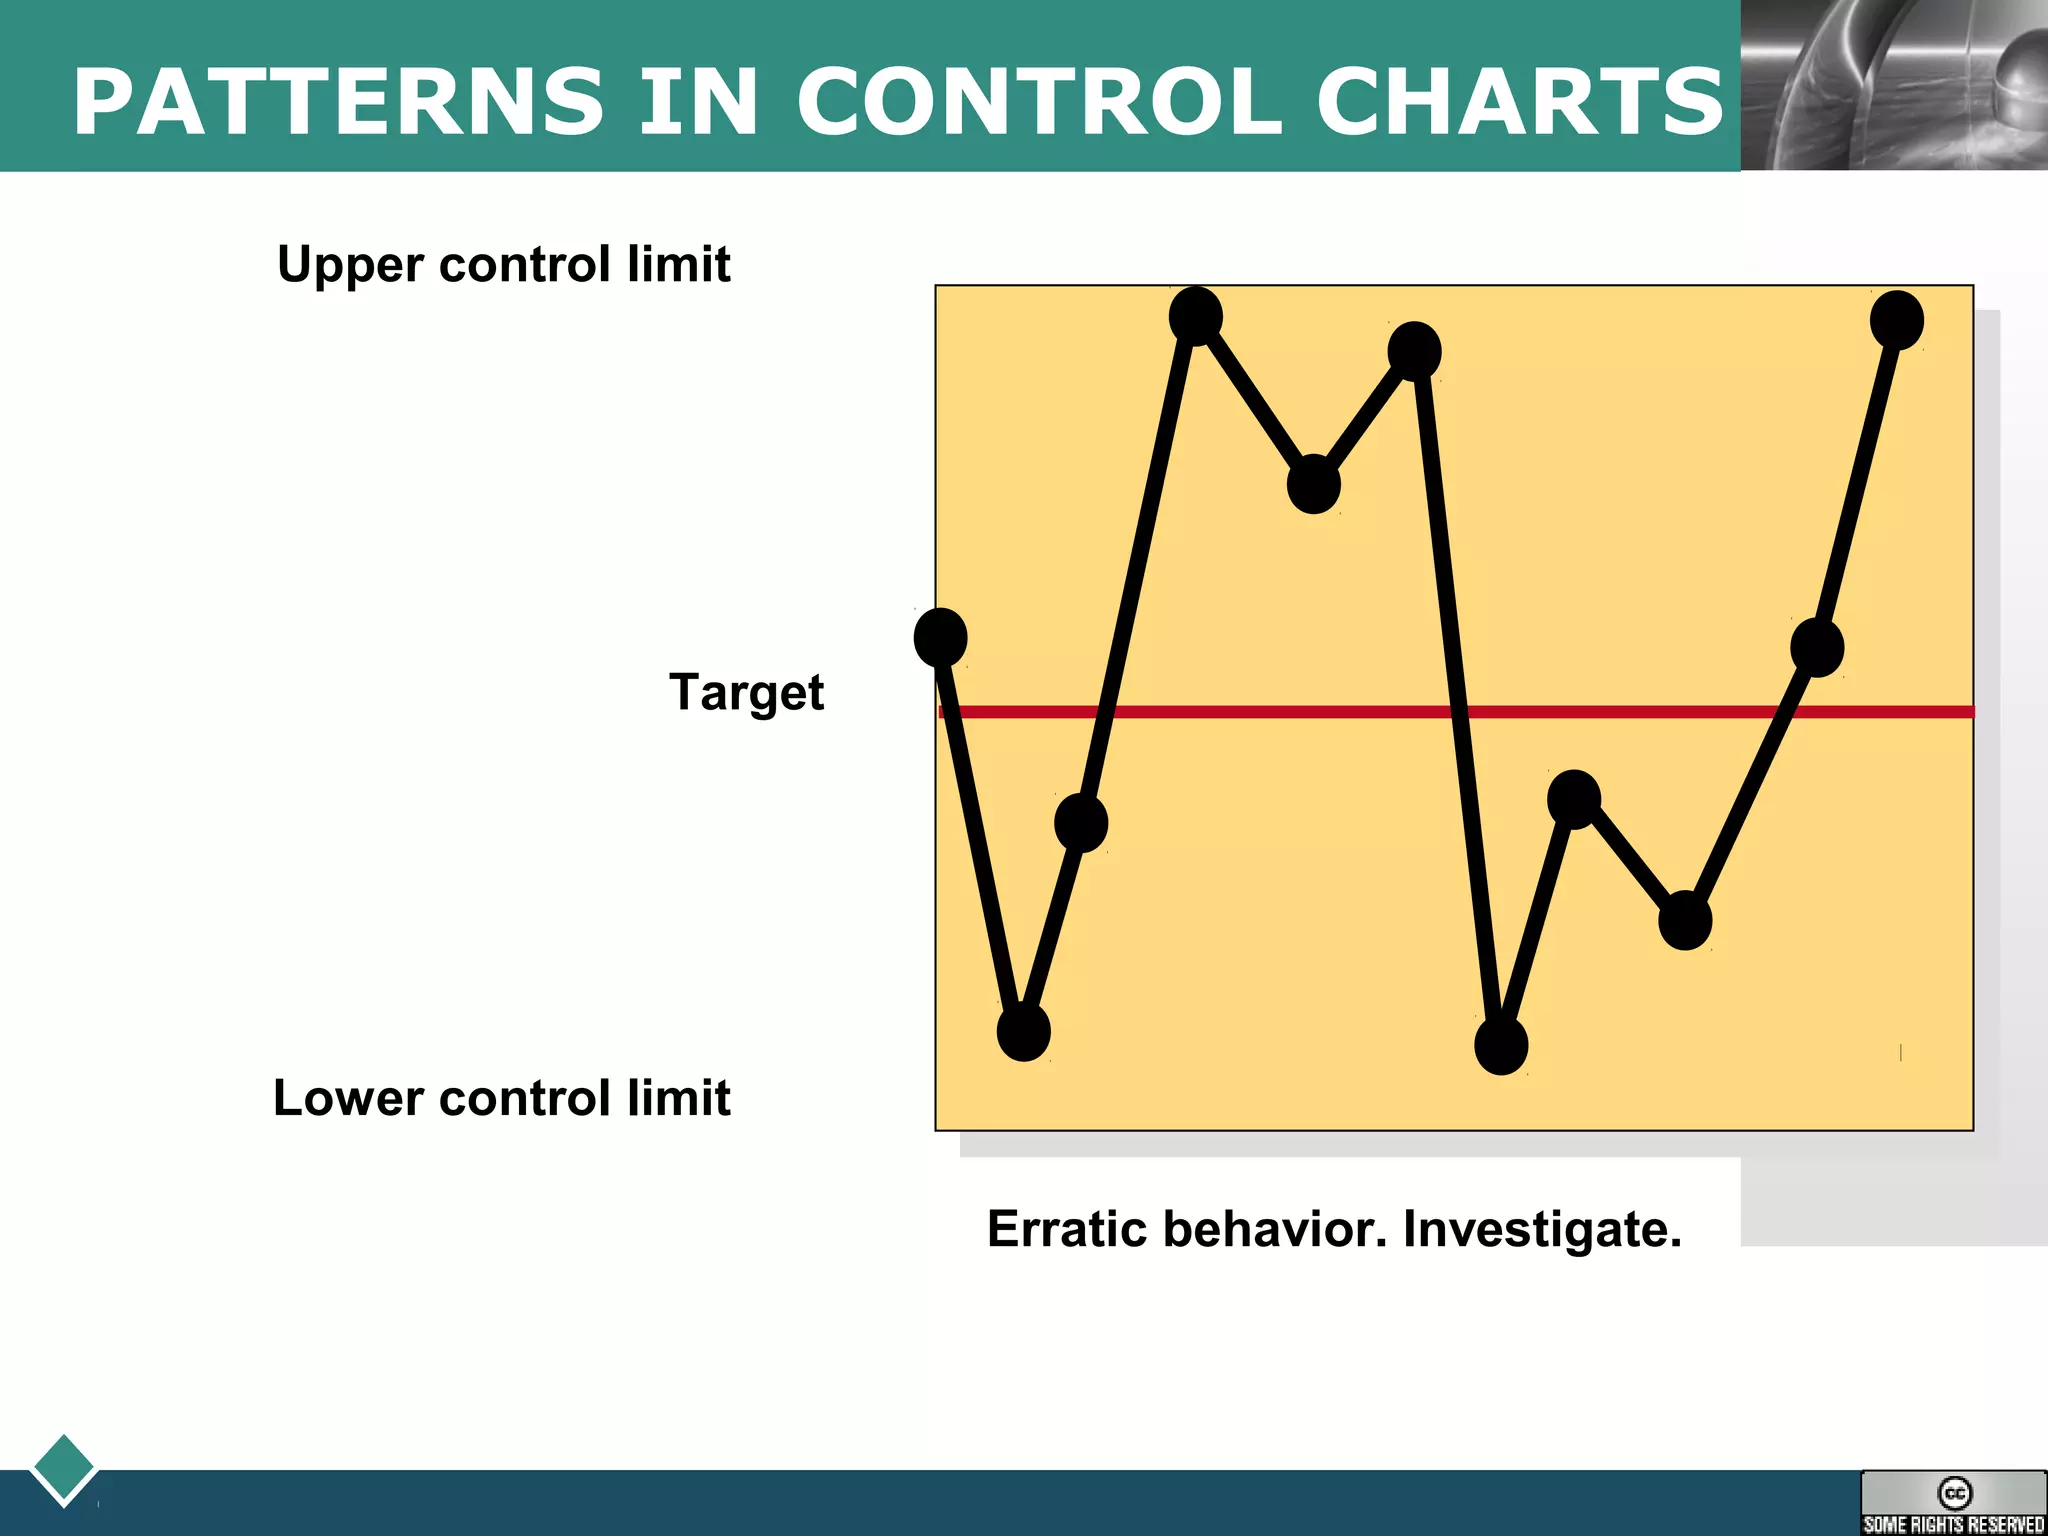
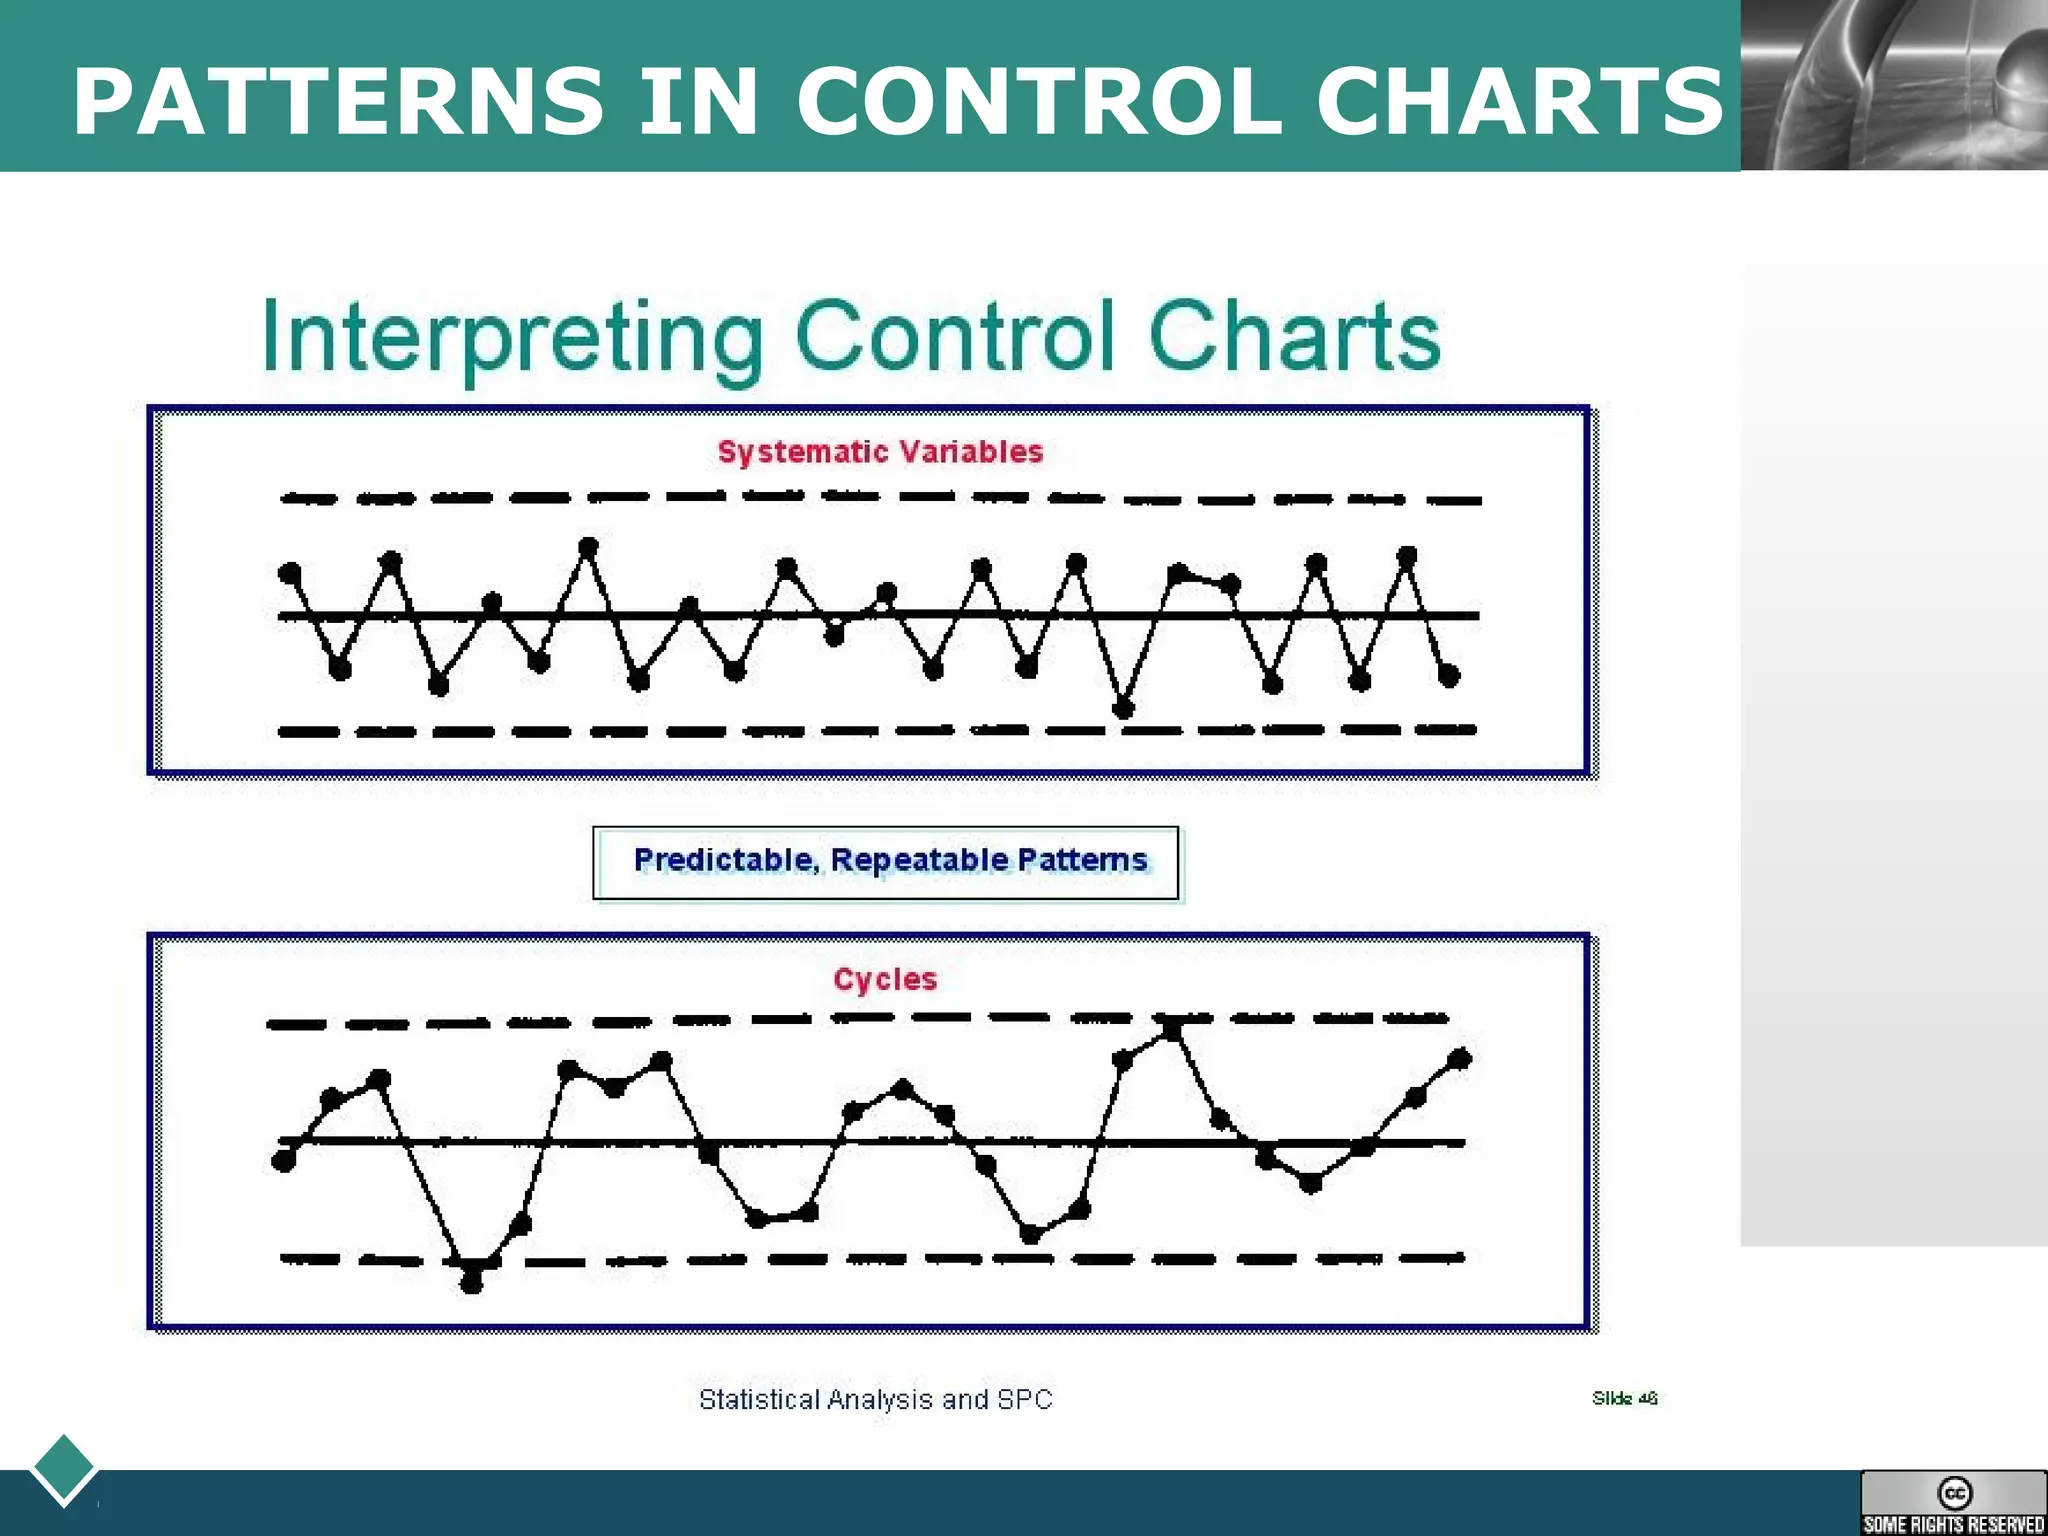
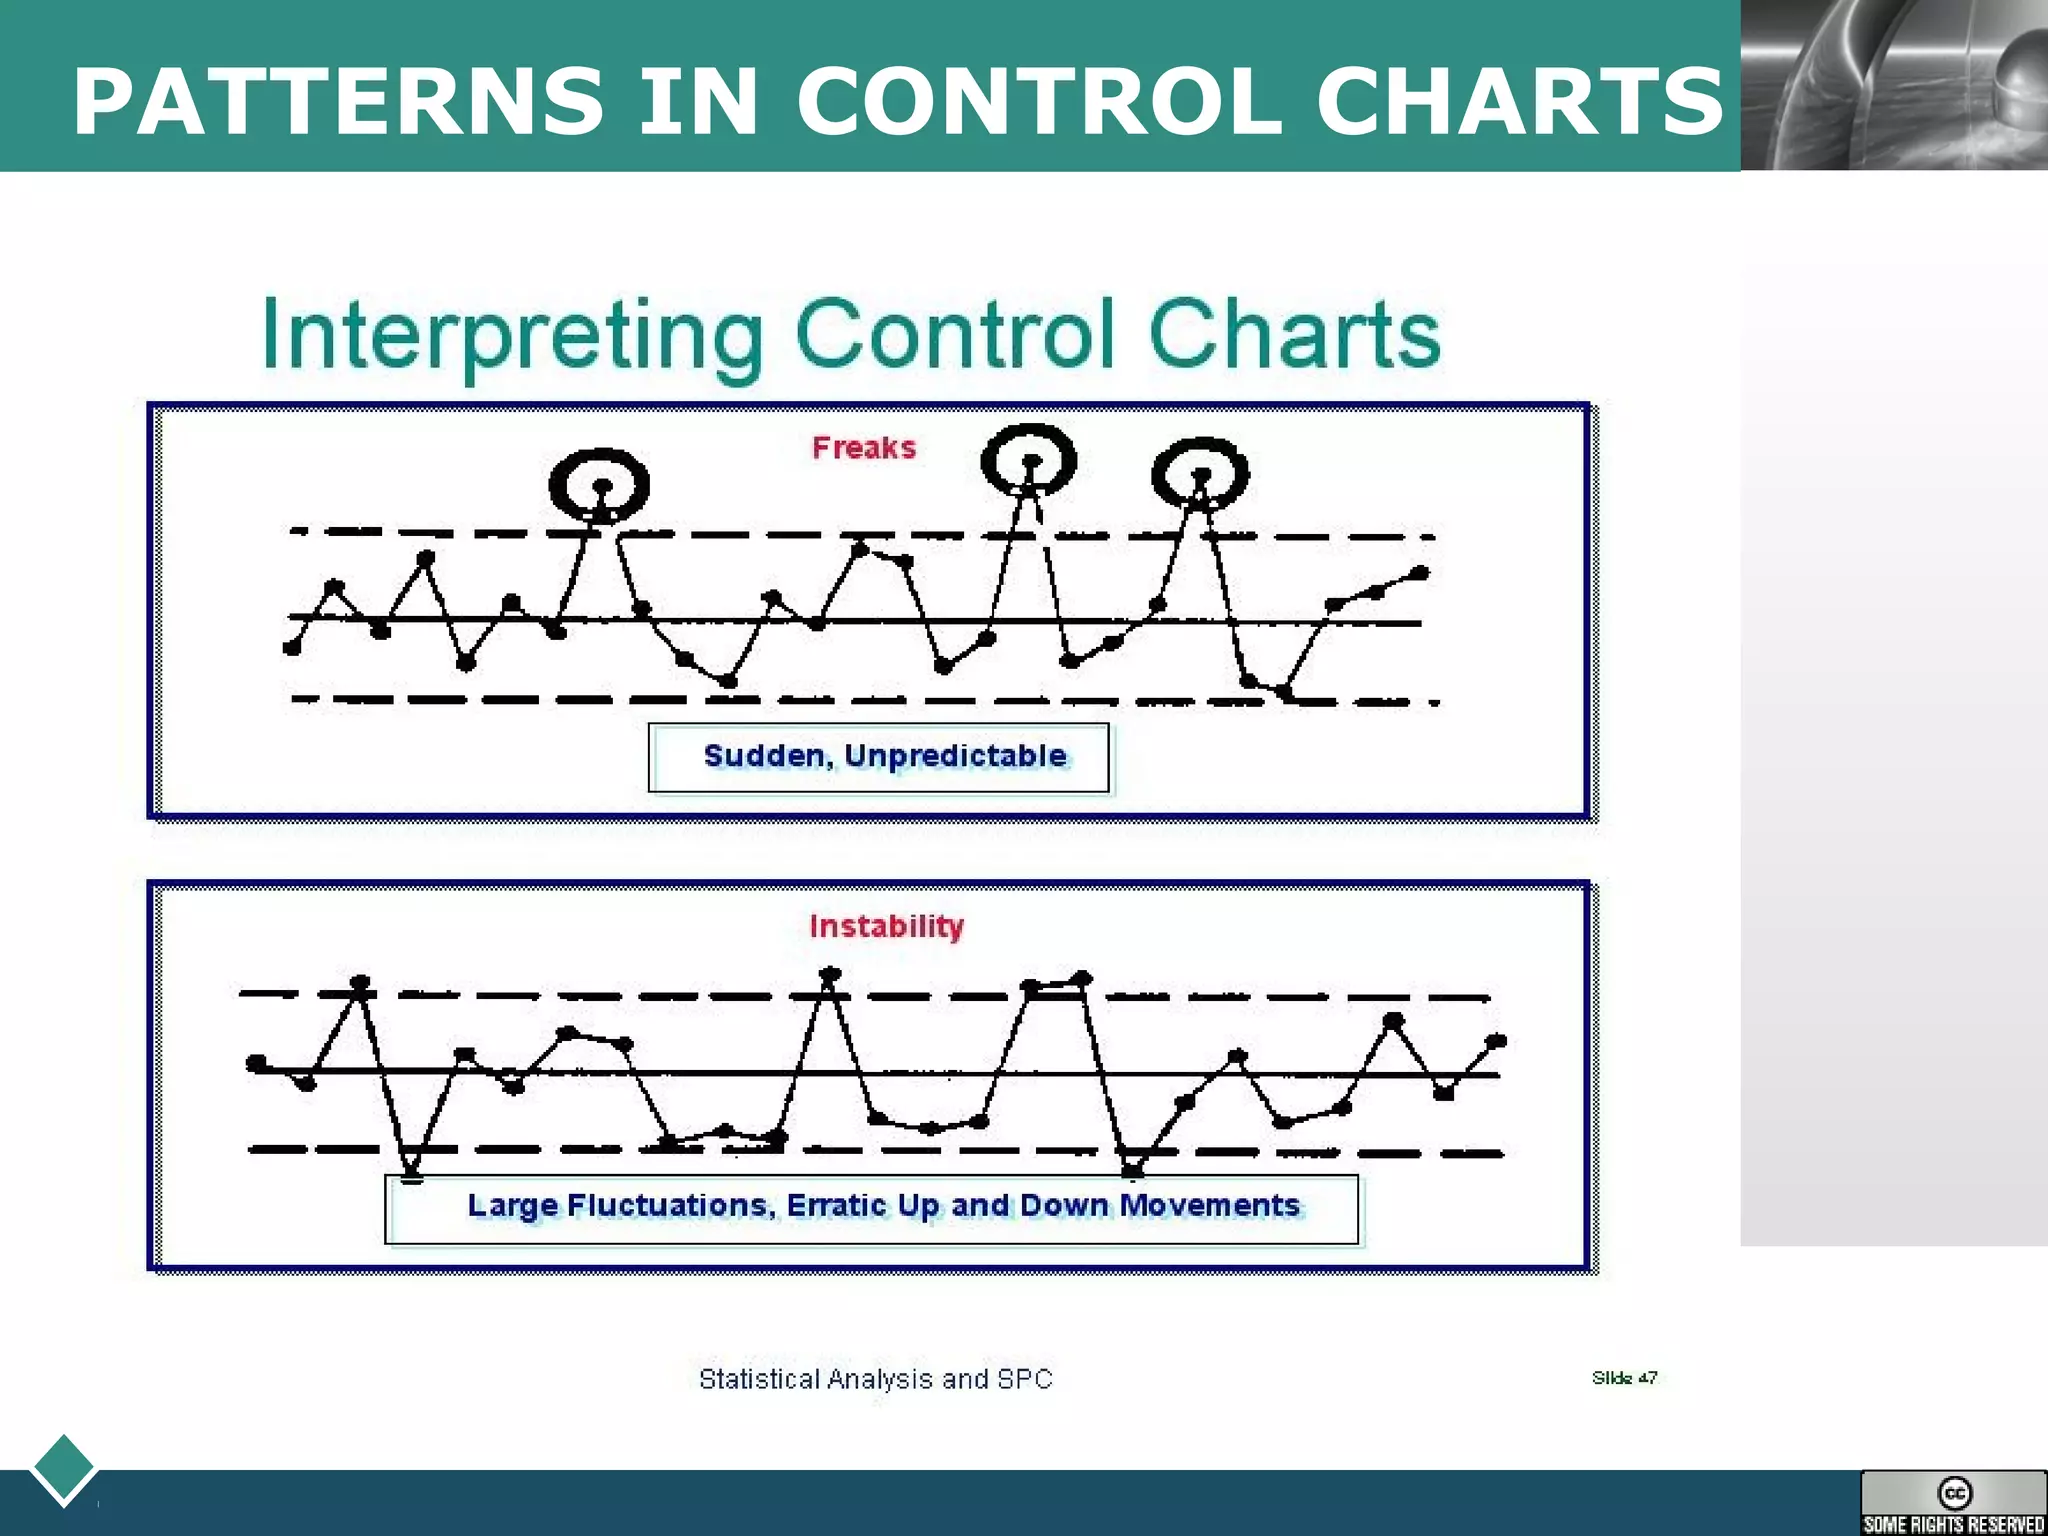
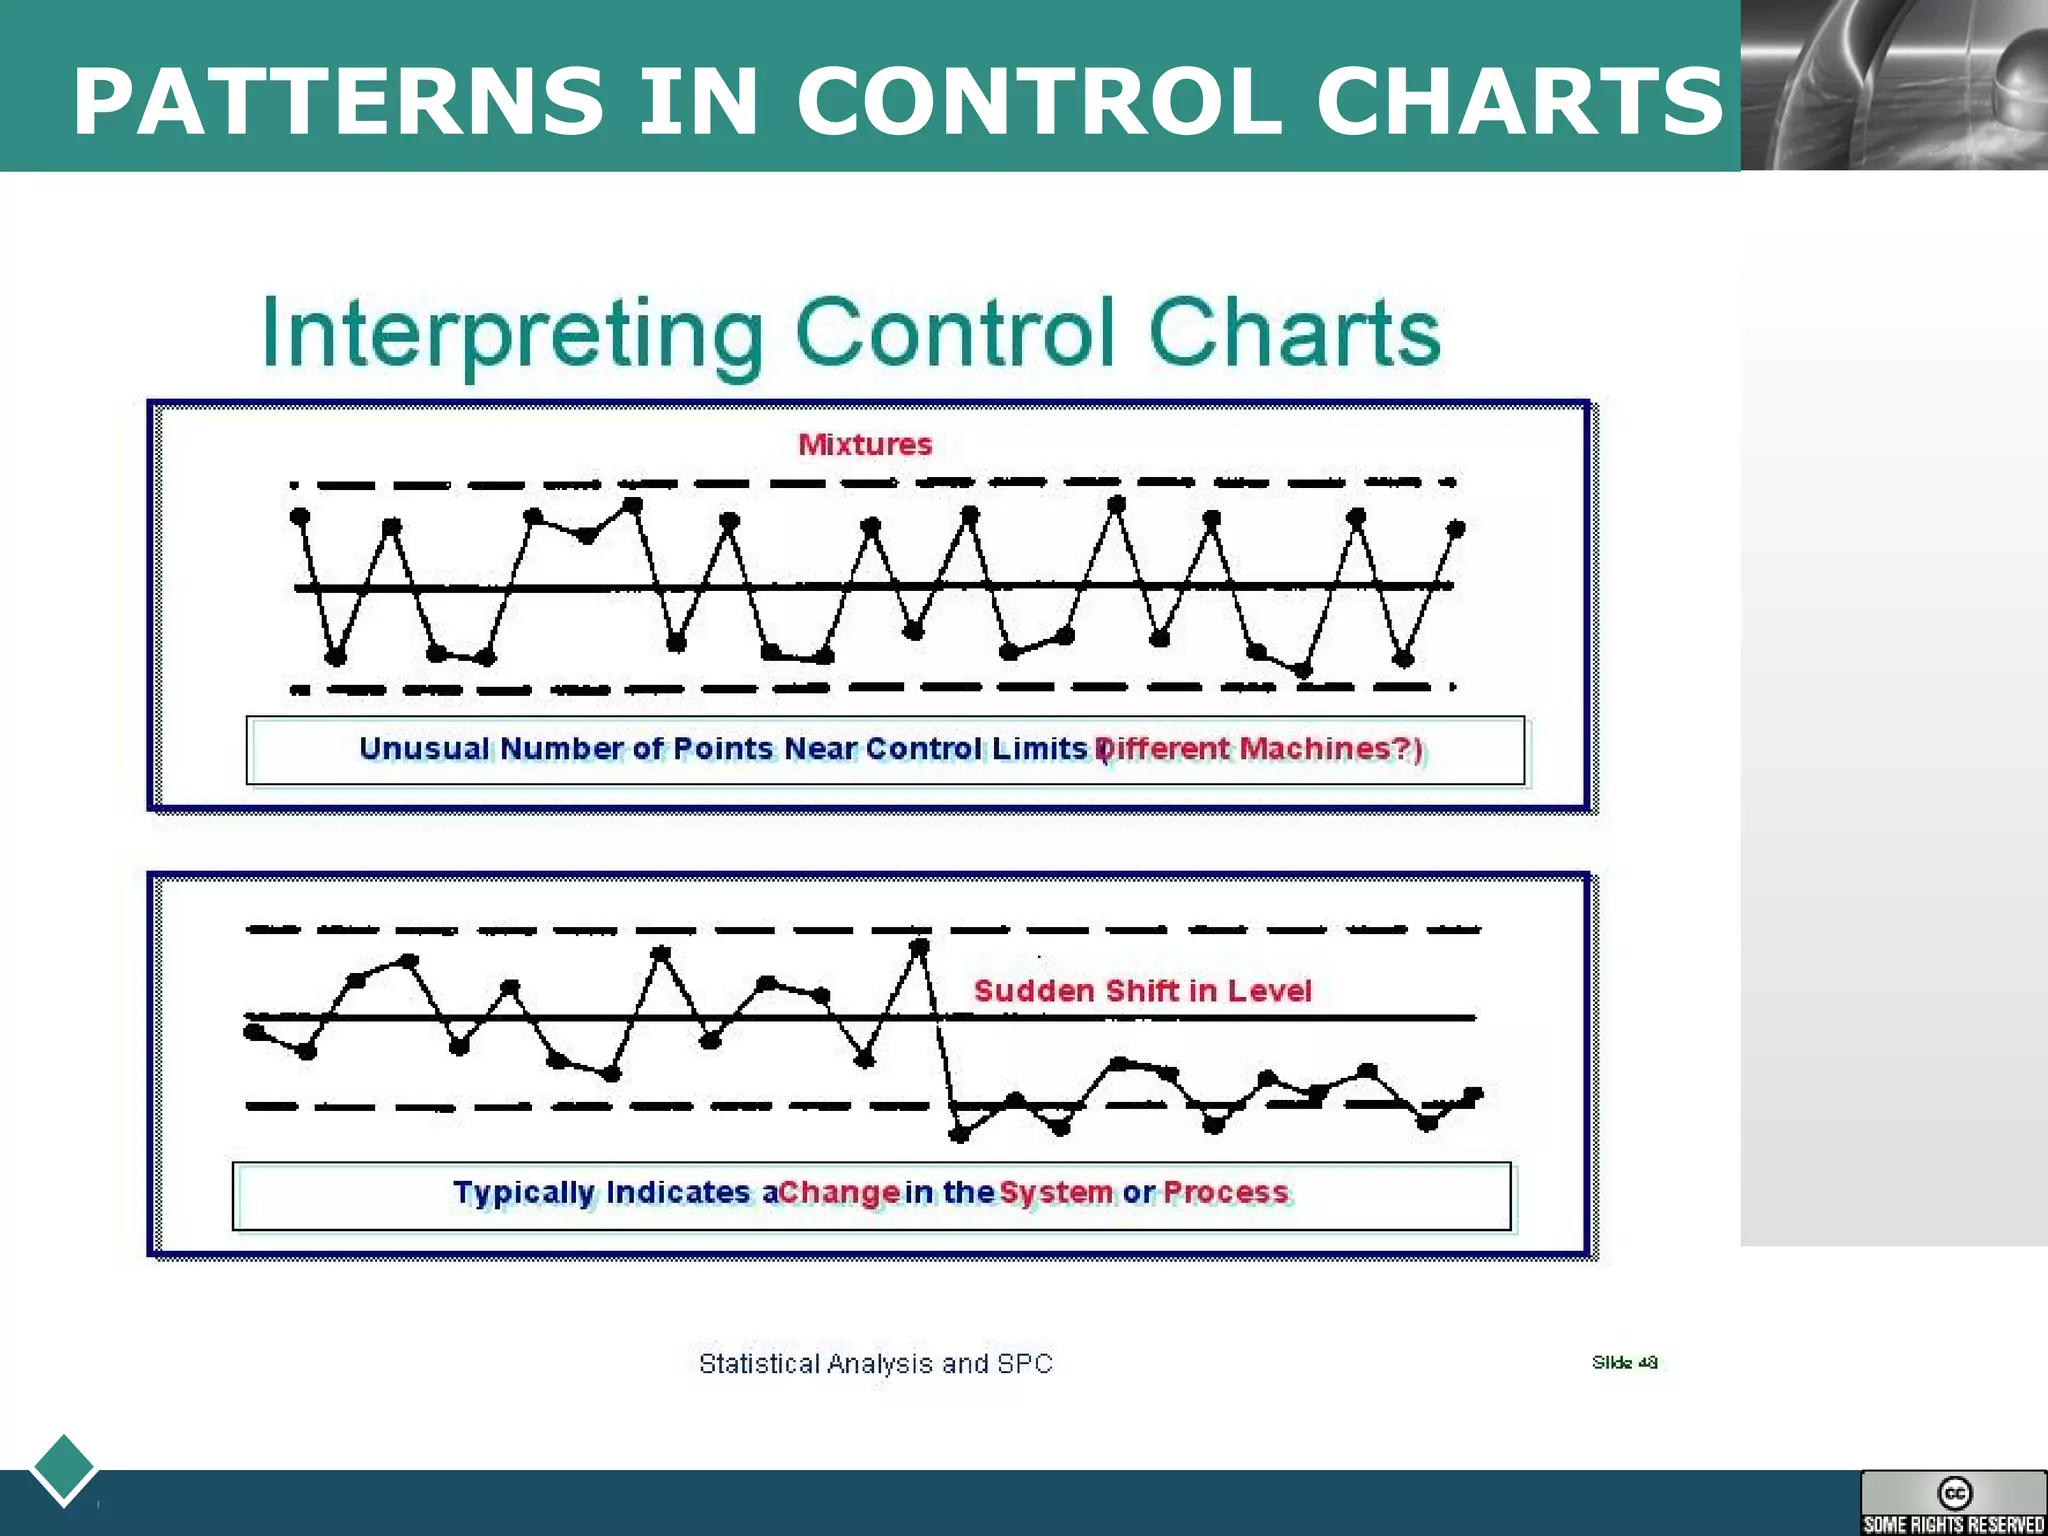


Control charts are statistical tools used to monitor processes and distinguish between common and special cause variations. They graphically display process stability over time and can provide early warnings if a process becomes out of control. The X-bar and R chart is used for variables data with subgroup sizes of 2-15. It involves calculating the mean and range for each subgroup, then determining control limits based on the grand mean and average range. Patterns outside the control limits or showing trends over time indicate the process may need investigation.


![Control Charts[1]](https://cdn.slidesharecdn.com/ss_thumbnails/controlcharts1-1226961283054520-8-thumbnail.jpg?width=640&height=640&fit=bounds)


