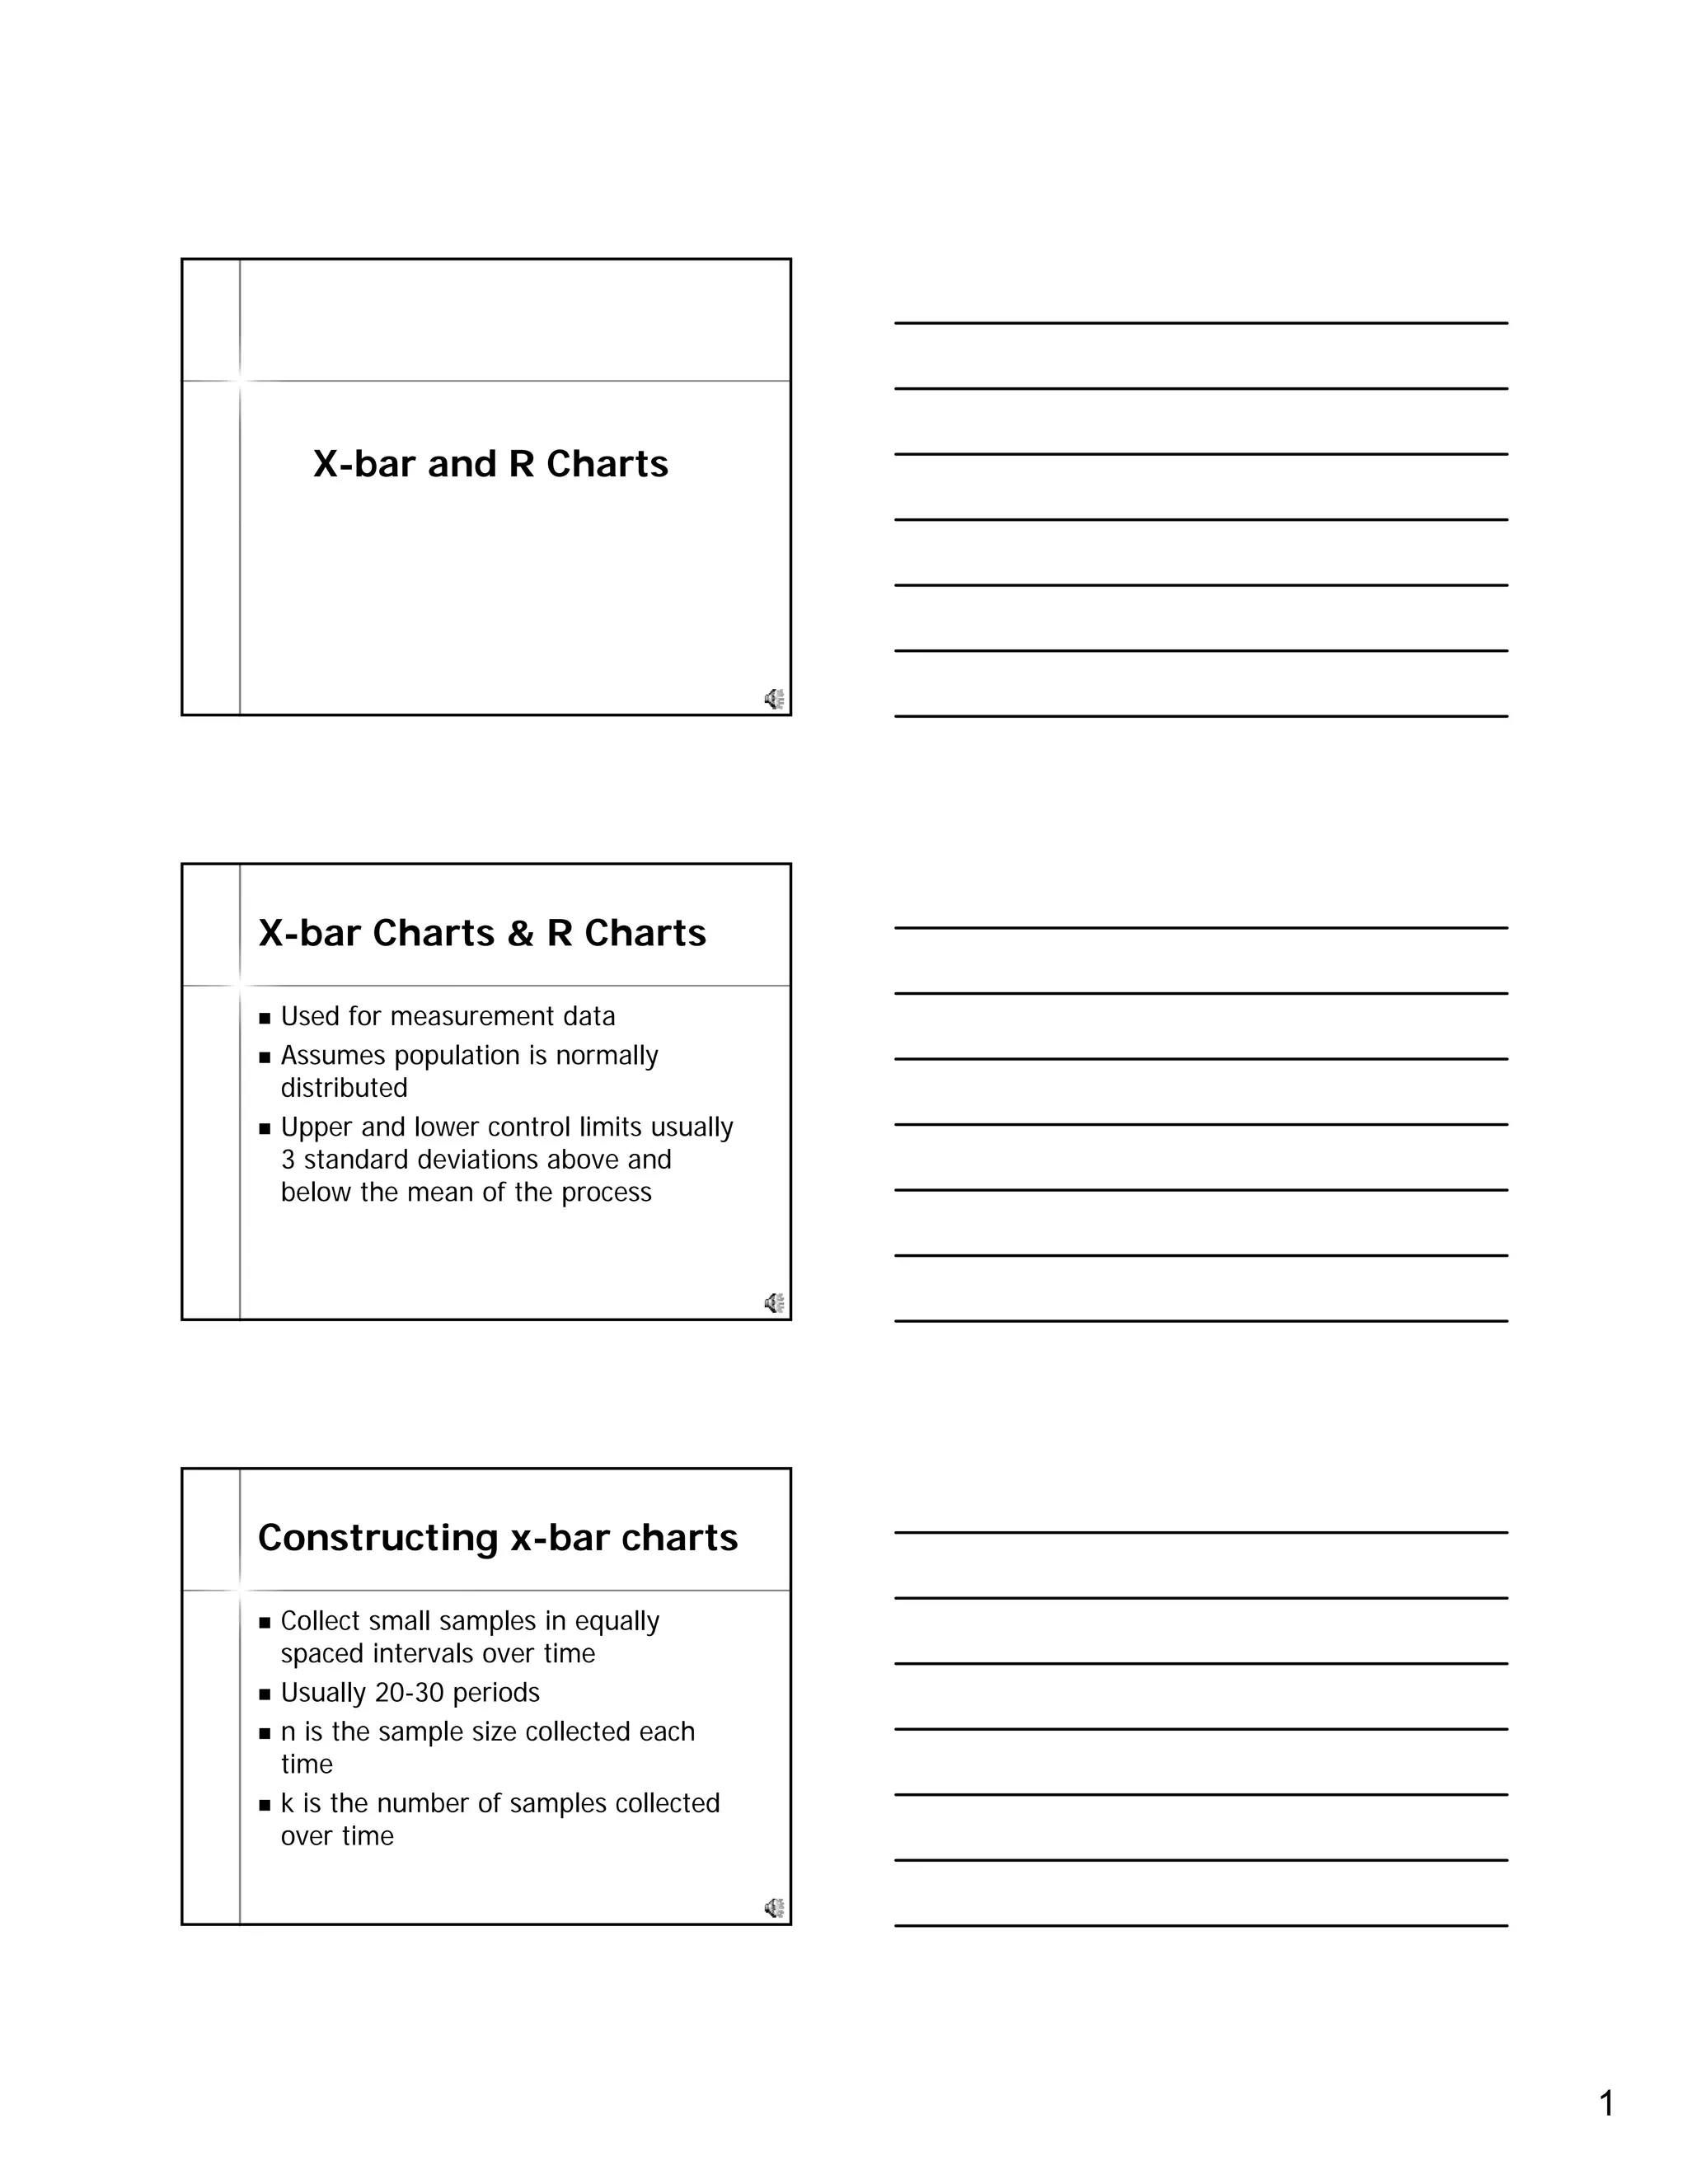
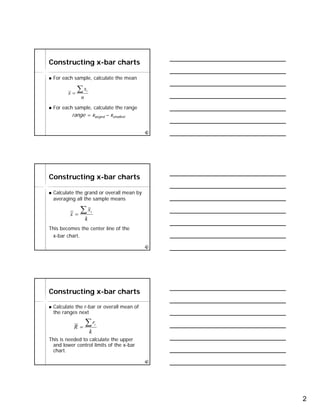
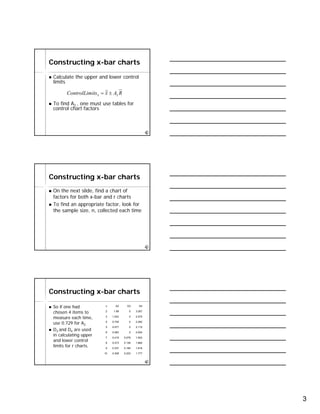
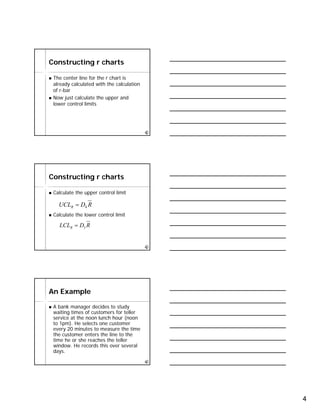
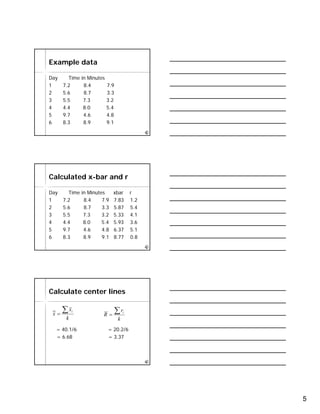
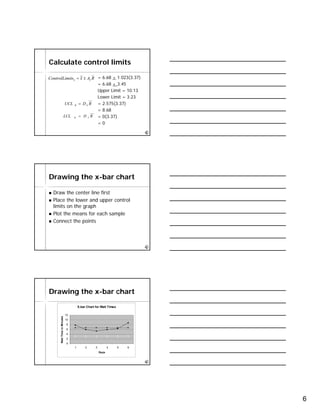
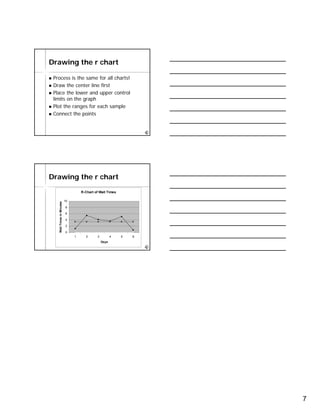
SlideShare a Scribd company logo
1 of 7
Download to read offline
1
X-bar and R Charts
X-bar Charts & R Charts
Used for measurement data
Assumes population is normally
distributed
Upper and lower control limits usually
3 standard deviations above and
below the mean of the process
Constructing x-bar charts
Collect small samples in equally
spaced intervals over time
Usually 20-30 periods
n is the sample size collected each
time
k is the number of samples collected
over time
2
Constructing x-bar charts
For each sample, calculate the mean
For each sample, calculate the range
range = xlargest – xsmallest
n
x
x i∑=
Constructing x-bar charts
Calculate the grand or overall mean by
averaging all the sample means
This becomes the center line of the
x-bar chart.
k
x
x
i∑=
Constructing x-bar charts
Calculate the r-bar or overall mean of
the ranges next
This is needed to calculate the upper
and lower control limits of the x-bar
chart.
k
r
R
i∑=
3
Constructing x-bar charts
Calculate the upper and lower control
limits
To find A2,, one must use tables for
control chart factors
RAxitsControlLim x 2±=
Constructing x-bar charts
On the next slide, find a chart of
factors for both x-bar and r charts
To find an appropriate factor, look for
the sample size, n, collected each time
Constructing x-bar charts
So if one had
chosen 4 items to
measure each time,
use 0.729 for A2.
D3 and D4 are used
in calculating upper
and lower control
limits for r charts.
1.7770.2230.30810
1.8160.1840.3379
1.8640.1360.3738
1.9240.0760.4197
2.00400.4836
2.11500.5775
2.28200.7294
2.57501.0233
3.26701.882
D4D3A2n
4
Constructing r charts
The center line for the r chart is
already calculated with the calculation
of r-bar
Now just calculate the upper and
lower control limits
Constructing r charts
Calculate the upper control limit
Calculate the lower control limit
RDUCLR 4=
RDLCLR 3=
An Example
A bank manager decides to study
waiting times of customers for teller
service at the noon lunch hour (noon
to 1pm). He selects one customer
every 20 minutes to measure the time
the customer enters the line to the
time he or she reaches the teller
window. He records this over several
days.
5
Example data
Day Time in Minutes
1 7.2 8.4 7.9
2 5.6 8.7 3.3
3 5.5 7.3 3.2
4 4.4 8.0 5.4
5 9.7 4.6 4.8
6 8.3 8.9 9.1
Calculated x-bar and r
Day Time in Minutes xbar r
1 7.2 8.4 7.9 7.83 1.2
2 5.6 8.7 3.3 5.87 5.4
3 5.5 7.3 3.2 5.33 4.1
4 4.4 8.0 5.4 5.93 3.6
5 9.7 4.6 4.8 6.37 5.1
6 8.3 8.9 9.1 8.77 0.8
Calculate center lines
= 40.1/6 = 20.2/6
= 6.68 = 3.37
k
r
R
i∑=
k
x
x
i∑=
6
Calculate control limits
= 6.68 + 1.023(3.37)
= 6.68 + 3.45
Upper Limit = 10.13
Lower Limit = 3.23
= 2.575(3.37)
= 8.68
= 0(3.37)
= 0
RAxitsControlLim x 2±=
RDUCL R 4=
RDLCL R 3=
Drawing the x-bar chart
Draw the center line first
Place the lower and upper control
limits on the graph
Plot the means for each sample
Connect the points
Drawing the x-bar chart
X-bar Chart for Wait Times
0
2
4
6
8
10
12
1 2 3 4 5 6
Days
WaitTimeinMinutes
7
Drawing the r chart
Process is the same for all charts!
Draw the center line first
Place the lower and upper control
limits on the graph
Plot the ranges for each sample
Connect the points
Drawing the r chart
R-Chart of Wait Times
0
2
4
6
8
10
1 2 3 4 5 6
Days
WaitTimesinMinutes

More Related Content

What's hot

Msa manual 4 th edition
Msa manual 4 th editionMsa manual 4 th edition
Msa manual 4 th editionSANKUSI
 
Data handling Presentation with solved examples
Data handling Presentation with solved examplesData handling Presentation with solved examples
Data handling Presentation with solved examplesrithikkapoor7
 
Exploring Quadratic Functions
Exploring Quadratic FunctionsExploring Quadratic Functions
Exploring Quadratic FunctionsBitsy Griffin
 
Md university cmis 102 week 3 hands
Md university cmis 102 week 3 handsMd university cmis 102 week 3 hands
Md university cmis 102 week 3 handseyavagal
 
Regression analysis in excel
Regression analysis in excelRegression analysis in excel
Regression analysis in excelAwais Salman
 
17 large scale machine learning
17 large scale machine learning17 large scale machine learning
17 large scale machine learningTanmayVijay1
 
Exploring Right Triangles A B C Chart
Exploring  Right  Triangles A B C ChartExploring  Right  Triangles A B C Chart
Exploring Right Triangles A B C ChartShelly Landau
 
Rt climate graph
Rt climate graphRt climate graph
Rt climate graphjwt1991
 
Intro to the Climate graph
Intro to the Climate graphIntro to the Climate graph
Intro to the Climate graphRichard McLaren
 
Rt climate graph
Rt climate graphRt climate graph
Rt climate graphjwt1991
 

What's hot (15)

Summer lecture 2
Summer lecture 2Summer lecture 2
Summer lecture 2
 
Data handling -
Data handling  -Data handling  -
Data handling -
 
Msa manual 4 th edition
Msa manual 4 th editionMsa manual 4 th edition
Msa manual 4 th edition
 
control charts
control chartscontrol charts
control charts
 
Data handling Presentation with solved examples
Data handling Presentation with solved examplesData handling Presentation with solved examples
Data handling Presentation with solved examples
 
Exploring Quadratic Functions
Exploring Quadratic FunctionsExploring Quadratic Functions
Exploring Quadratic Functions
 
Md university cmis 102 week 3 hands
Md university cmis 102 week 3 handsMd university cmis 102 week 3 hands
Md university cmis 102 week 3 hands
 
Monitoring Processes
Monitoring ProcessesMonitoring Processes
Monitoring Processes
 
Regression analysis in excel
Regression analysis in excelRegression analysis in excel
Regression analysis in excel
 
17 large scale machine learning
17 large scale machine learning17 large scale machine learning
17 large scale machine learning
 
Exploring Right Triangles A B C Chart
Exploring  Right  Triangles A B C ChartExploring  Right  Triangles A B C Chart
Exploring Right Triangles A B C Chart
 
Graphs in science
Graphs in scienceGraphs in science
Graphs in science
 
Rt climate graph
Rt climate graphRt climate graph
Rt climate graph
 
Intro to the Climate graph
Intro to the Climate graphIntro to the Climate graph
Intro to the Climate graph
 
Rt climate graph
Rt climate graphRt climate graph
Rt climate graph
 

Similar to Bbc2 eb x-bar---r-chart-example

JF608: Quality Control - Unit 3
JF608: Quality Control - Unit 3JF608: Quality Control - Unit 3
JF608: Quality Control - Unit 3Asraf Malik
 
X bar and R control charts
X bar and R control chartsX bar and R control charts
X bar and R control chartsDhruv Shah
 
Value at Risk Engine
Value at Risk EngineValue at Risk Engine
Value at Risk EngineLov Loothra
 
Monte Carlo simulation : Simulation using MCSM
Monte Carlo simulation : Simulation using MCSMMonte Carlo simulation : Simulation using MCSM
Monte Carlo simulation : Simulation using MCSMRavindra Nath Shukla
 
X Bar And S Charts Mini Tutorial
X Bar And S Charts Mini TutorialX Bar And S Charts Mini Tutorial
X Bar And S Charts Mini Tutorialahmad bassiouny
 
Lecture-2 Descriptive Statistics-Box Plot Descriptive Measures.pdf
Lecture-2 Descriptive Statistics-Box Plot  Descriptive Measures.pdfLecture-2 Descriptive Statistics-Box Plot  Descriptive Measures.pdf
Lecture-2 Descriptive Statistics-Box Plot Descriptive Measures.pdfAzanHaider1
 
Control Charts in Lab and Trend Analysis
Control Charts in Lab and Trend AnalysisControl Charts in Lab and Trend Analysis
Control Charts in Lab and Trend Analysissigmatest2011
 
Matlab intro notes
Matlab intro notesMatlab intro notes
Matlab intro notespawanss
 
A practical work of matlab
A practical work of matlabA practical work of matlab
A practical work of matlabSalanSD
 

Similar to Bbc2 eb x-bar---r-chart-example (20)

Control charts
Control chartsControl charts
Control charts
 
JF608: Quality Control - Unit 3
JF608: Quality Control - Unit 3JF608: Quality Control - Unit 3
JF608: Quality Control - Unit 3
 
X‾ and r charts
X‾ and r chartsX‾ and r charts
X‾ and r charts
 
Spc la
Spc laSpc la
Spc la
 
X Bar R Charts
X Bar R ChartsX Bar R Charts
X Bar R Charts
 
X Bar R Charts
X Bar R ChartsX Bar R Charts
X Bar R Charts
 
X bar and R control charts
X bar and R control chartsX bar and R control charts
X bar and R control charts
 
Value at Risk Engine
Value at Risk EngineValue at Risk Engine
Value at Risk Engine
 
Monte Carlo simulation : Simulation using MCSM
Monte Carlo simulation : Simulation using MCSMMonte Carlo simulation : Simulation using MCSM
Monte Carlo simulation : Simulation using MCSM
 
Six sigma
Six sigma Six sigma
Six sigma
 
Six sigma pedagogy
Six sigma pedagogySix sigma pedagogy
Six sigma pedagogy
 
Control charts
Control chartsControl charts
Control charts
 
X Bar And S Charts Mini Tutorial
X Bar And S Charts Mini TutorialX Bar And S Charts Mini Tutorial
X Bar And S Charts Mini Tutorial
 
Lecture-2 Descriptive Statistics-Box Plot Descriptive Measures.pdf
Lecture-2 Descriptive Statistics-Box Plot  Descriptive Measures.pdfLecture-2 Descriptive Statistics-Box Plot  Descriptive Measures.pdf
Lecture-2 Descriptive Statistics-Box Plot Descriptive Measures.pdf
 
Control Charts in Lab and Trend Analysis
Control Charts in Lab and Trend AnalysisControl Charts in Lab and Trend Analysis
Control Charts in Lab and Trend Analysis
 
Matlab intro notes
Matlab intro notesMatlab intro notes
Matlab intro notes
 
Regression
RegressionRegression
Regression
 
Statistics
StatisticsStatistics
Statistics
 
A practical work of matlab
A practical work of matlabA practical work of matlab
A practical work of matlab
 
Matlabch01
Matlabch01Matlabch01
Matlabch01
 

Recently uploaded

(SHREYA) Chakan Call Girls Just Call 7001035870 [ Cash on Delivery ] Pune Esc...
(SHREYA) Chakan Call Girls Just Call 7001035870 [ Cash on Delivery ] Pune Esc...(SHREYA) Chakan Call Girls Just Call 7001035870 [ Cash on Delivery ] Pune Esc...
(SHREYA) Chakan Call Girls Just Call 7001035870 [ Cash on Delivery ] Pune Esc...ranjana rawat
 
VIP Call Girls Service Kondapur Hyderabad Call +91-8250192130
VIP Call Girls Service Kondapur Hyderabad Call +91-8250192130VIP Call Girls Service Kondapur Hyderabad Call +91-8250192130
VIP Call Girls Service Kondapur Hyderabad Call +91-8250192130Suhani Kapoor
 
Call Girls Service Nagpur Tanvi Call 7001035870 Meet With Nagpur Escorts
Call Girls Service Nagpur Tanvi Call 7001035870 Meet With Nagpur EscortsCall Girls Service Nagpur Tanvi Call 7001035870 Meet With Nagpur Escorts
Call Girls Service Nagpur Tanvi Call 7001035870 Meet With Nagpur EscortsCall Girls in Nagpur High Profile
 
OSVC_Meta-Data based Simulation Automation to overcome Verification Challenge...
OSVC_Meta-Data based Simulation Automation to overcome Verification Challenge...OSVC_Meta-Data based Simulation Automation to overcome Verification Challenge...
OSVC_Meta-Data based Simulation Automation to overcome Verification Challenge...Soham Mondal
 
Introduction to IEEE STANDARDS and its different types.pptx
Introduction to IEEE STANDARDS and its different types.pptxIntroduction to IEEE STANDARDS and its different types.pptx
Introduction to IEEE STANDARDS and its different types.pptxupamatechverse
 
Top Rated Pune Call Girls Budhwar Peth ⟟ 6297143586 ⟟ Call Me For Genuine Se...
Top Rated  Pune Call Girls Budhwar Peth ⟟ 6297143586 ⟟ Call Me For Genuine Se...Top Rated  Pune Call Girls Budhwar Peth ⟟ 6297143586 ⟟ Call Me For Genuine Se...
Top Rated Pune Call Girls Budhwar Peth ⟟ 6297143586 ⟟ Call Me For Genuine Se...Call Girls in Nagpur High Profile
 
Sheet Pile Wall Design and Construction: A Practical Guide for Civil Engineer...
Sheet Pile Wall Design and Construction: A Practical Guide for Civil Engineer...Sheet Pile Wall Design and Construction: A Practical Guide for Civil Engineer...
Sheet Pile Wall Design and Construction: A Practical Guide for Civil Engineer...Dr.Costas Sachpazis
 
KubeKraft presentation @CloudNativeHooghly
KubeKraft presentation @CloudNativeHooghlyKubeKraft presentation @CloudNativeHooghly
KubeKraft presentation @CloudNativeHooghlysanyuktamishra911
 
result management system report for college project
result management system report for college projectresult management system report for college project
result management system report for college projectTonystark477637
 
(RIA) Call Girls Bhosari ( 7001035870 ) HI-Fi Pune Escorts Service
(RIA) Call Girls Bhosari ( 7001035870 ) HI-Fi Pune Escorts Service(RIA) Call Girls Bhosari ( 7001035870 ) HI-Fi Pune Escorts Service
(RIA) Call Girls Bhosari ( 7001035870 ) HI-Fi Pune Escorts Serviceranjana rawat
 
UNIT-V FMM.HYDRAULIC TURBINE - Construction and working
UNIT-V FMM.HYDRAULIC TURBINE - Construction and workingUNIT-V FMM.HYDRAULIC TURBINE - Construction and working
UNIT-V FMM.HYDRAULIC TURBINE - Construction and workingrknatarajan
 
Introduction to Multiple Access Protocol.pptx
Introduction to Multiple Access Protocol.pptxIntroduction to Multiple Access Protocol.pptx
Introduction to Multiple Access Protocol.pptxupamatechverse
 
CCS335 _ Neural Networks and Deep Learning Laboratory_Lab Complete Record
CCS335 _ Neural Networks and Deep Learning Laboratory_Lab Complete RecordCCS335 _ Neural Networks and Deep Learning Laboratory_Lab Complete Record
CCS335 _ Neural Networks and Deep Learning Laboratory_Lab Complete RecordAsst.prof M.Gokilavani
 
IMPLICATIONS OF THE ABOVE HOLISTIC UNDERSTANDING OF HARMONY ON PROFESSIONAL E...
IMPLICATIONS OF THE ABOVE HOLISTIC UNDERSTANDING OF HARMONY ON PROFESSIONAL E...IMPLICATIONS OF THE ABOVE HOLISTIC UNDERSTANDING OF HARMONY ON PROFESSIONAL E...
IMPLICATIONS OF THE ABOVE HOLISTIC UNDERSTANDING OF HARMONY ON PROFESSIONAL E...RajaP95
 
(ANVI) Koregaon Park Call Girls Just Call 7001035870 [ Cash on Delivery ] Pun...
(ANVI) Koregaon Park Call Girls Just Call 7001035870 [ Cash on Delivery ] Pun...(ANVI) Koregaon Park Call Girls Just Call 7001035870 [ Cash on Delivery ] Pun...
(ANVI) Koregaon Park Call Girls Just Call 7001035870 [ Cash on Delivery ] Pun...ranjana rawat
 
APPLICATIONS-AC/DC DRIVES-OPERATING CHARACTERISTICS
APPLICATIONS-AC/DC DRIVES-OPERATING CHARACTERISTICSAPPLICATIONS-AC/DC DRIVES-OPERATING CHARACTERISTICS
APPLICATIONS-AC/DC DRIVES-OPERATING CHARACTERISTICSKurinjimalarL3
 
VIP Call Girls Service Hitech City Hyderabad Call +91-8250192130
VIP Call Girls Service Hitech City Hyderabad Call +91-8250192130VIP Call Girls Service Hitech City Hyderabad Call +91-8250192130
VIP Call Girls Service Hitech City Hyderabad Call +91-8250192130Suhani Kapoor
 
The Most Attractive Pune Call Girls Budhwar Peth 8250192130 Will You Miss Thi...
The Most Attractive Pune Call Girls Budhwar Peth 8250192130 Will You Miss Thi...The Most Attractive Pune Call Girls Budhwar Peth 8250192130 Will You Miss Thi...
The Most Attractive Pune Call Girls Budhwar Peth 8250192130 Will You Miss Thi...ranjana rawat
 

Recently uploaded (20)

(SHREYA) Chakan Call Girls Just Call 7001035870 [ Cash on Delivery ] Pune Esc...
(SHREYA) Chakan Call Girls Just Call 7001035870 [ Cash on Delivery ] Pune Esc...(SHREYA) Chakan Call Girls Just Call 7001035870 [ Cash on Delivery ] Pune Esc...
(SHREYA) Chakan Call Girls Just Call 7001035870 [ Cash on Delivery ] Pune Esc...
 
VIP Call Girls Service Kondapur Hyderabad Call +91-8250192130
VIP Call Girls Service Kondapur Hyderabad Call +91-8250192130VIP Call Girls Service Kondapur Hyderabad Call +91-8250192130
VIP Call Girls Service Kondapur Hyderabad Call +91-8250192130
 
Call Girls Service Nagpur Tanvi Call 7001035870 Meet With Nagpur Escorts
Call Girls Service Nagpur Tanvi Call 7001035870 Meet With Nagpur EscortsCall Girls Service Nagpur Tanvi Call 7001035870 Meet With Nagpur Escorts
Call Girls Service Nagpur Tanvi Call 7001035870 Meet With Nagpur Escorts
 
OSVC_Meta-Data based Simulation Automation to overcome Verification Challenge...
OSVC_Meta-Data based Simulation Automation to overcome Verification Challenge...OSVC_Meta-Data based Simulation Automation to overcome Verification Challenge...
OSVC_Meta-Data based Simulation Automation to overcome Verification Challenge...
 
Introduction to IEEE STANDARDS and its different types.pptx
Introduction to IEEE STANDARDS and its different types.pptxIntroduction to IEEE STANDARDS and its different types.pptx
Introduction to IEEE STANDARDS and its different types.pptx
 
DJARUM4D - SLOT GACOR ONLINE | SLOT DEMO ONLINE
DJARUM4D - SLOT GACOR ONLINE | SLOT DEMO ONLINEDJARUM4D - SLOT GACOR ONLINE | SLOT DEMO ONLINE
DJARUM4D - SLOT GACOR ONLINE | SLOT DEMO ONLINE
 
Top Rated Pune Call Girls Budhwar Peth ⟟ 6297143586 ⟟ Call Me For Genuine Se...
Top Rated  Pune Call Girls Budhwar Peth ⟟ 6297143586 ⟟ Call Me For Genuine Se...Top Rated  Pune Call Girls Budhwar Peth ⟟ 6297143586 ⟟ Call Me For Genuine Se...
Top Rated Pune Call Girls Budhwar Peth ⟟ 6297143586 ⟟ Call Me For Genuine Se...
 
Sheet Pile Wall Design and Construction: A Practical Guide for Civil Engineer...
Sheet Pile Wall Design and Construction: A Practical Guide for Civil Engineer...Sheet Pile Wall Design and Construction: A Practical Guide for Civil Engineer...
Sheet Pile Wall Design and Construction: A Practical Guide for Civil Engineer...
 
KubeKraft presentation @CloudNativeHooghly
KubeKraft presentation @CloudNativeHooghlyKubeKraft presentation @CloudNativeHooghly
KubeKraft presentation @CloudNativeHooghly
 
result management system report for college project
result management system report for college projectresult management system report for college project
result management system report for college project
 
(RIA) Call Girls Bhosari ( 7001035870 ) HI-Fi Pune Escorts Service
(RIA) Call Girls Bhosari ( 7001035870 ) HI-Fi Pune Escorts Service(RIA) Call Girls Bhosari ( 7001035870 ) HI-Fi Pune Escorts Service
(RIA) Call Girls Bhosari ( 7001035870 ) HI-Fi Pune Escorts Service
 
UNIT-V FMM.HYDRAULIC TURBINE - Construction and working
UNIT-V FMM.HYDRAULIC TURBINE - Construction and workingUNIT-V FMM.HYDRAULIC TURBINE - Construction and working
UNIT-V FMM.HYDRAULIC TURBINE - Construction and working
 
Introduction to Multiple Access Protocol.pptx
Introduction to Multiple Access Protocol.pptxIntroduction to Multiple Access Protocol.pptx
Introduction to Multiple Access Protocol.pptx
 
CCS335 _ Neural Networks and Deep Learning Laboratory_Lab Complete Record
CCS335 _ Neural Networks and Deep Learning Laboratory_Lab Complete RecordCCS335 _ Neural Networks and Deep Learning Laboratory_Lab Complete Record
CCS335 _ Neural Networks and Deep Learning Laboratory_Lab Complete Record
 
IMPLICATIONS OF THE ABOVE HOLISTIC UNDERSTANDING OF HARMONY ON PROFESSIONAL E...
IMPLICATIONS OF THE ABOVE HOLISTIC UNDERSTANDING OF HARMONY ON PROFESSIONAL E...IMPLICATIONS OF THE ABOVE HOLISTIC UNDERSTANDING OF HARMONY ON PROFESSIONAL E...
IMPLICATIONS OF THE ABOVE HOLISTIC UNDERSTANDING OF HARMONY ON PROFESSIONAL E...
 
(ANVI) Koregaon Park Call Girls Just Call 7001035870 [ Cash on Delivery ] Pun...
(ANVI) Koregaon Park Call Girls Just Call 7001035870 [ Cash on Delivery ] Pun...(ANVI) Koregaon Park Call Girls Just Call 7001035870 [ Cash on Delivery ] Pun...
(ANVI) Koregaon Park Call Girls Just Call 7001035870 [ Cash on Delivery ] Pun...
 
APPLICATIONS-AC/DC DRIVES-OPERATING CHARACTERISTICS
APPLICATIONS-AC/DC DRIVES-OPERATING CHARACTERISTICSAPPLICATIONS-AC/DC DRIVES-OPERATING CHARACTERISTICS
APPLICATIONS-AC/DC DRIVES-OPERATING CHARACTERISTICS
 
Roadmap to Membership of RICS - Pathways and Routes
Roadmap to Membership of RICS - Pathways and RoutesRoadmap to Membership of RICS - Pathways and Routes
Roadmap to Membership of RICS - Pathways and Routes
 
VIP Call Girls Service Hitech City Hyderabad Call +91-8250192130
VIP Call Girls Service Hitech City Hyderabad Call +91-8250192130VIP Call Girls Service Hitech City Hyderabad Call +91-8250192130
VIP Call Girls Service Hitech City Hyderabad Call +91-8250192130
 
The Most Attractive Pune Call Girls Budhwar Peth 8250192130 Will You Miss Thi...
The Most Attractive Pune Call Girls Budhwar Peth 8250192130 Will You Miss Thi...The Most Attractive Pune Call Girls Budhwar Peth 8250192130 Will You Miss Thi...
The Most Attractive Pune Call Girls Budhwar Peth 8250192130 Will You Miss Thi...
 

Bbc2 eb x-bar---r-chart-example

  • 1. 1 X-bar and R Charts X-bar Charts & R Charts Used for measurement data Assumes population is normally distributed Upper and lower control limits usually 3 standard deviations above and below the mean of the process Constructing x-bar charts Collect small samples in equally spaced intervals over time Usually 20-30 periods n is the sample size collected each time k is the number of samples collected over time
  • 2. 2 Constructing x-bar charts For each sample, calculate the mean For each sample, calculate the range range = xlargest – xsmallest n x x i∑= Constructing x-bar charts Calculate the grand or overall mean by averaging all the sample means This becomes the center line of the x-bar chart. k x x i∑= Constructing x-bar charts Calculate the r-bar or overall mean of the ranges next This is needed to calculate the upper and lower control limits of the x-bar chart. k r R i∑=
  • 3. 3 Constructing x-bar charts Calculate the upper and lower control limits To find A2,, one must use tables for control chart factors RAxitsControlLim x 2±= Constructing x-bar charts On the next slide, find a chart of factors for both x-bar and r charts To find an appropriate factor, look for the sample size, n, collected each time Constructing x-bar charts So if one had chosen 4 items to measure each time, use 0.729 for A2. D3 and D4 are used in calculating upper and lower control limits for r charts. 1.7770.2230.30810 1.8160.1840.3379 1.8640.1360.3738 1.9240.0760.4197 2.00400.4836 2.11500.5775 2.28200.7294 2.57501.0233 3.26701.882 D4D3A2n
  • 4. 4 Constructing r charts The center line for the r chart is already calculated with the calculation of r-bar Now just calculate the upper and lower control limits Constructing r charts Calculate the upper control limit Calculate the lower control limit RDUCLR 4= RDLCLR 3= An Example A bank manager decides to study waiting times of customers for teller service at the noon lunch hour (noon to 1pm). He selects one customer every 20 minutes to measure the time the customer enters the line to the time he or she reaches the teller window. He records this over several days.
  • 5. 5 Example data Day Time in Minutes 1 7.2 8.4 7.9 2 5.6 8.7 3.3 3 5.5 7.3 3.2 4 4.4 8.0 5.4 5 9.7 4.6 4.8 6 8.3 8.9 9.1 Calculated x-bar and r Day Time in Minutes xbar r 1 7.2 8.4 7.9 7.83 1.2 2 5.6 8.7 3.3 5.87 5.4 3 5.5 7.3 3.2 5.33 4.1 4 4.4 8.0 5.4 5.93 3.6 5 9.7 4.6 4.8 6.37 5.1 6 8.3 8.9 9.1 8.77 0.8 Calculate center lines = 40.1/6 = 20.2/6 = 6.68 = 3.37 k r R i∑= k x x i∑=
  • 6. 6 Calculate control limits = 6.68 + 1.023(3.37) = 6.68 + 3.45 Upper Limit = 10.13 Lower Limit = 3.23 = 2.575(3.37) = 8.68 = 0(3.37) = 0 RAxitsControlLim x 2±= RDUCL R 4= RDLCL R 3= Drawing the x-bar chart Draw the center line first Place the lower and upper control limits on the graph Plot the means for each sample Connect the points Drawing the x-bar chart X-bar Chart for Wait Times 0 2 4 6 8 10 12 1 2 3 4 5 6 Days WaitTimeinMinutes
  • 7. 7 Drawing the r chart Process is the same for all charts! Draw the center line first Place the lower and upper control limits on the graph Plot the ranges for each sample Connect the points Drawing the r chart R-Chart of Wait Times 0 2 4 6 8 10 1 2 3 4 5 6 Days WaitTimesinMinutes