Downloaded 1,900 times


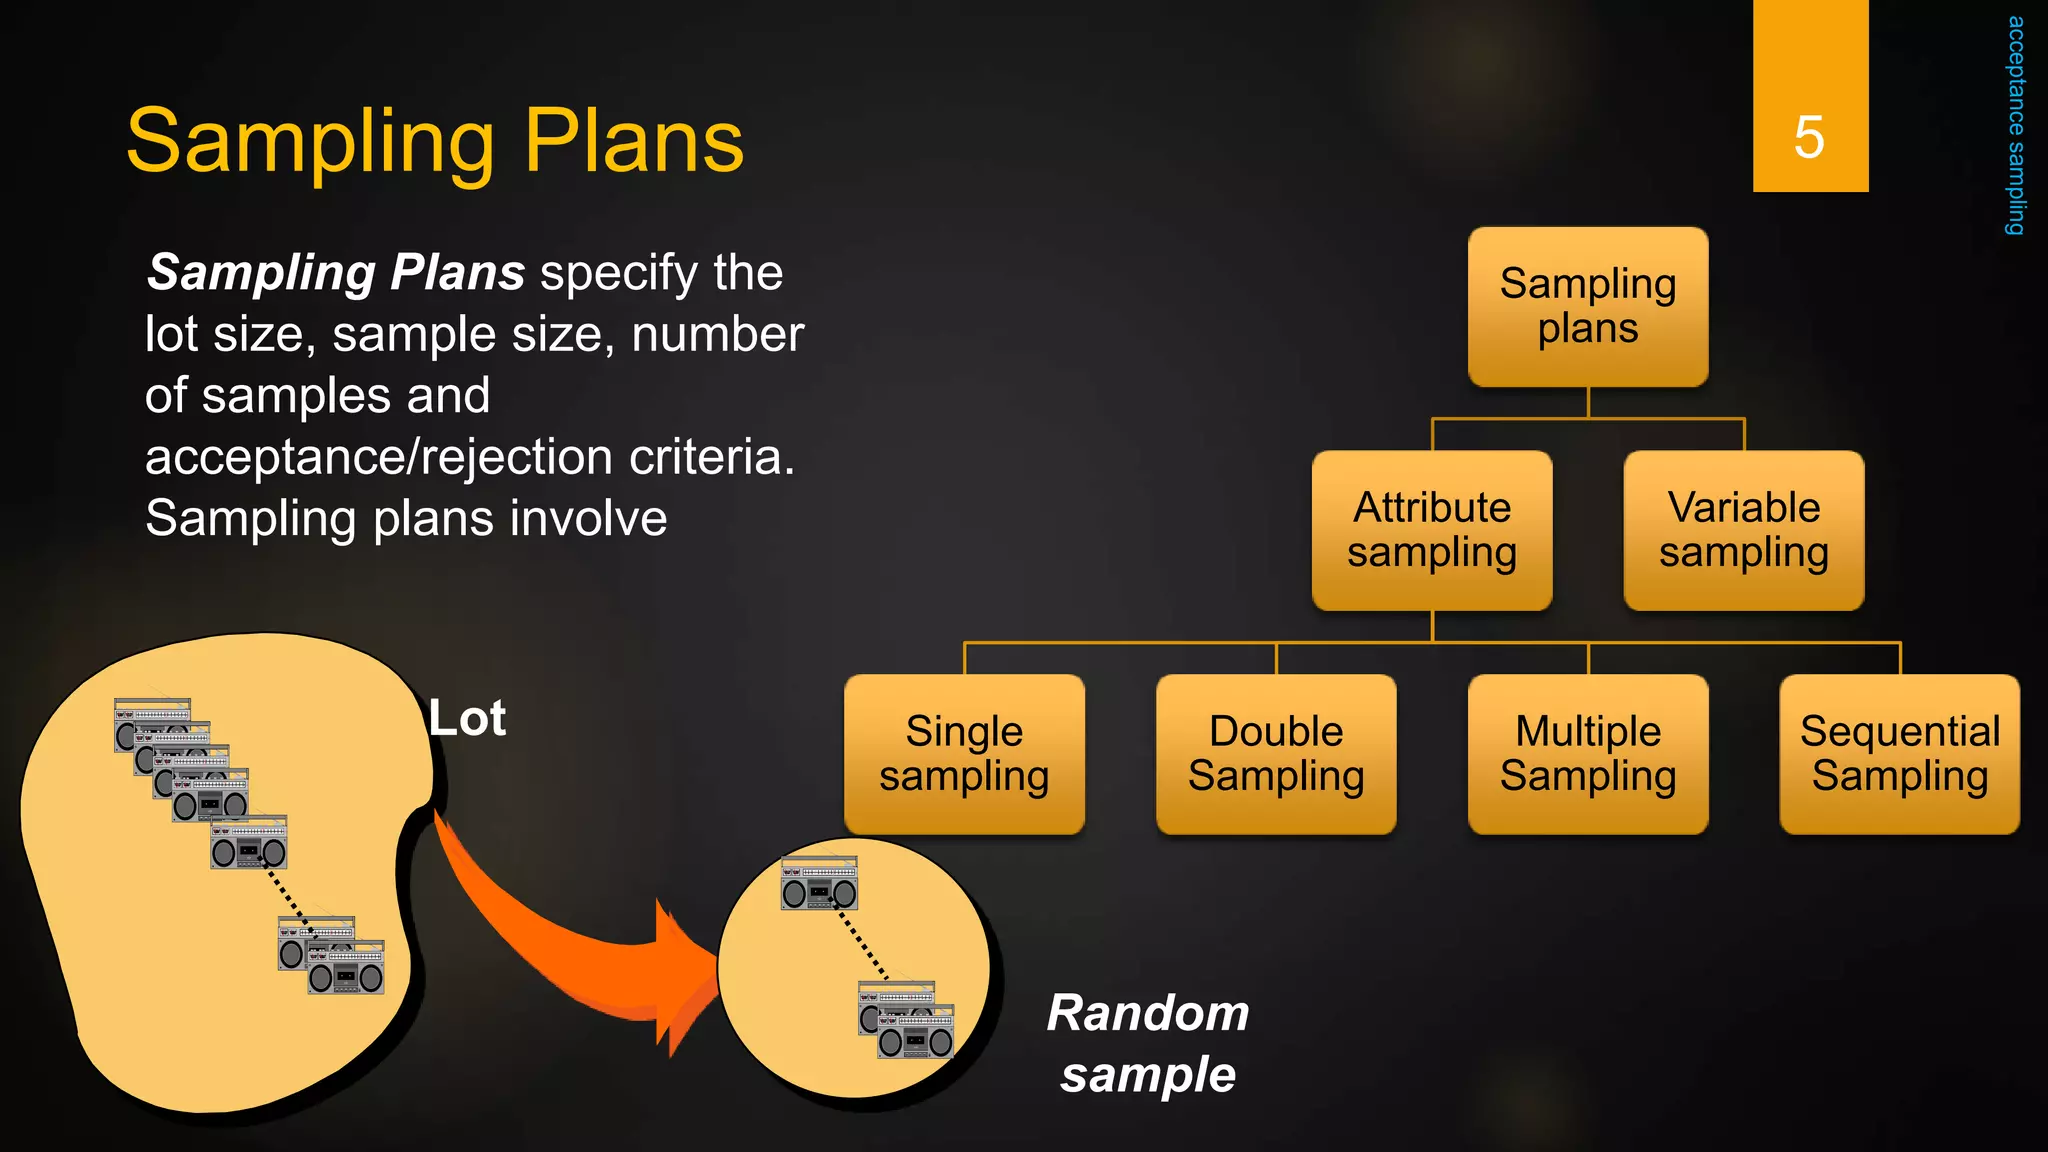


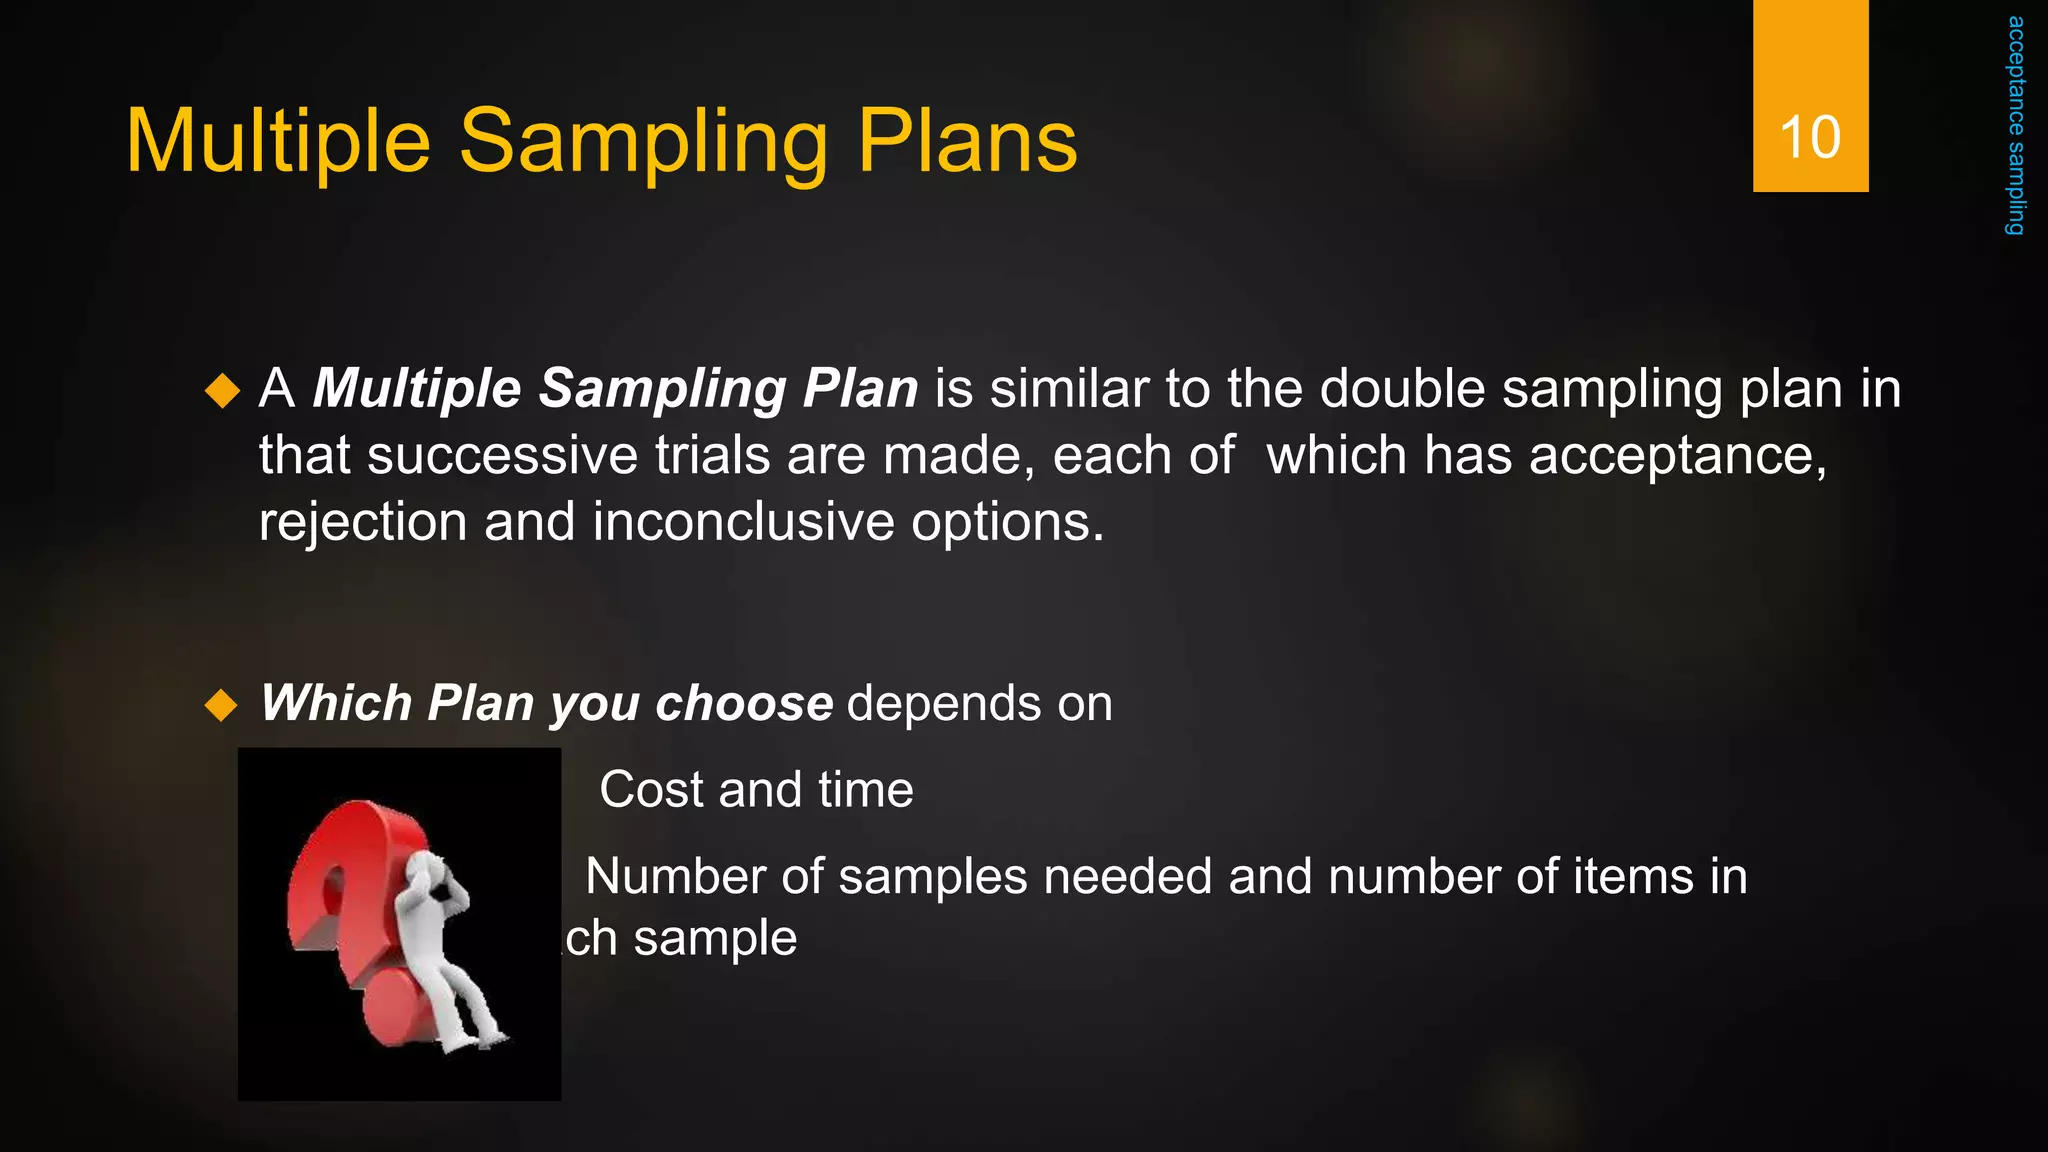


Acceptance sampling is a form of inspection where samples are taken from lots or batches to determine if the quality meets predetermined standards. There are different types of sampling plans like single, double, and multiple sampling plans that specify the lot size, sample size, acceptance and rejection criteria. Operating characteristic curves show the probability of accepting lots with different quality levels. Acceptance sampling reduces inspection costs compared to 100% inspection but introduces risks of accepting bad lots or rejecting good ones.


![Acceptance Sampling[1]](https://cdn.slidesharecdn.com/ss_thumbnails/acceptancesampling1-1226078569232381-9-thumbnail.jpg?width=640&height=640&fit=bounds)


![AcceptanceSampling for students uni[1].ppt](https://cdn.slidesharecdn.com/ss_thumbnails/acceptancesampling1-250204230443-7d8ea06b-thumbnail.jpg?width=640&height=640&fit=bounds)


![Acceptance Sampling[1]](https://cdn.slidesharecdn.com/ss_thumbnails/acceptancesampling1-1226960943251212-8-thumbnail.jpg?width=640&height=640&fit=bounds)


