Downloaded 93 times
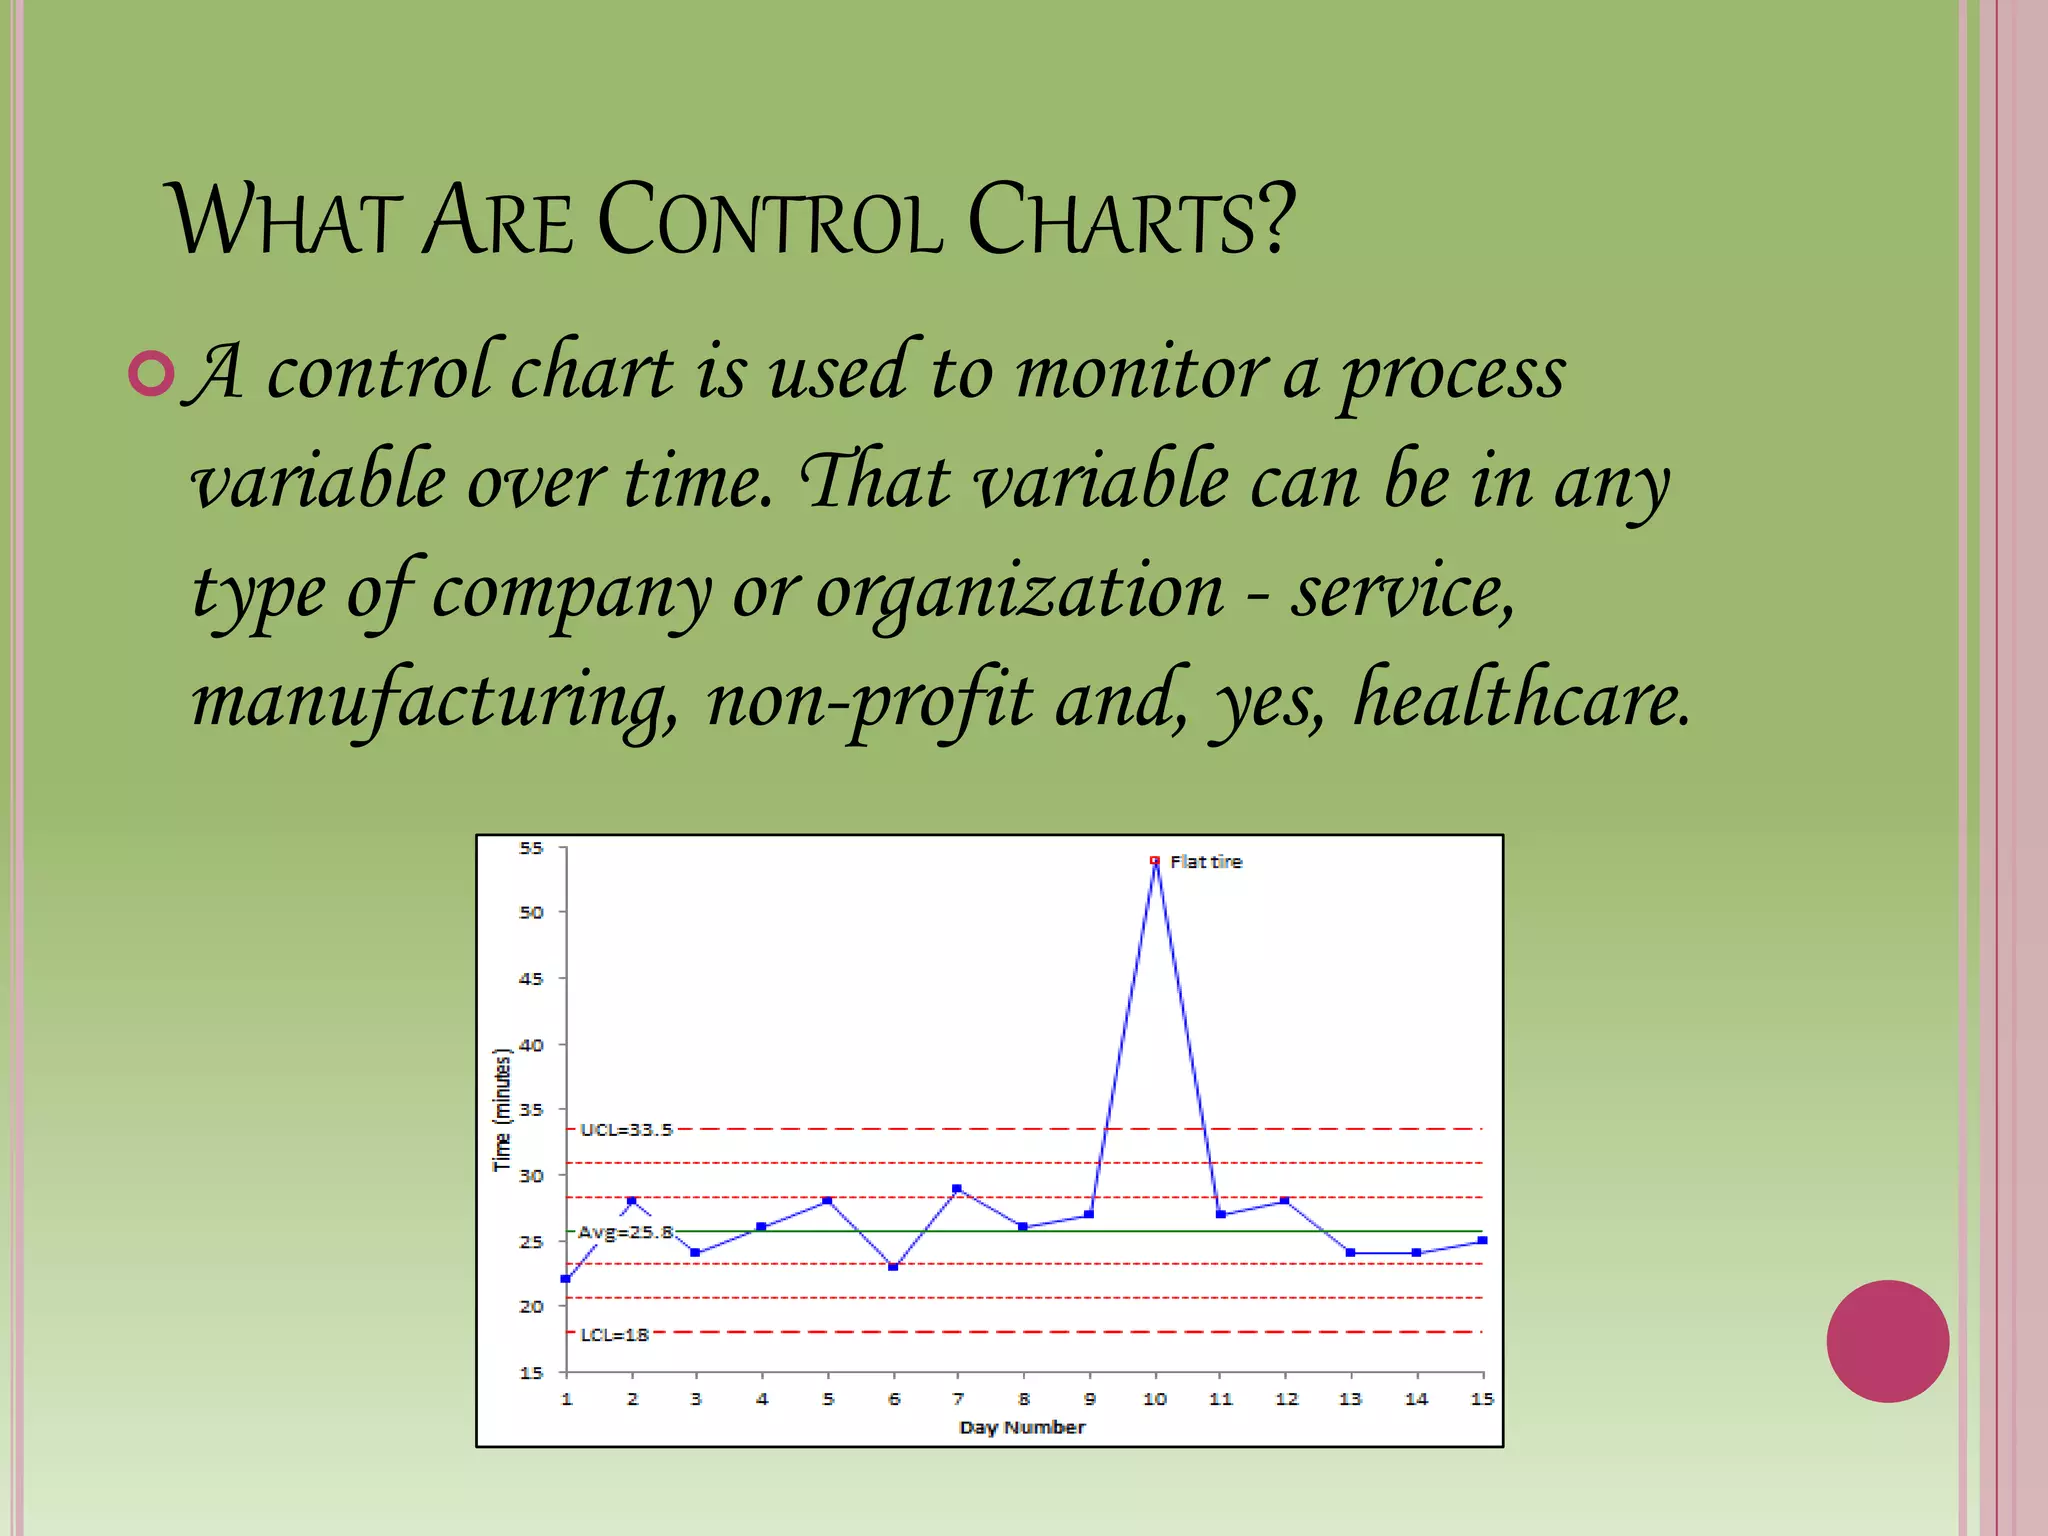

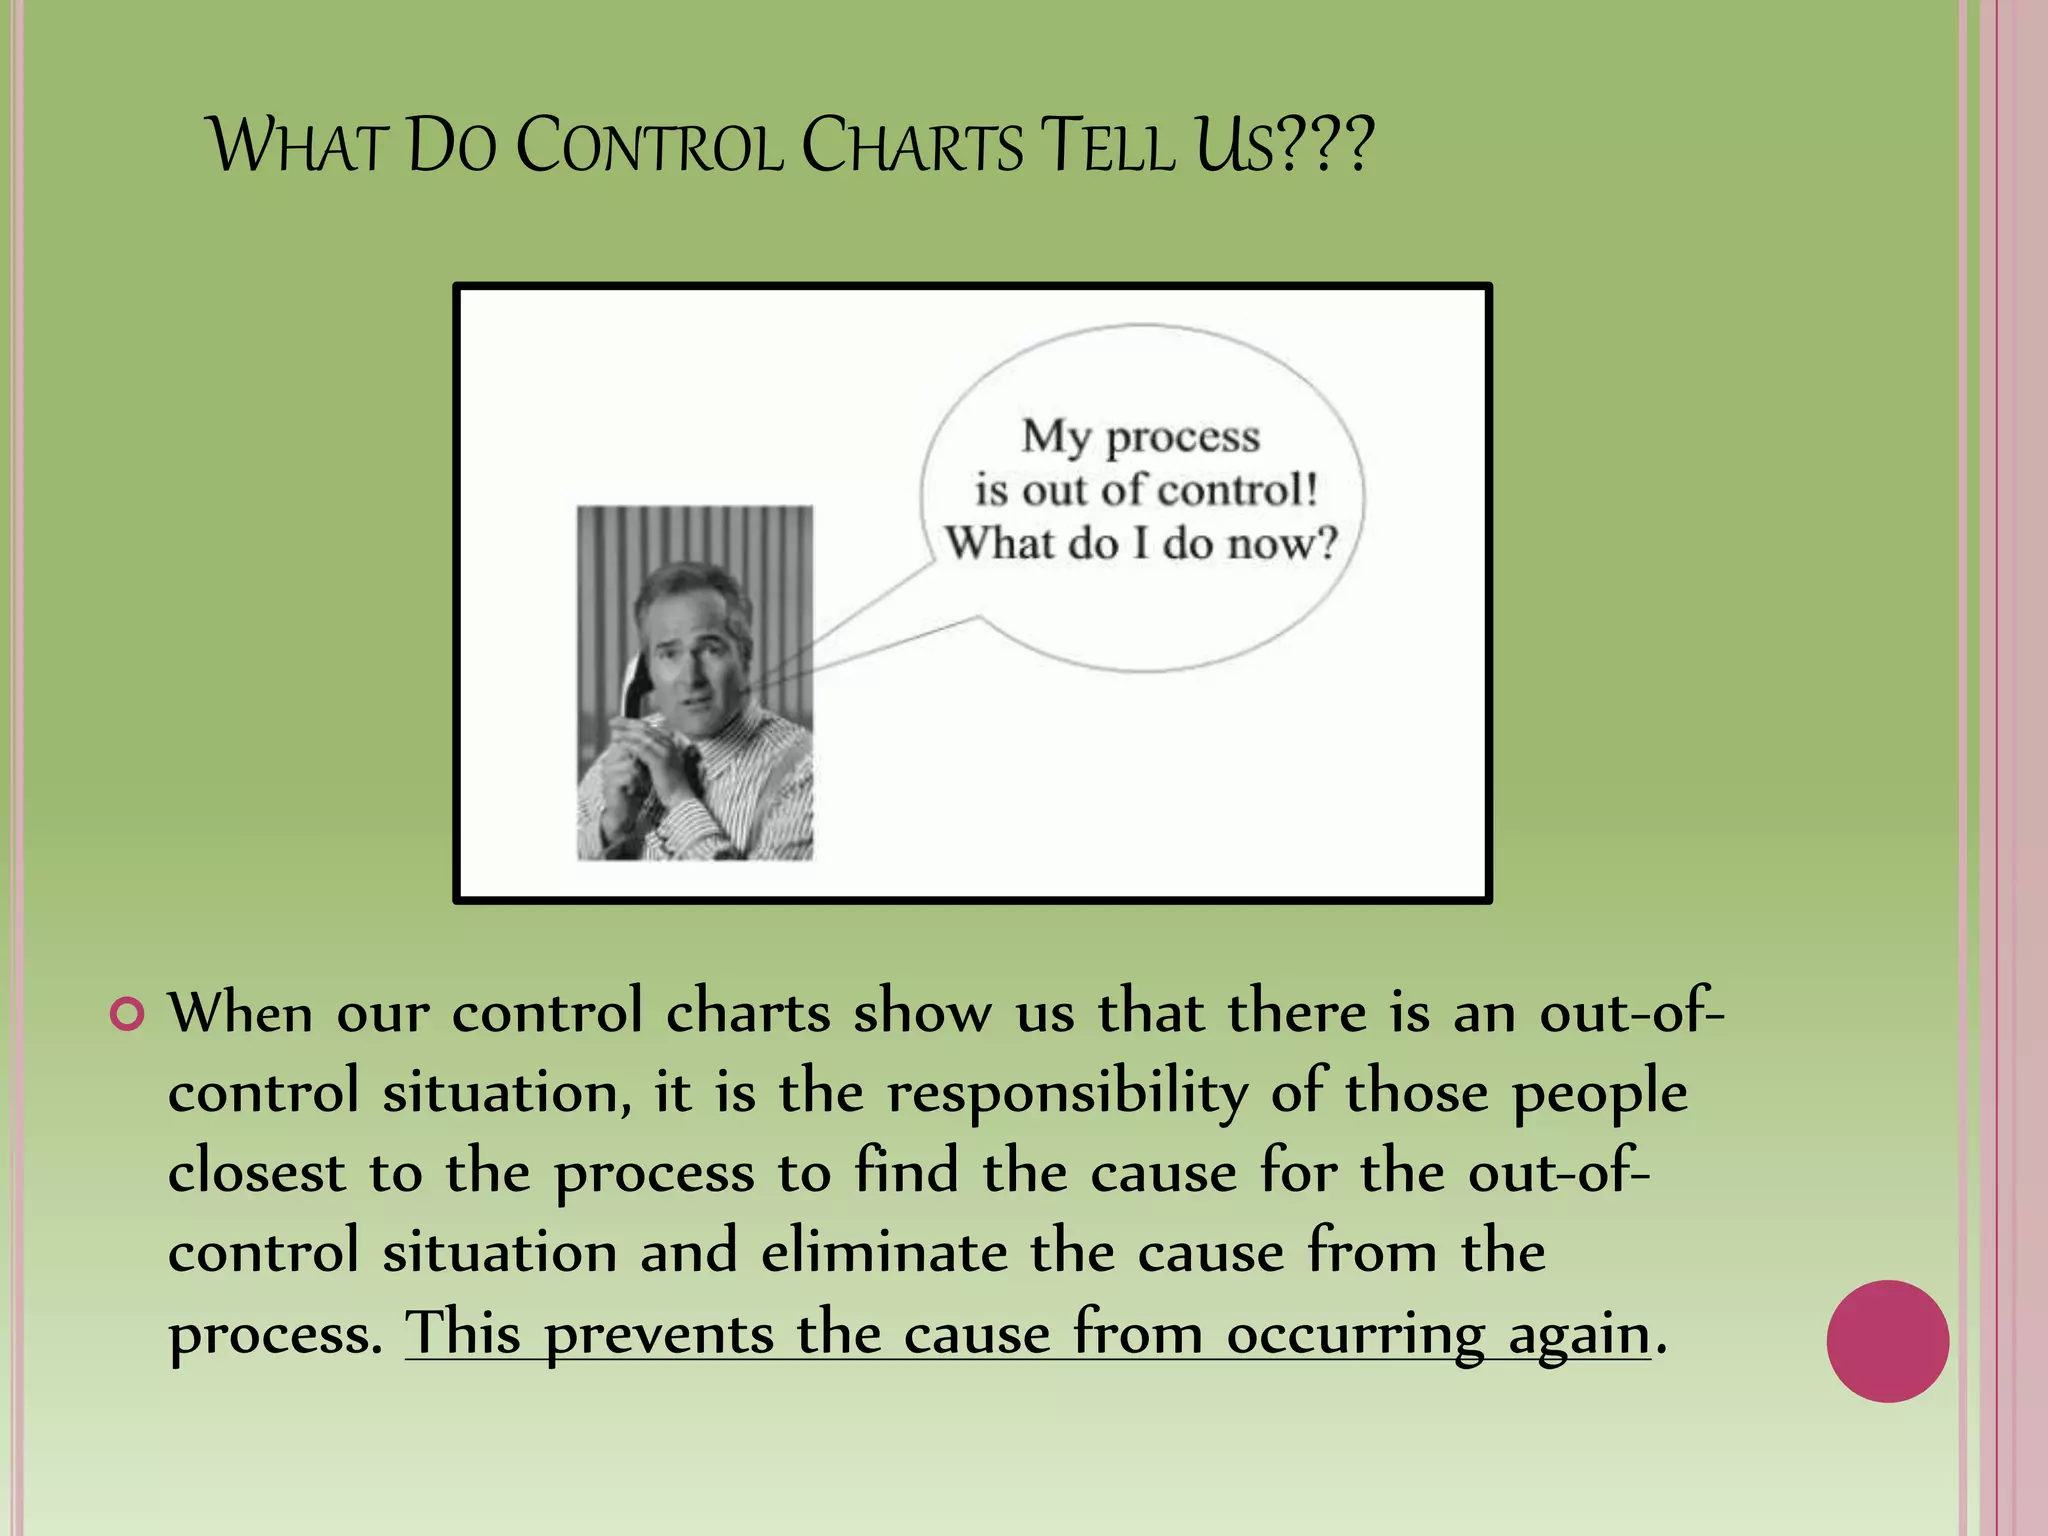
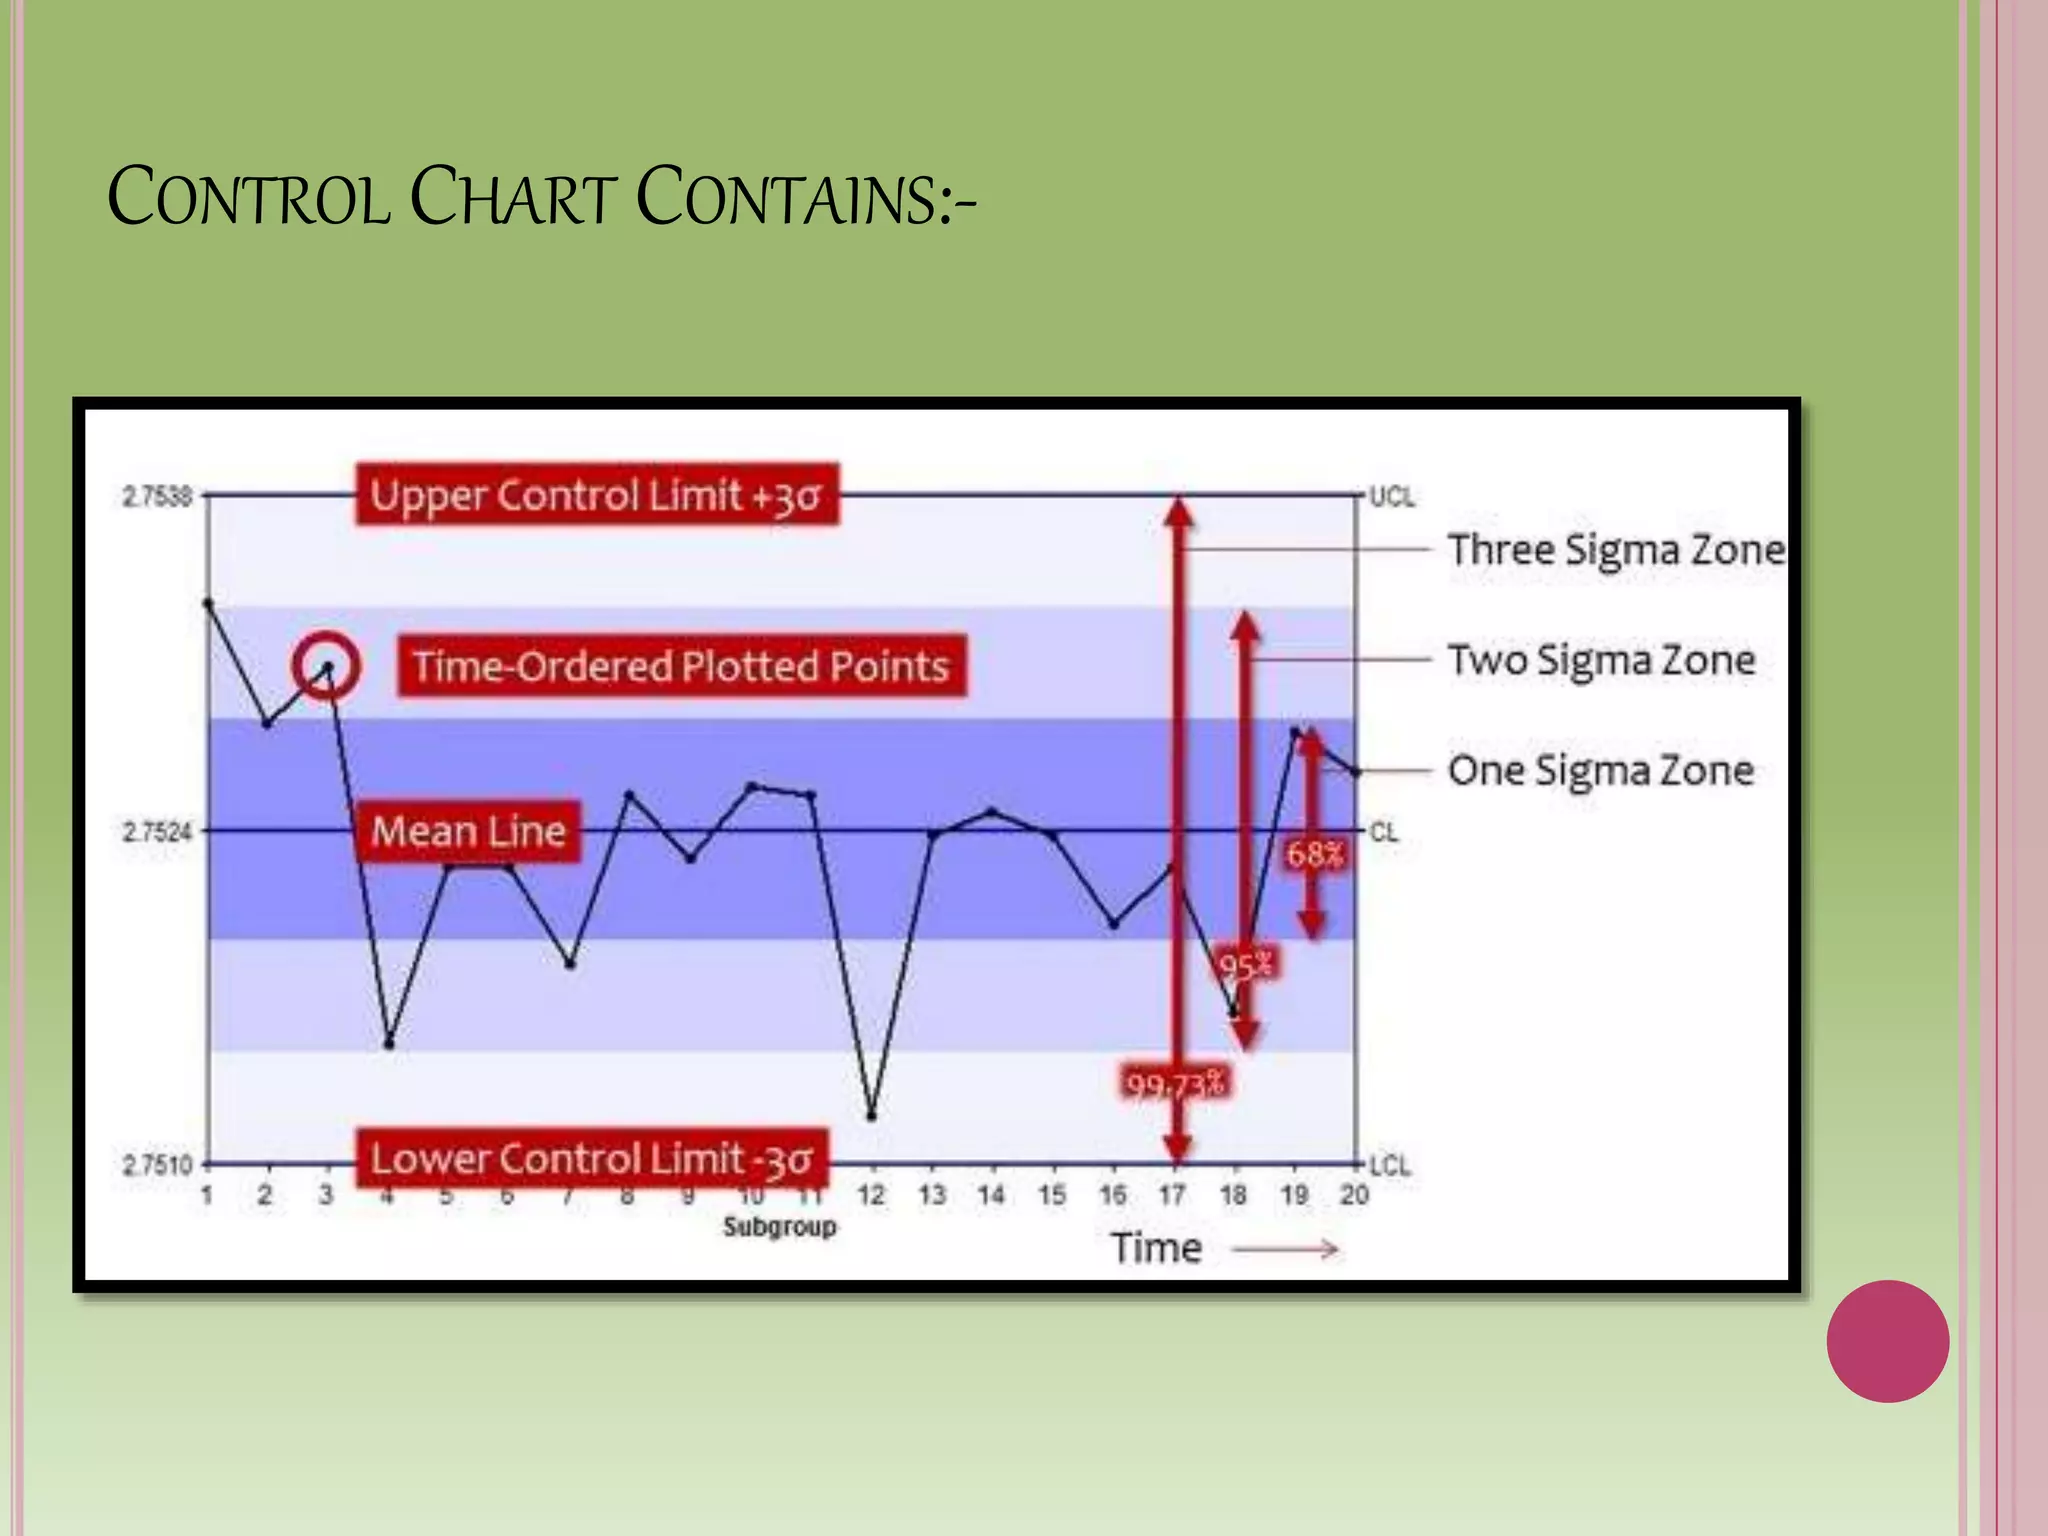
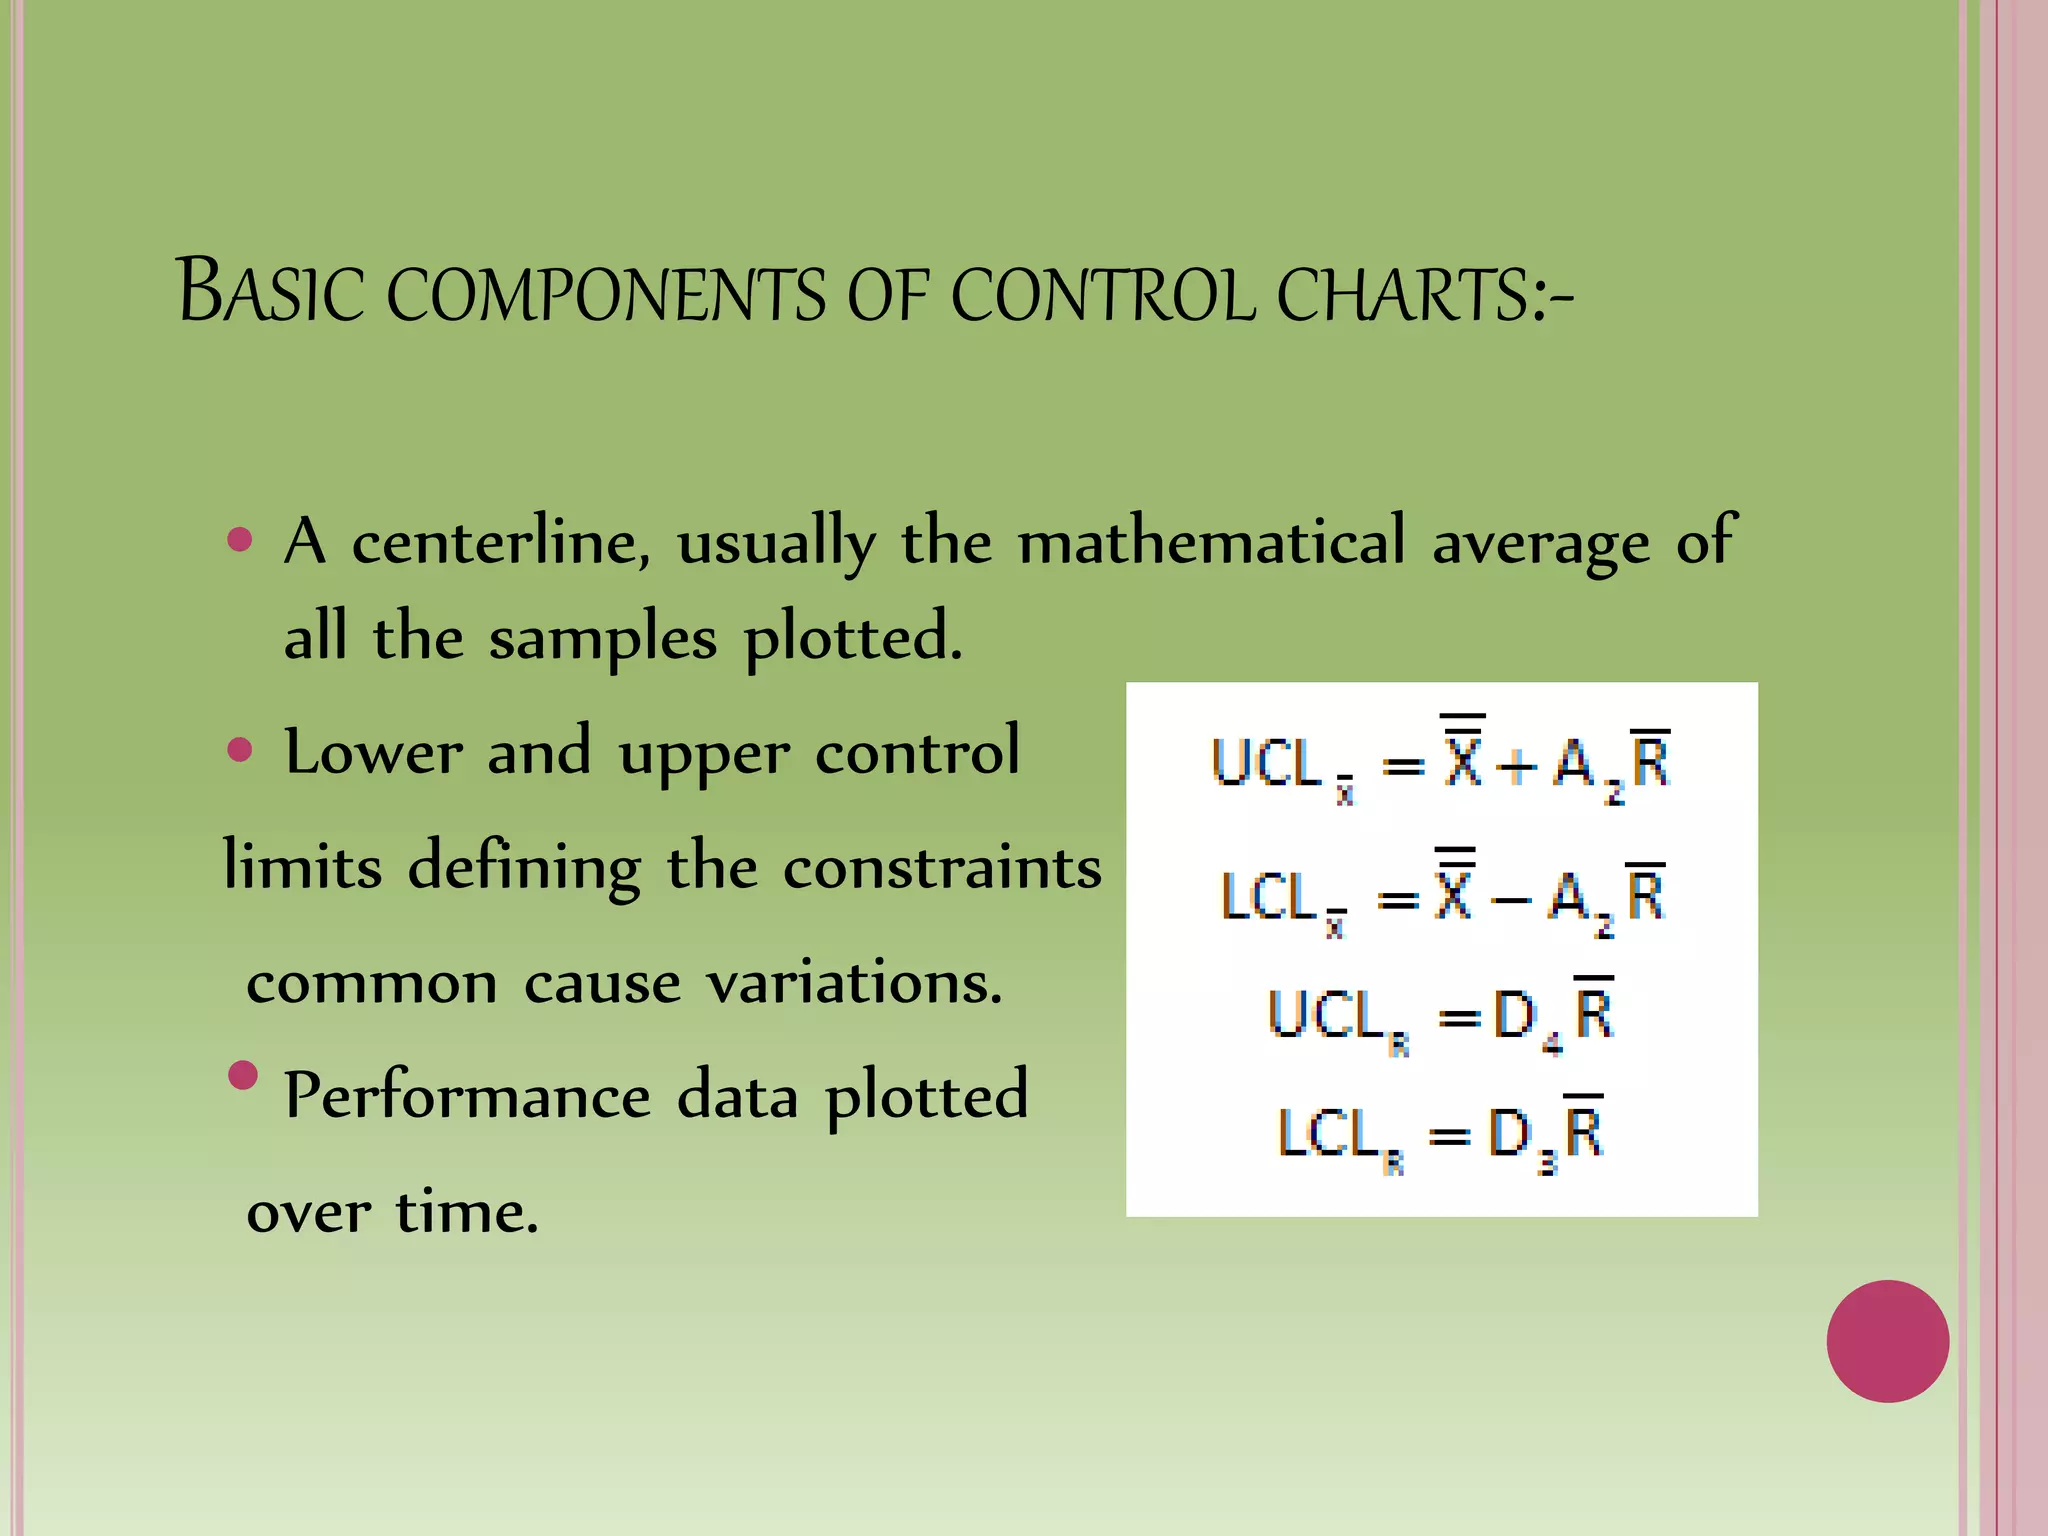
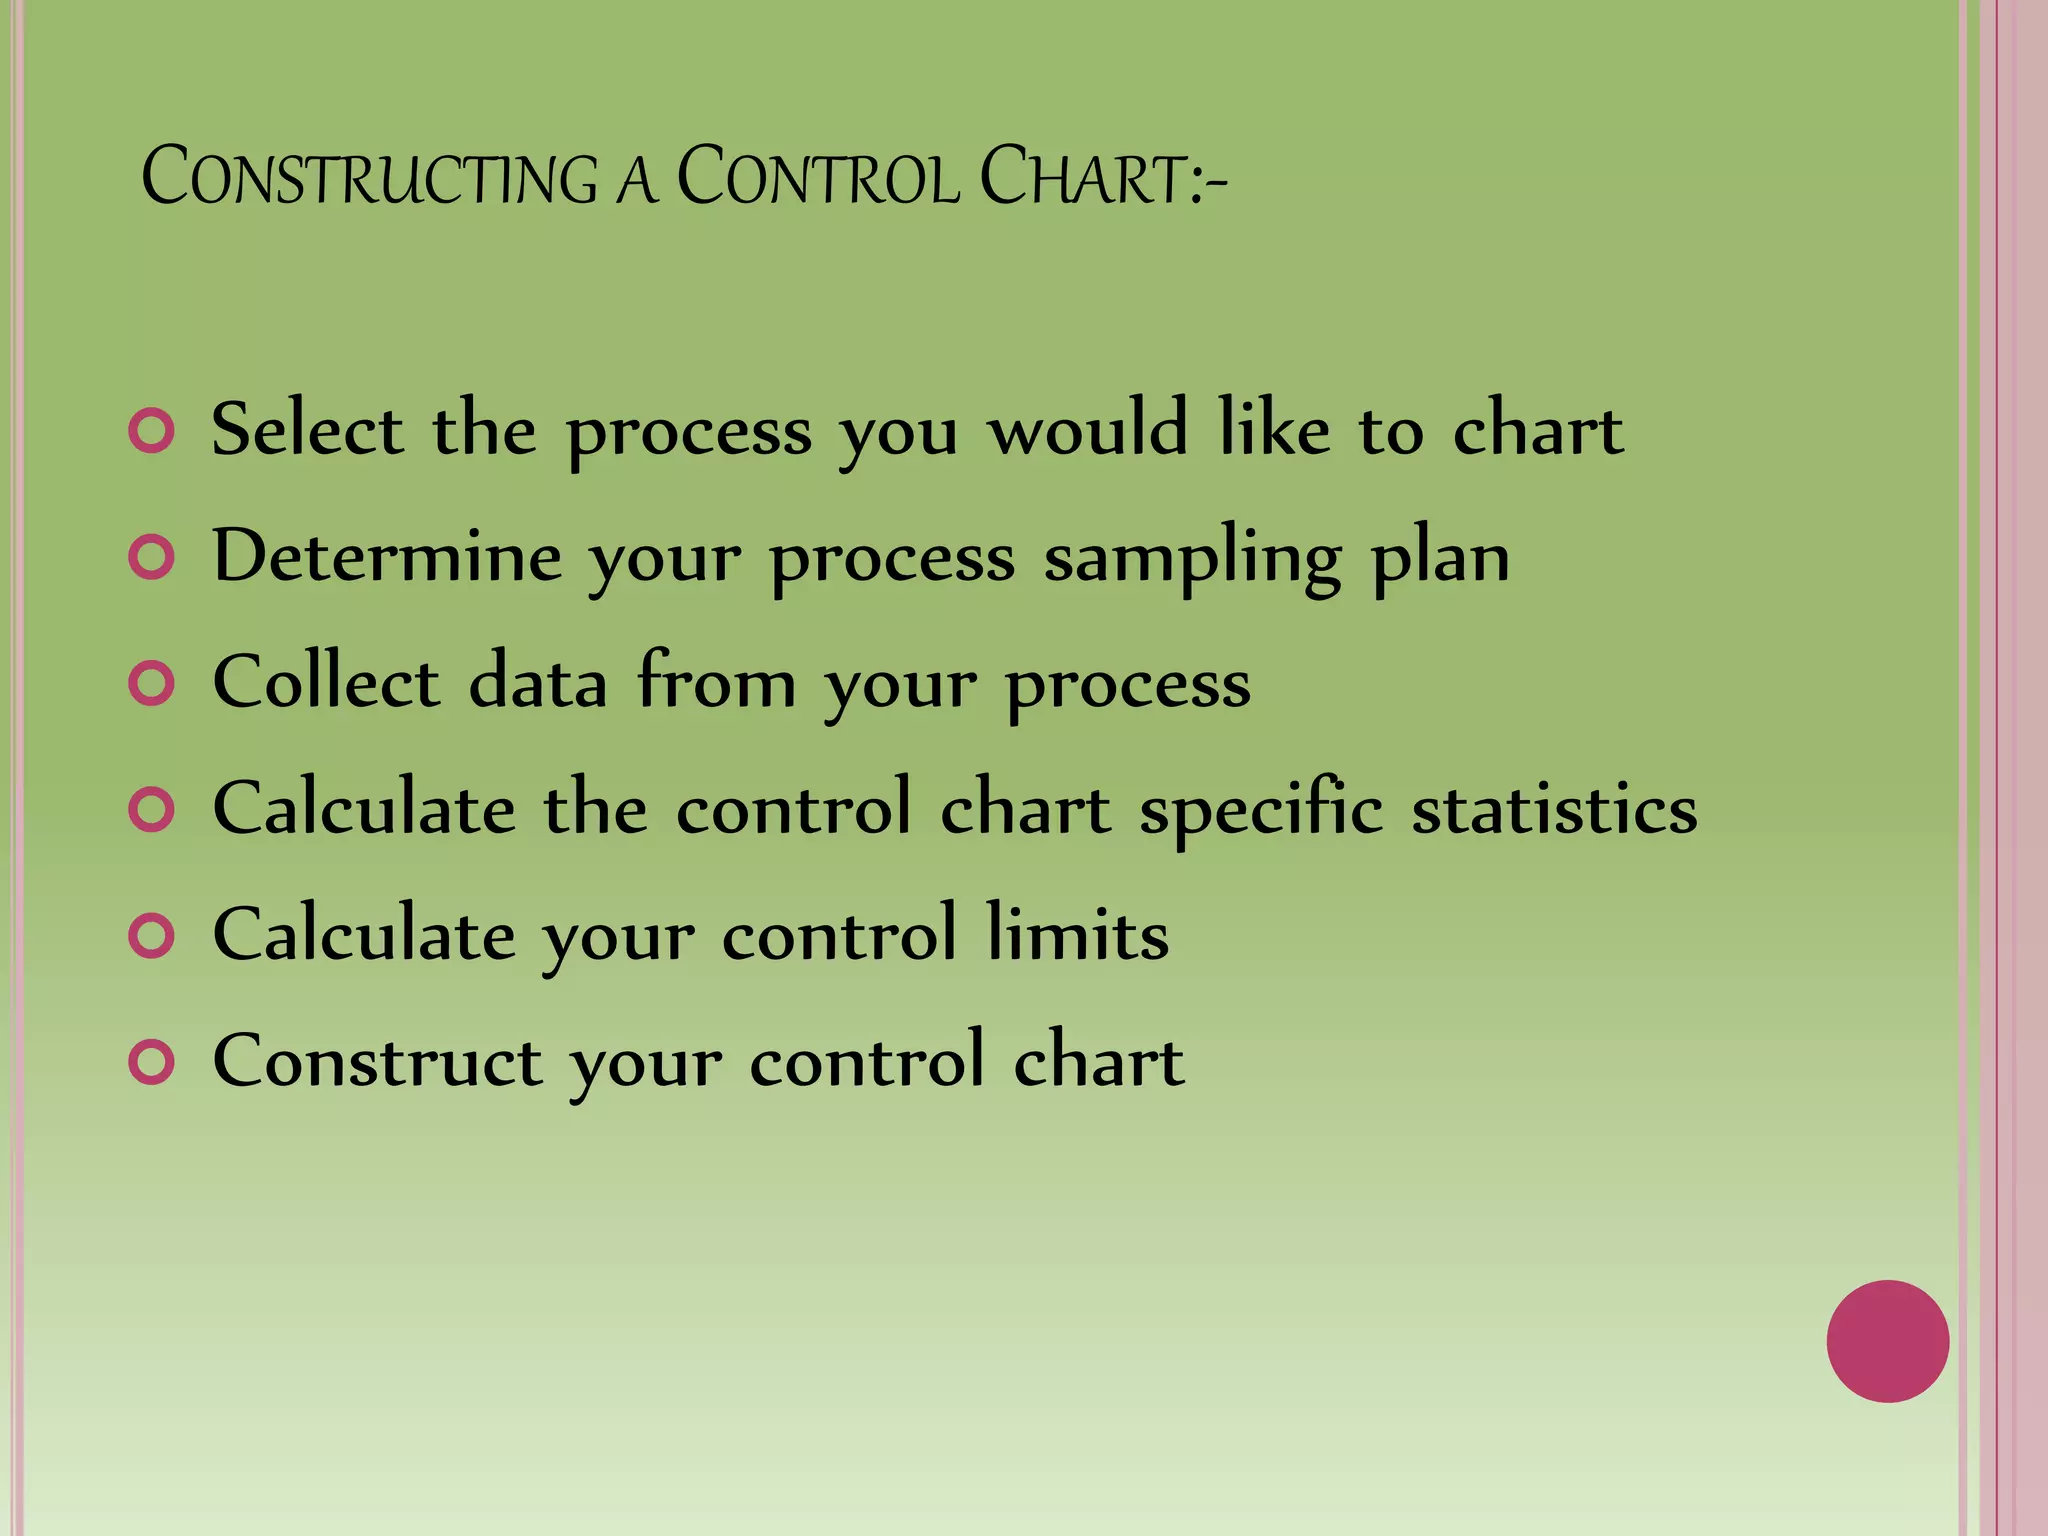
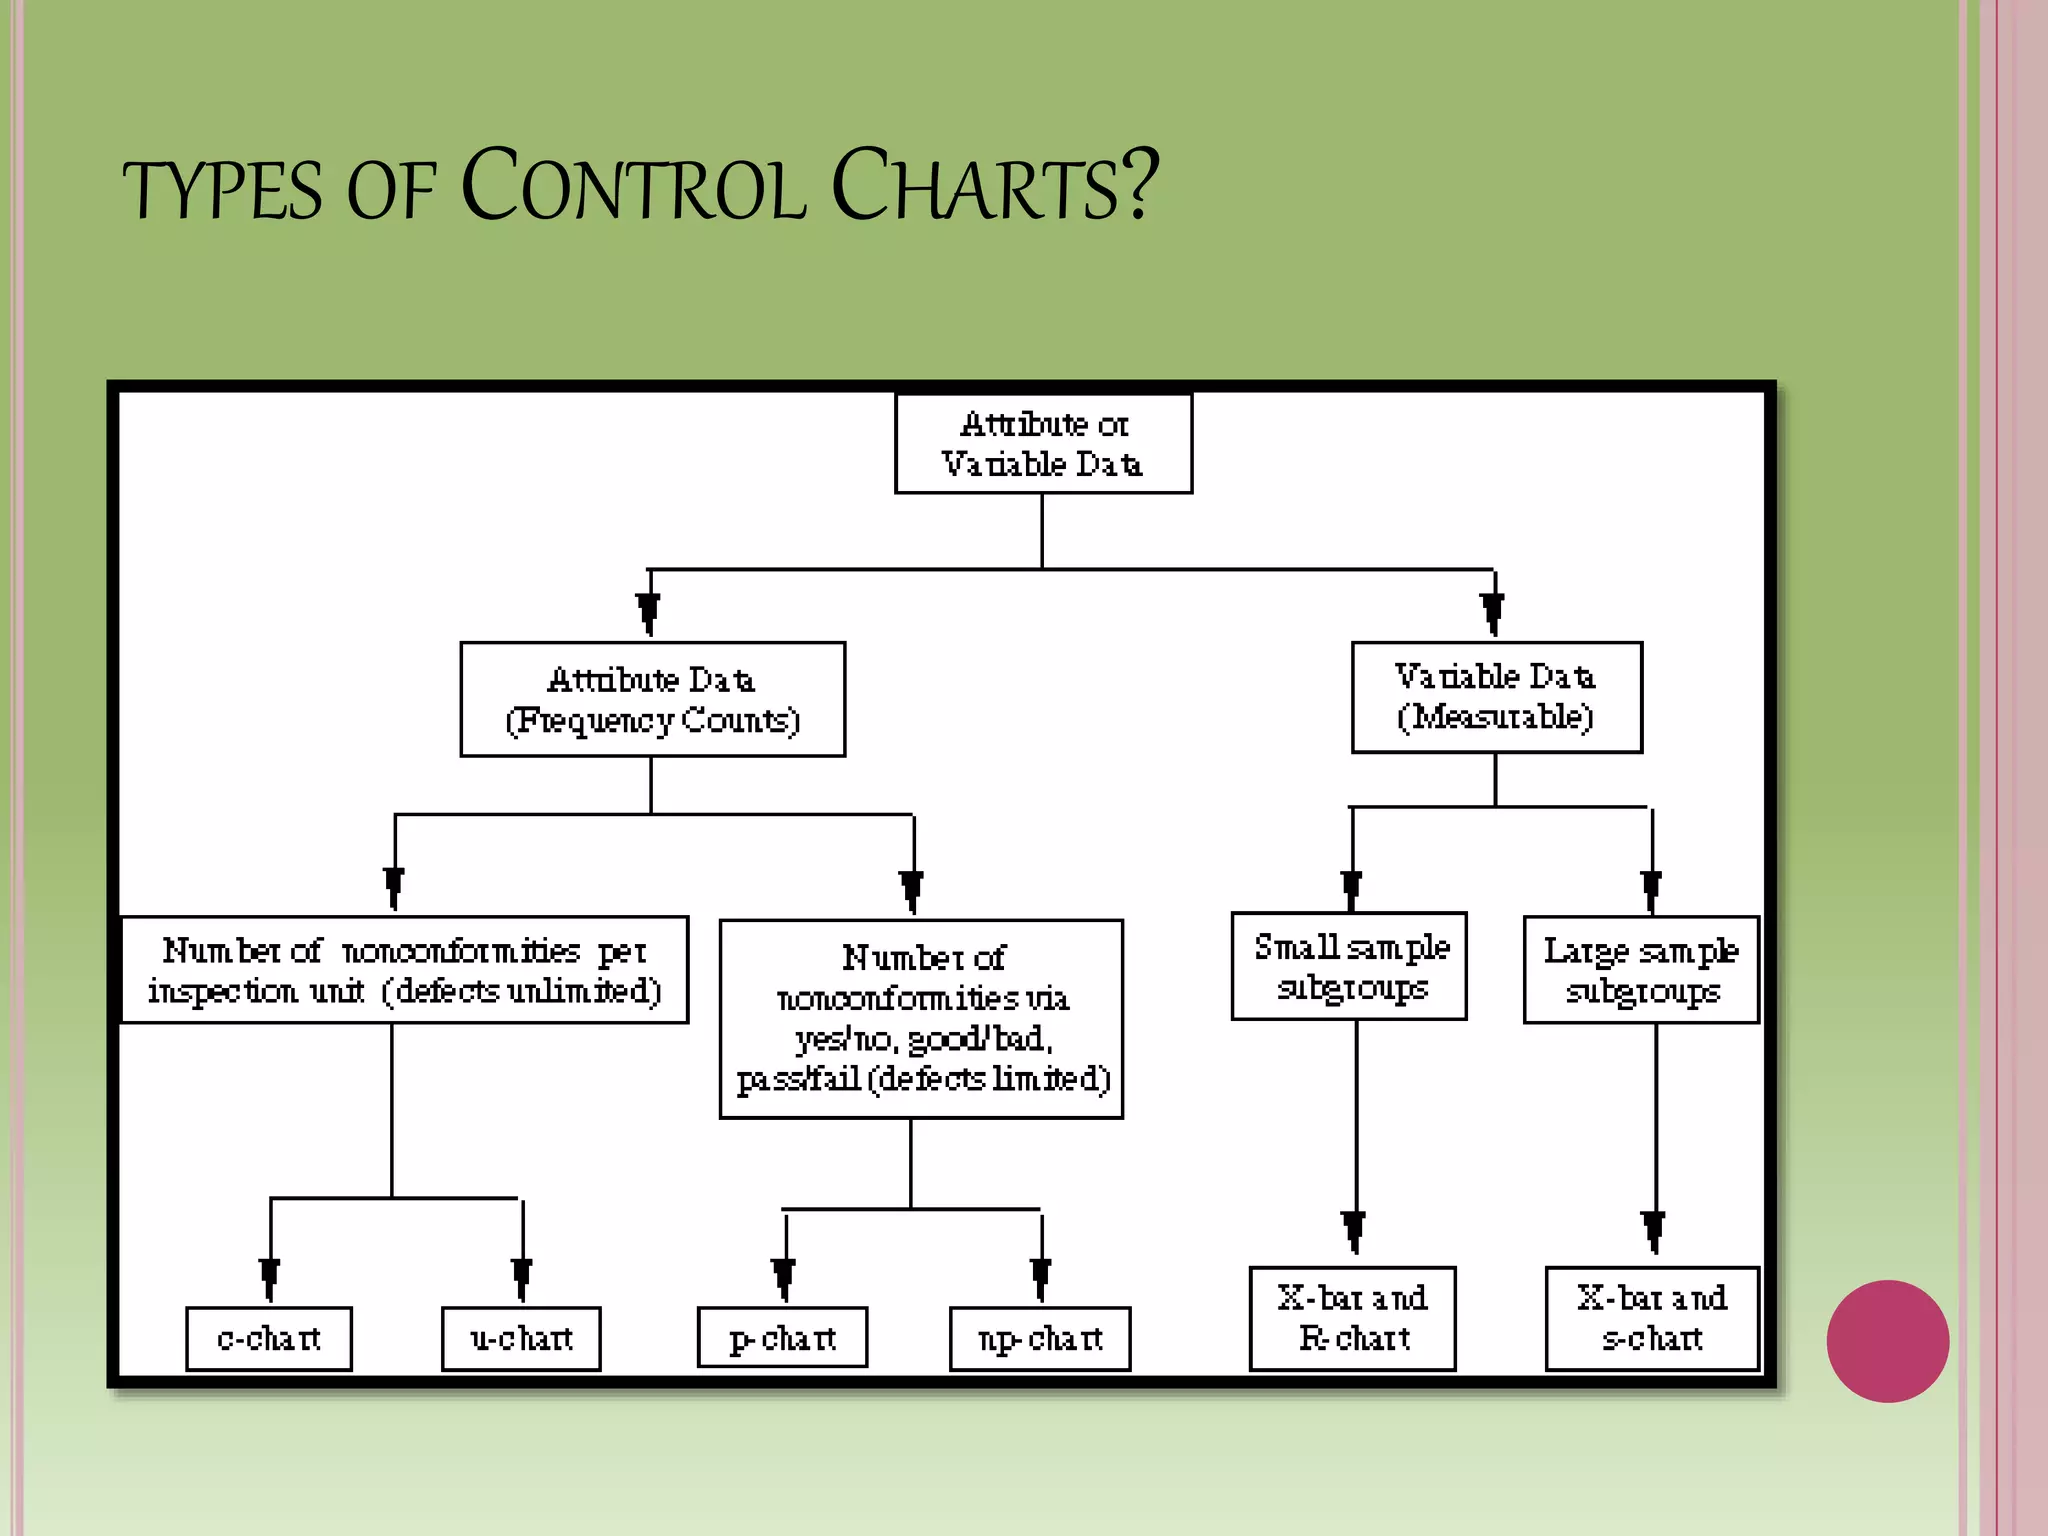
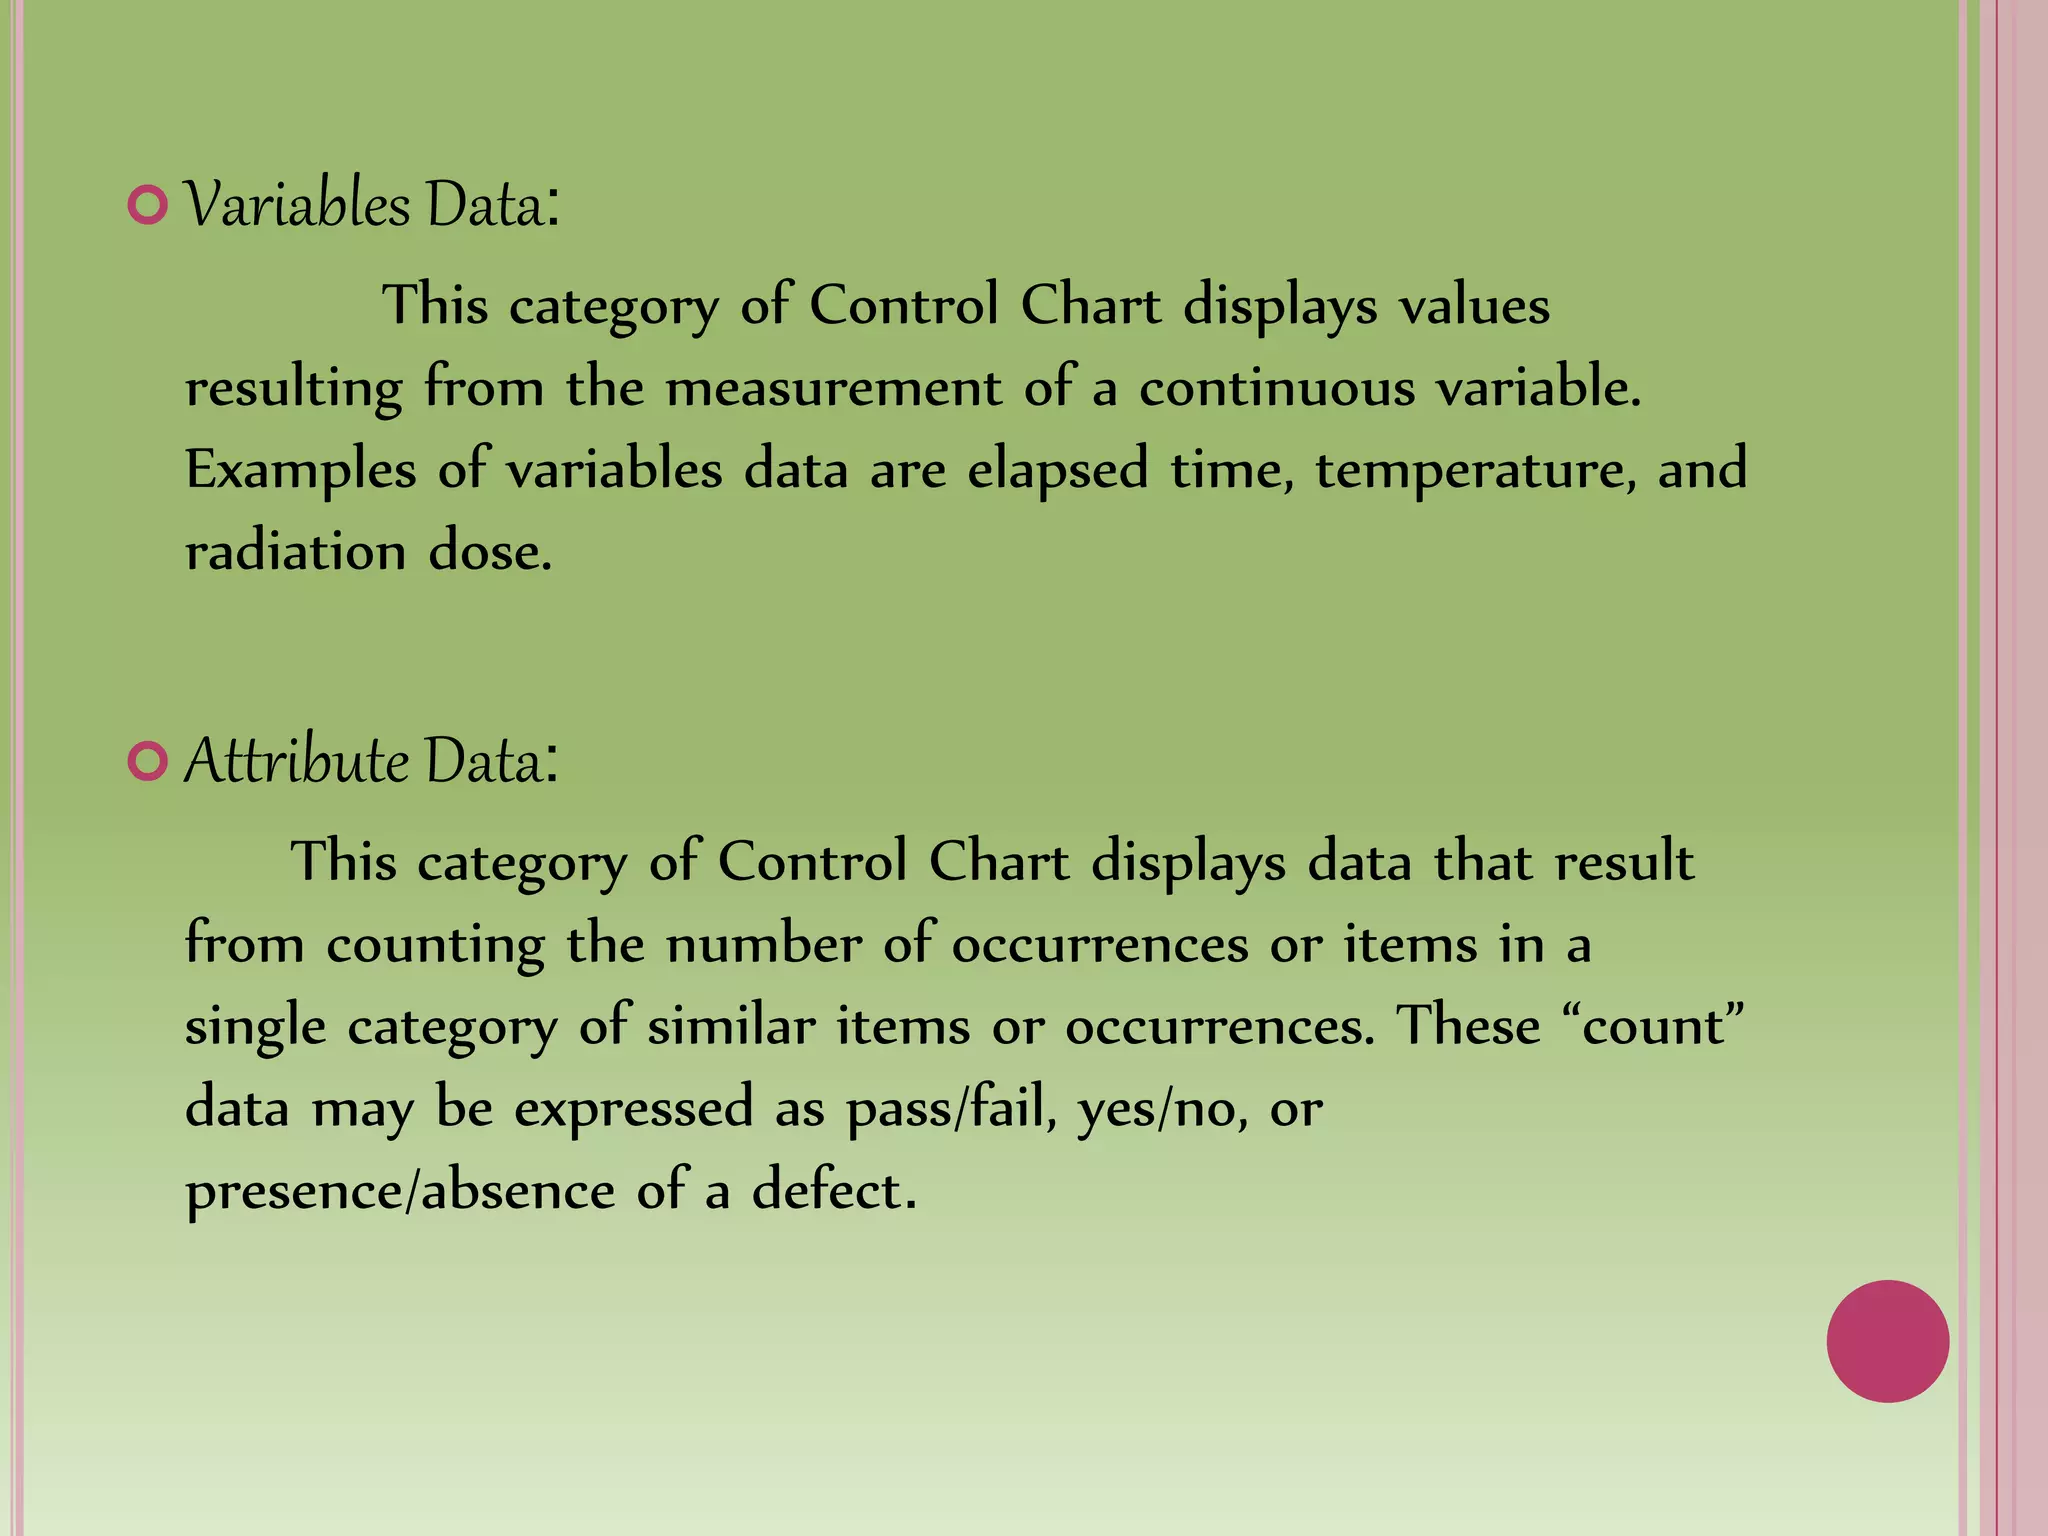
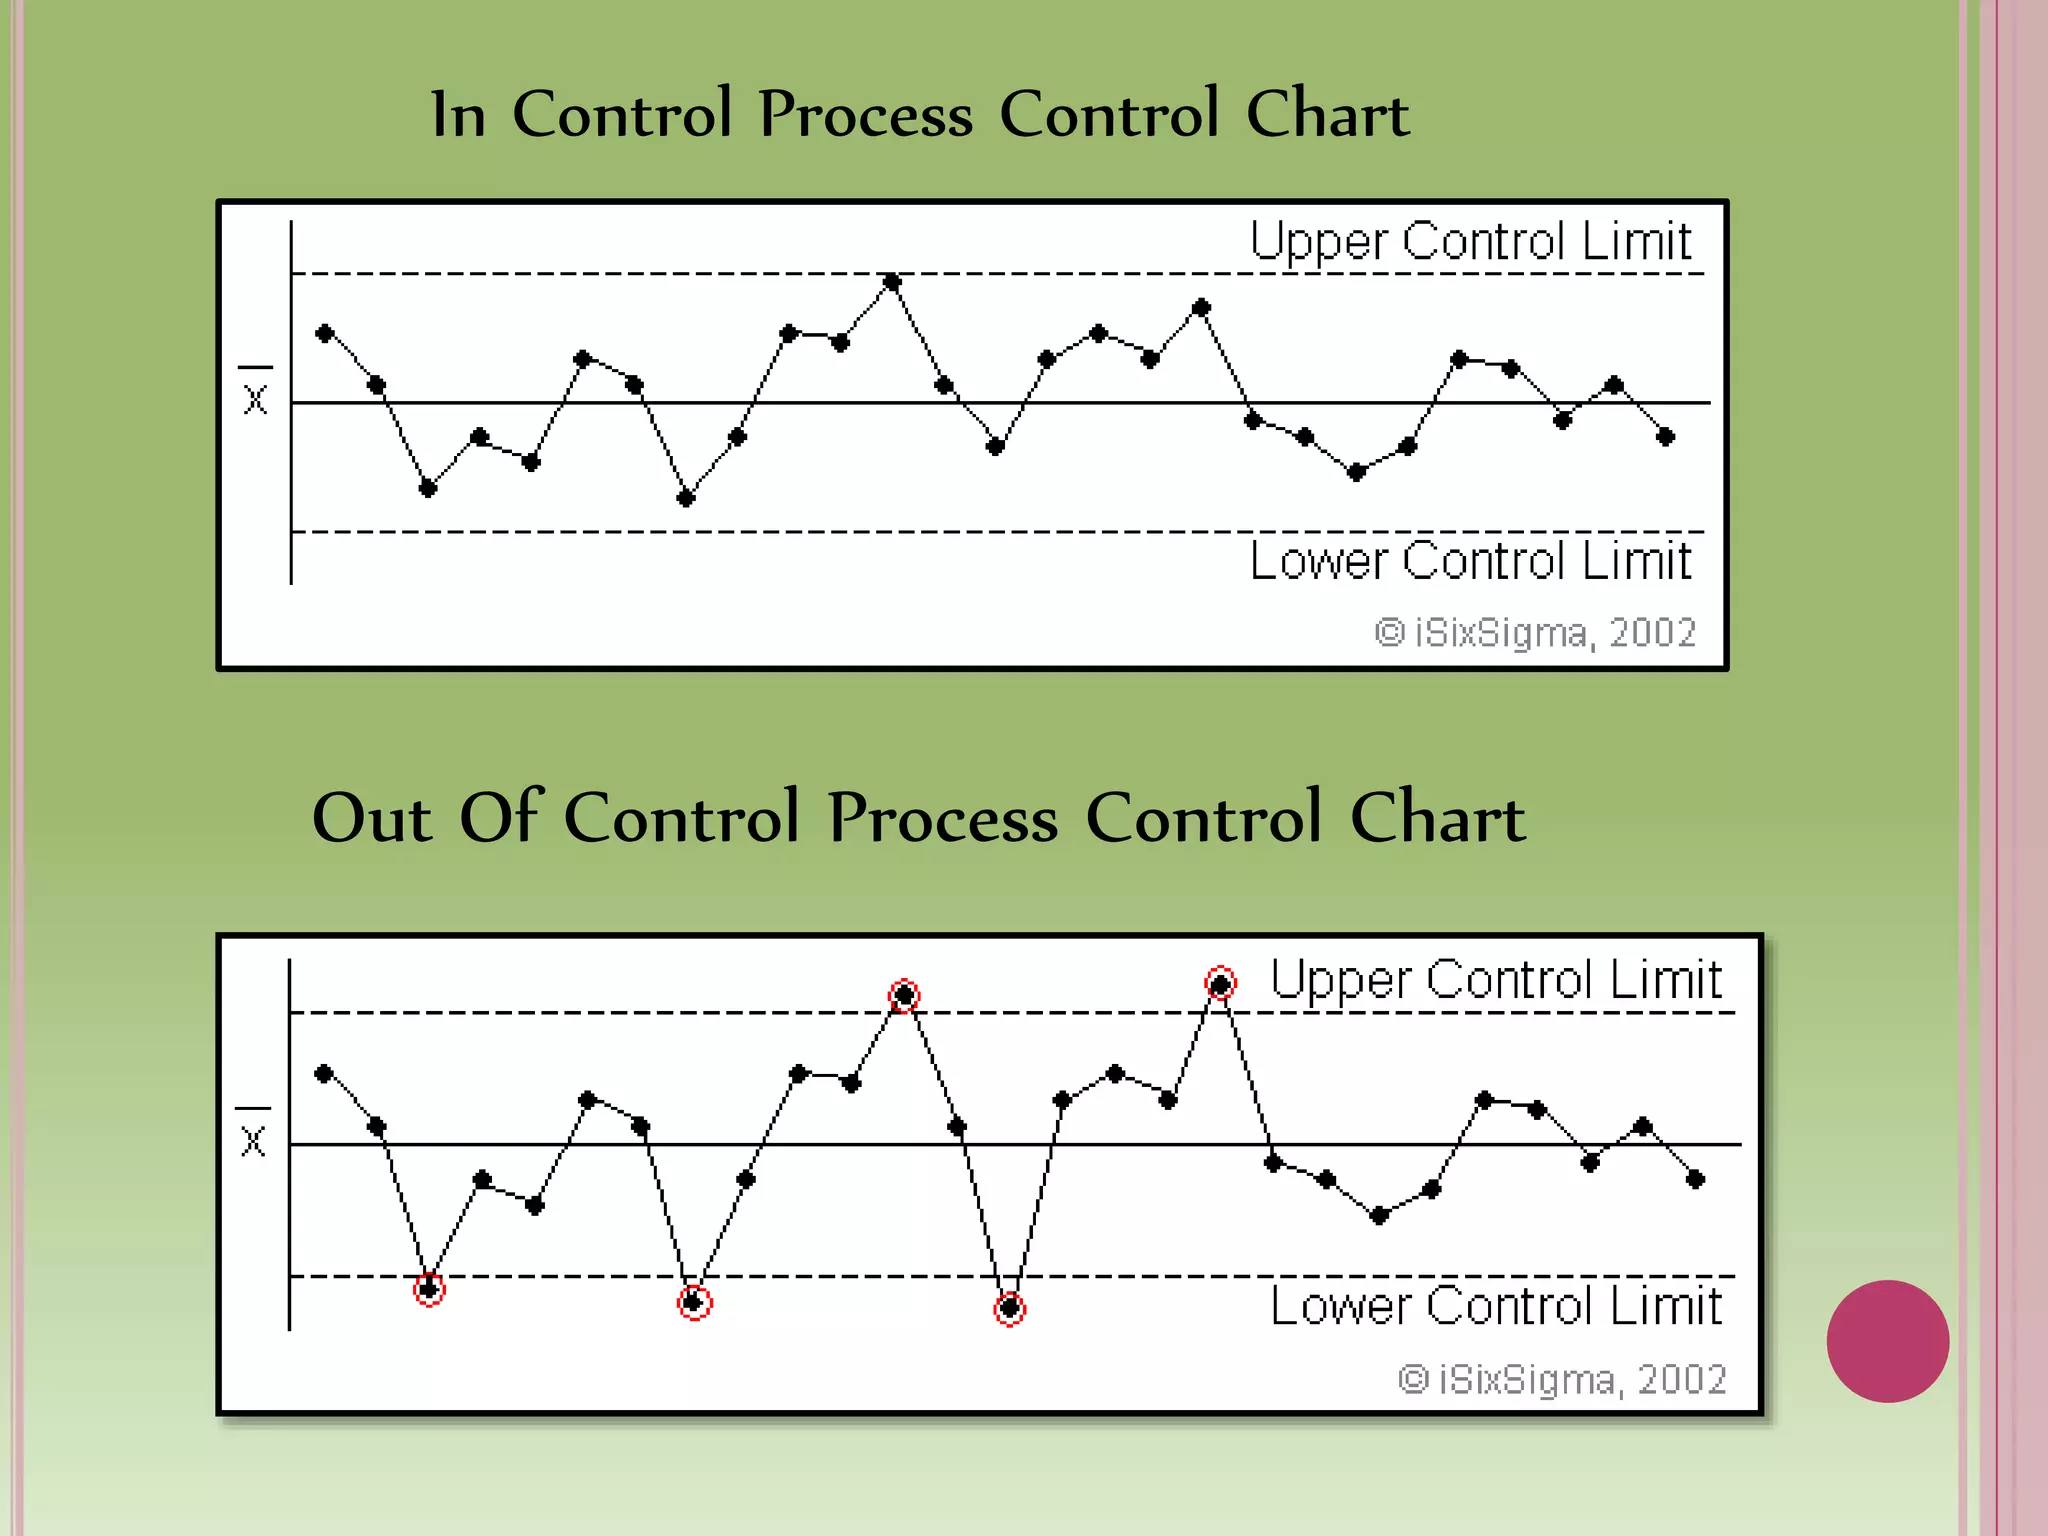
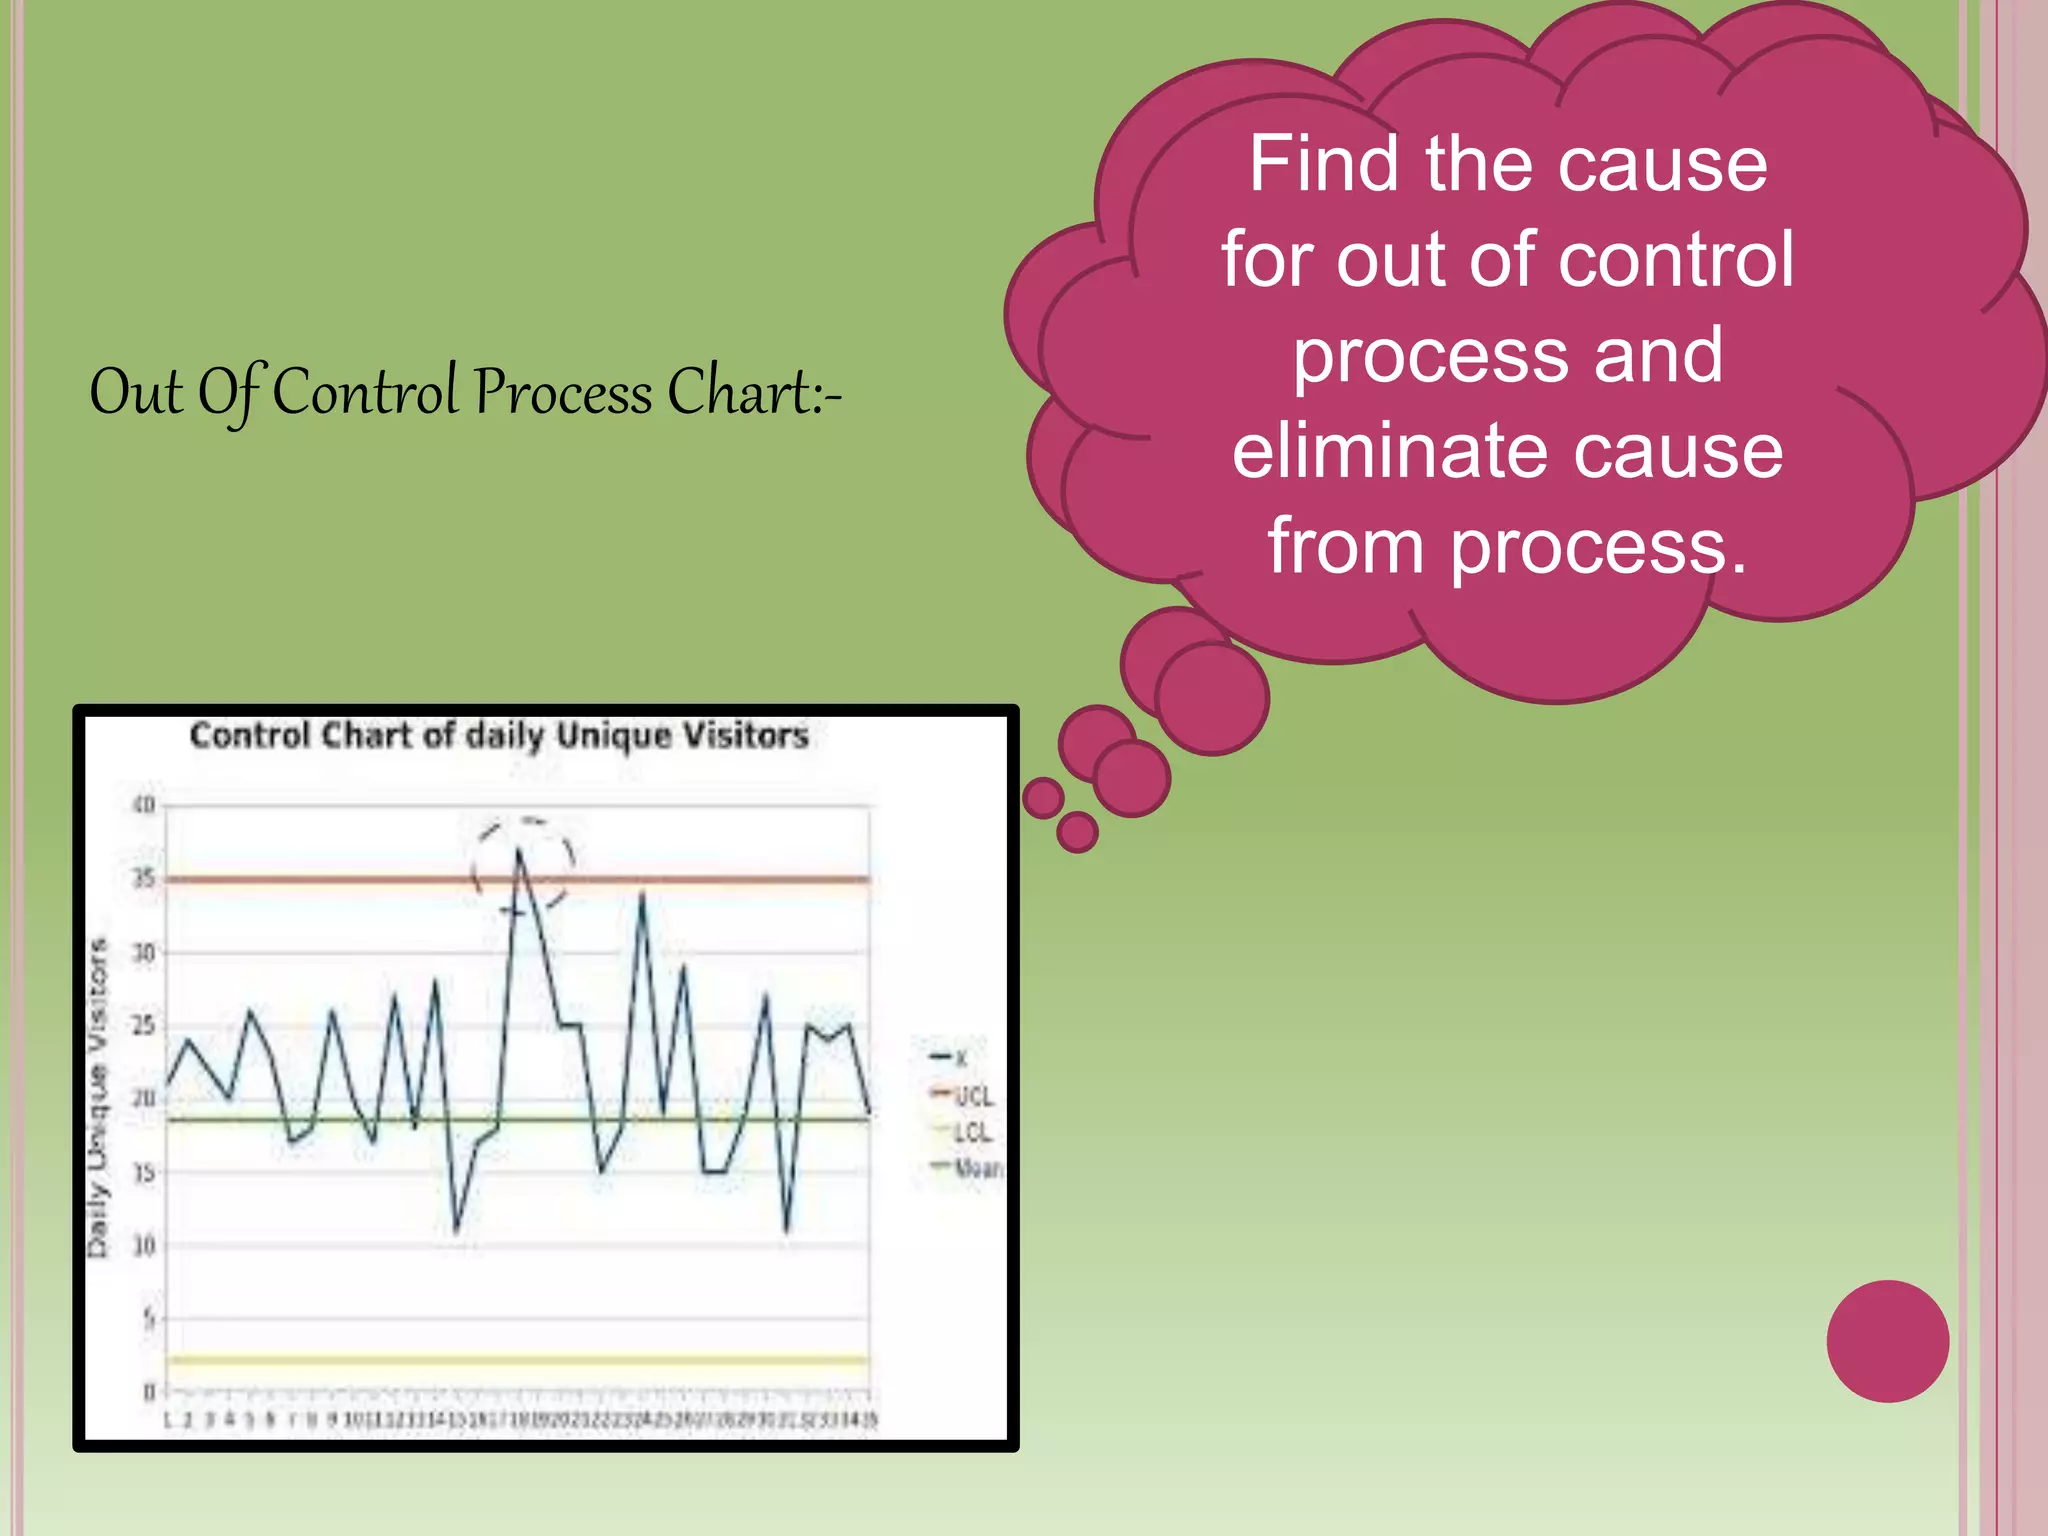
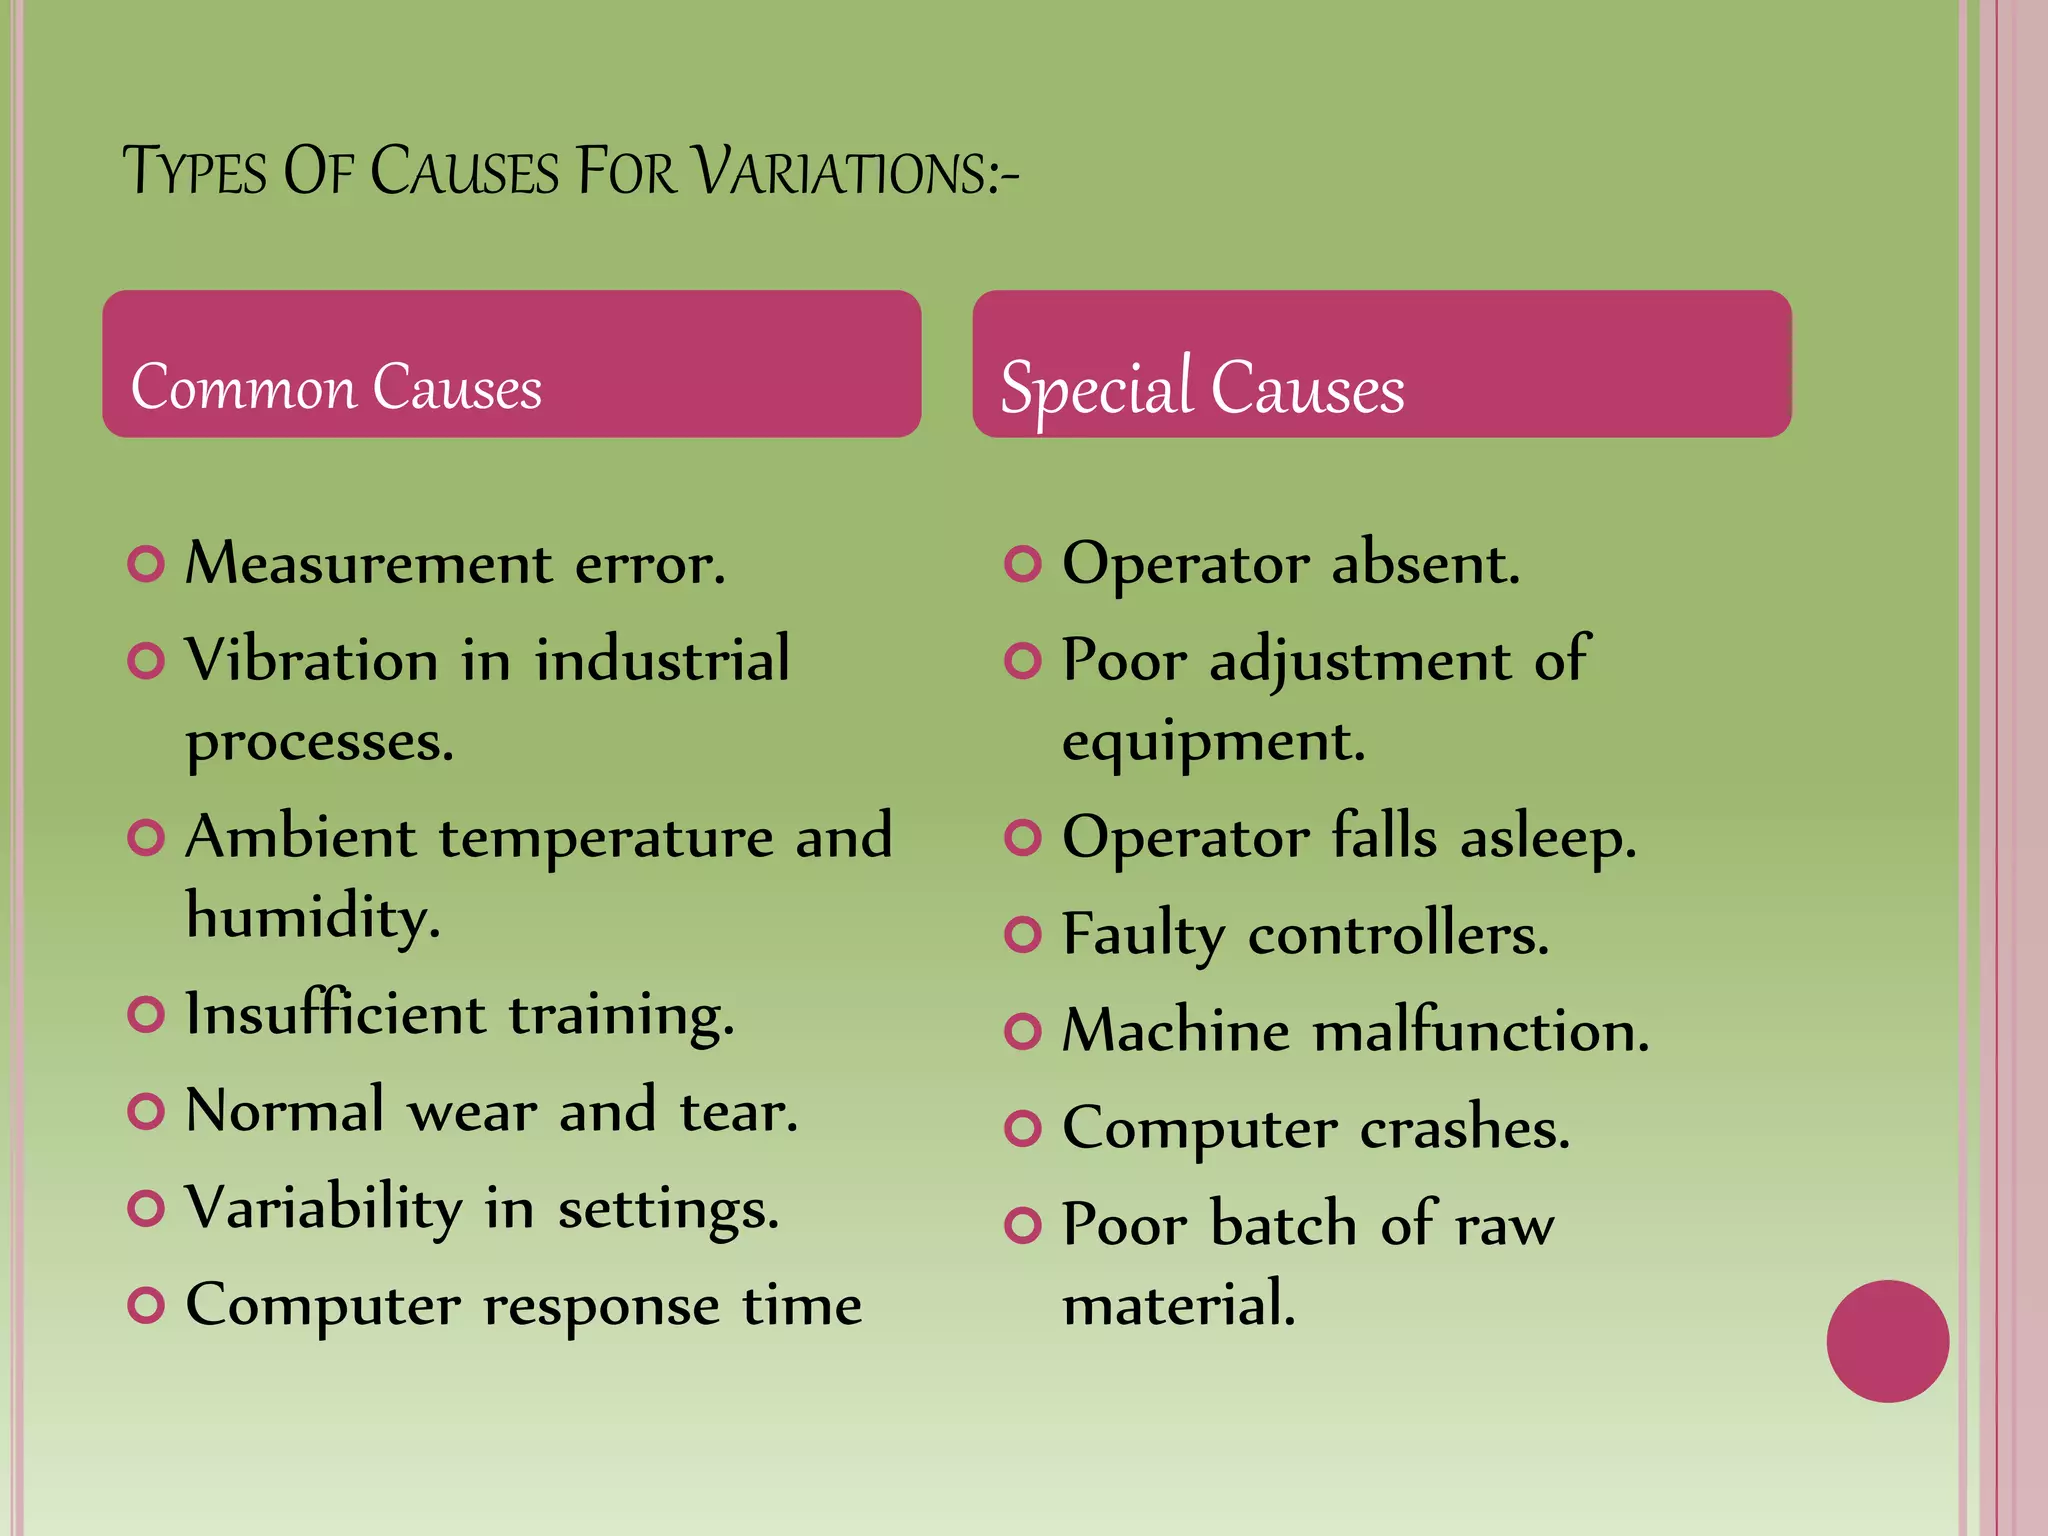


Control charts are used to monitor process variables over time in various industries and organizations. They tell us when a process is out of control by showing data points outside the control limits. When this occurs, those closest to the process must find and eliminate the special cause of variation to prevent it from happening again. Control charts have basic components like a centerline and upper and lower control limits. They are constructed by selecting a process, collecting data, calculating statistics and control limits, and plotting the results over time. Control charts come in two types - variables charts for continuous measurements and attributes charts for counting items. Common and special causes can lead to variations monitored by these charts.


![Control Charts[1]](https://cdn.slidesharecdn.com/ss_thumbnails/controlcharts1-1226081330857138-9-thumbnail.jpg?width=640&height=640&fit=bounds)


![Control Charts[1]](https://cdn.slidesharecdn.com/ss_thumbnails/controlcharts1-1226961283054520-8-thumbnail.jpg?width=640&height=640&fit=bounds)


![Control charts[1]](https://cdn.slidesharecdn.com/ss_thumbnails/controlcharts1-100924110931-phpapp01-thumbnail.jpg?width=640&height=640&fit=bounds)


![[DSC Europe 25] Boris Perkovic - Lost in performance.pptx](https://cdn.slidesharecdn.com/ss_thumbnails/uq5hrp7vsuahqkxzifux-1-251204082258-fd2ee09d-thumbnail.jpg?width=640&height=640&fit=bounds)


![[DSC Europe 25] Dusan Jovicic - AI Story: From on-prem to cloud and back agai...](https://cdn.slidesharecdn.com/ss_thumbnails/8kp49m6uq22ifnbwhfnk-2-251205085715-964d11a6-thumbnail.jpg?width=640&height=640&fit=bounds)


![[DSC Europe 25] Dragana Ilic - AI for Big Data in Astronomy.pptx](https://cdn.slidesharecdn.com/ss_thumbnails/8palya86qaatvjhva1ms-2-dragana-ilic-ai-ilic-251208151906-652b819c-thumbnail.jpg?width=640&height=640&fit=bounds)