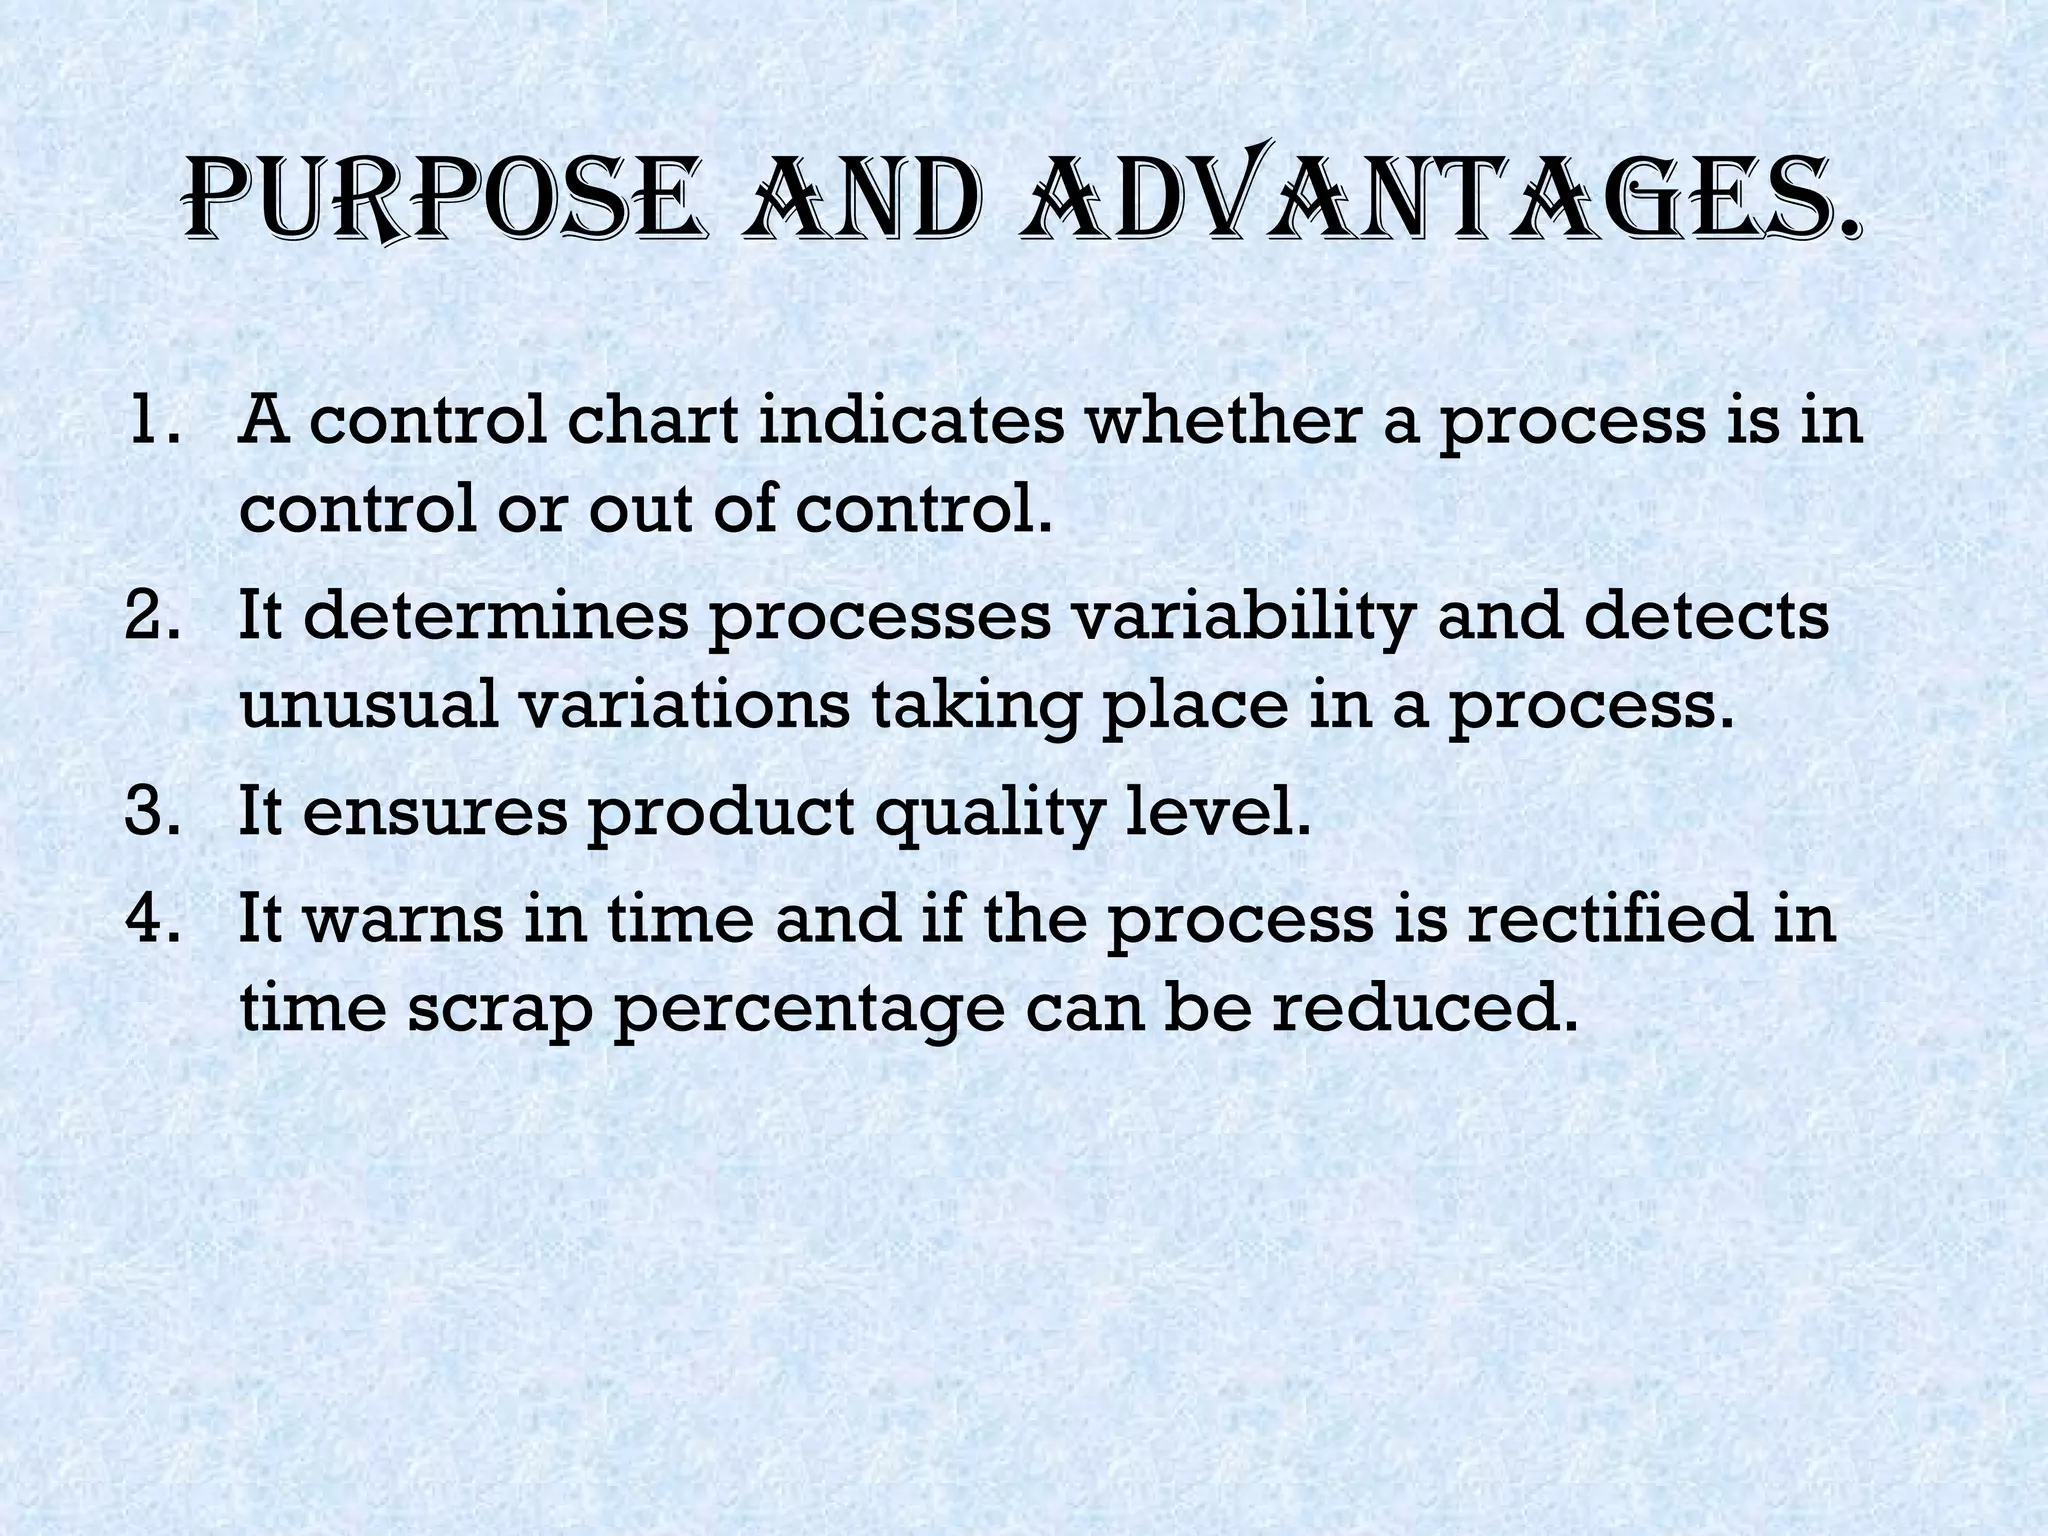
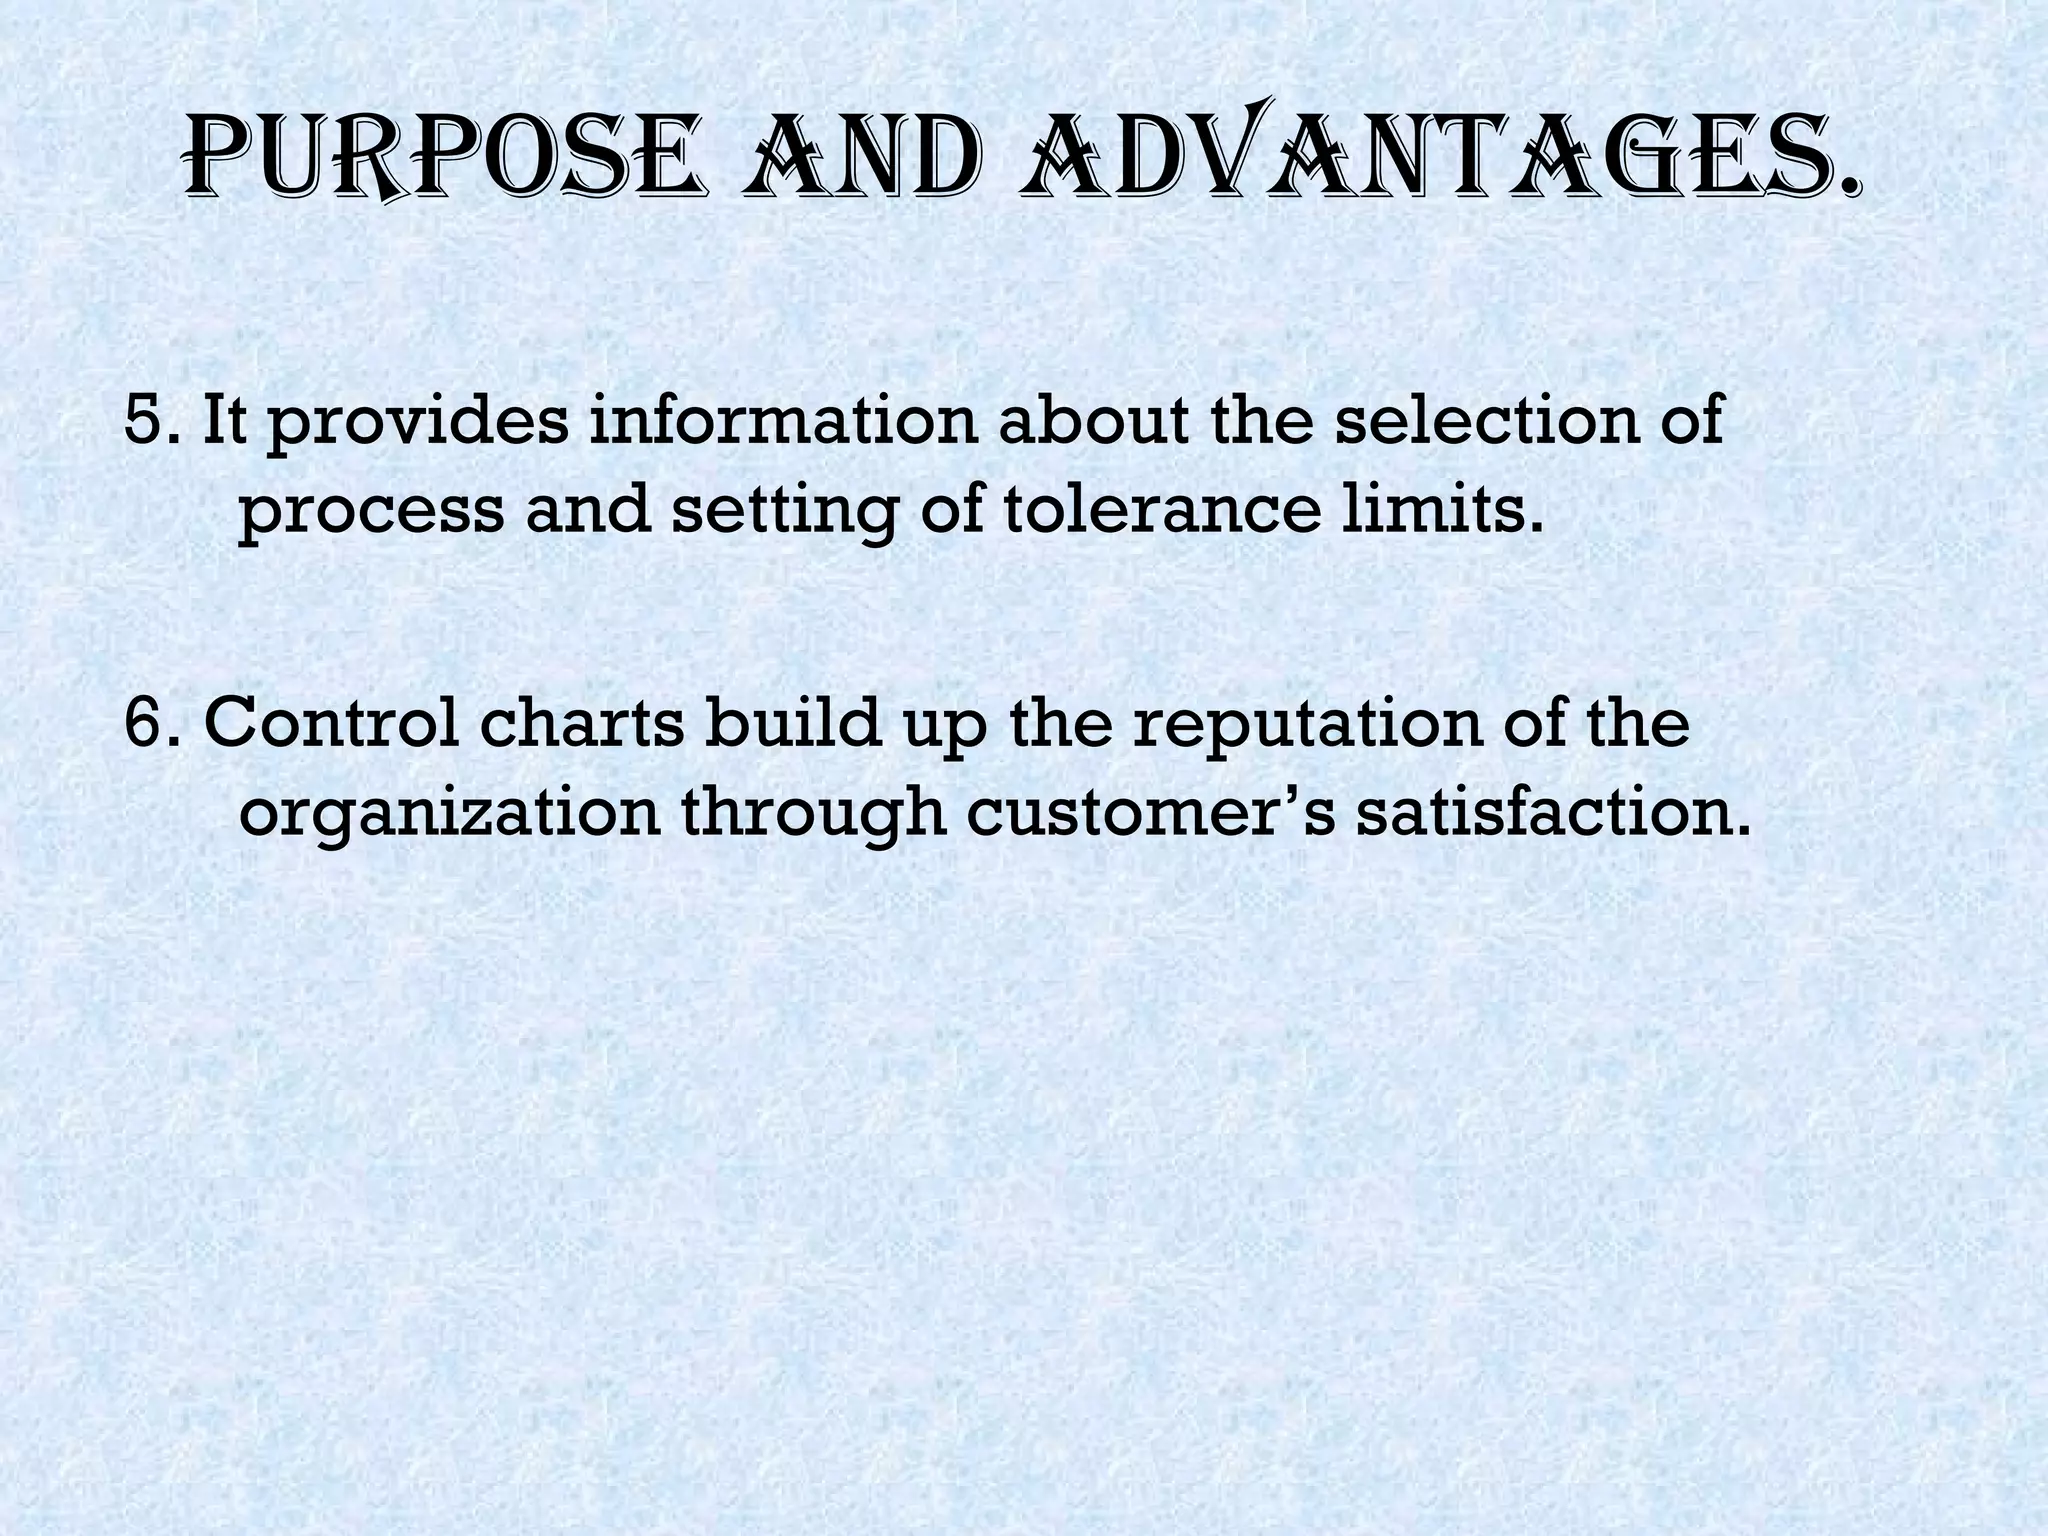
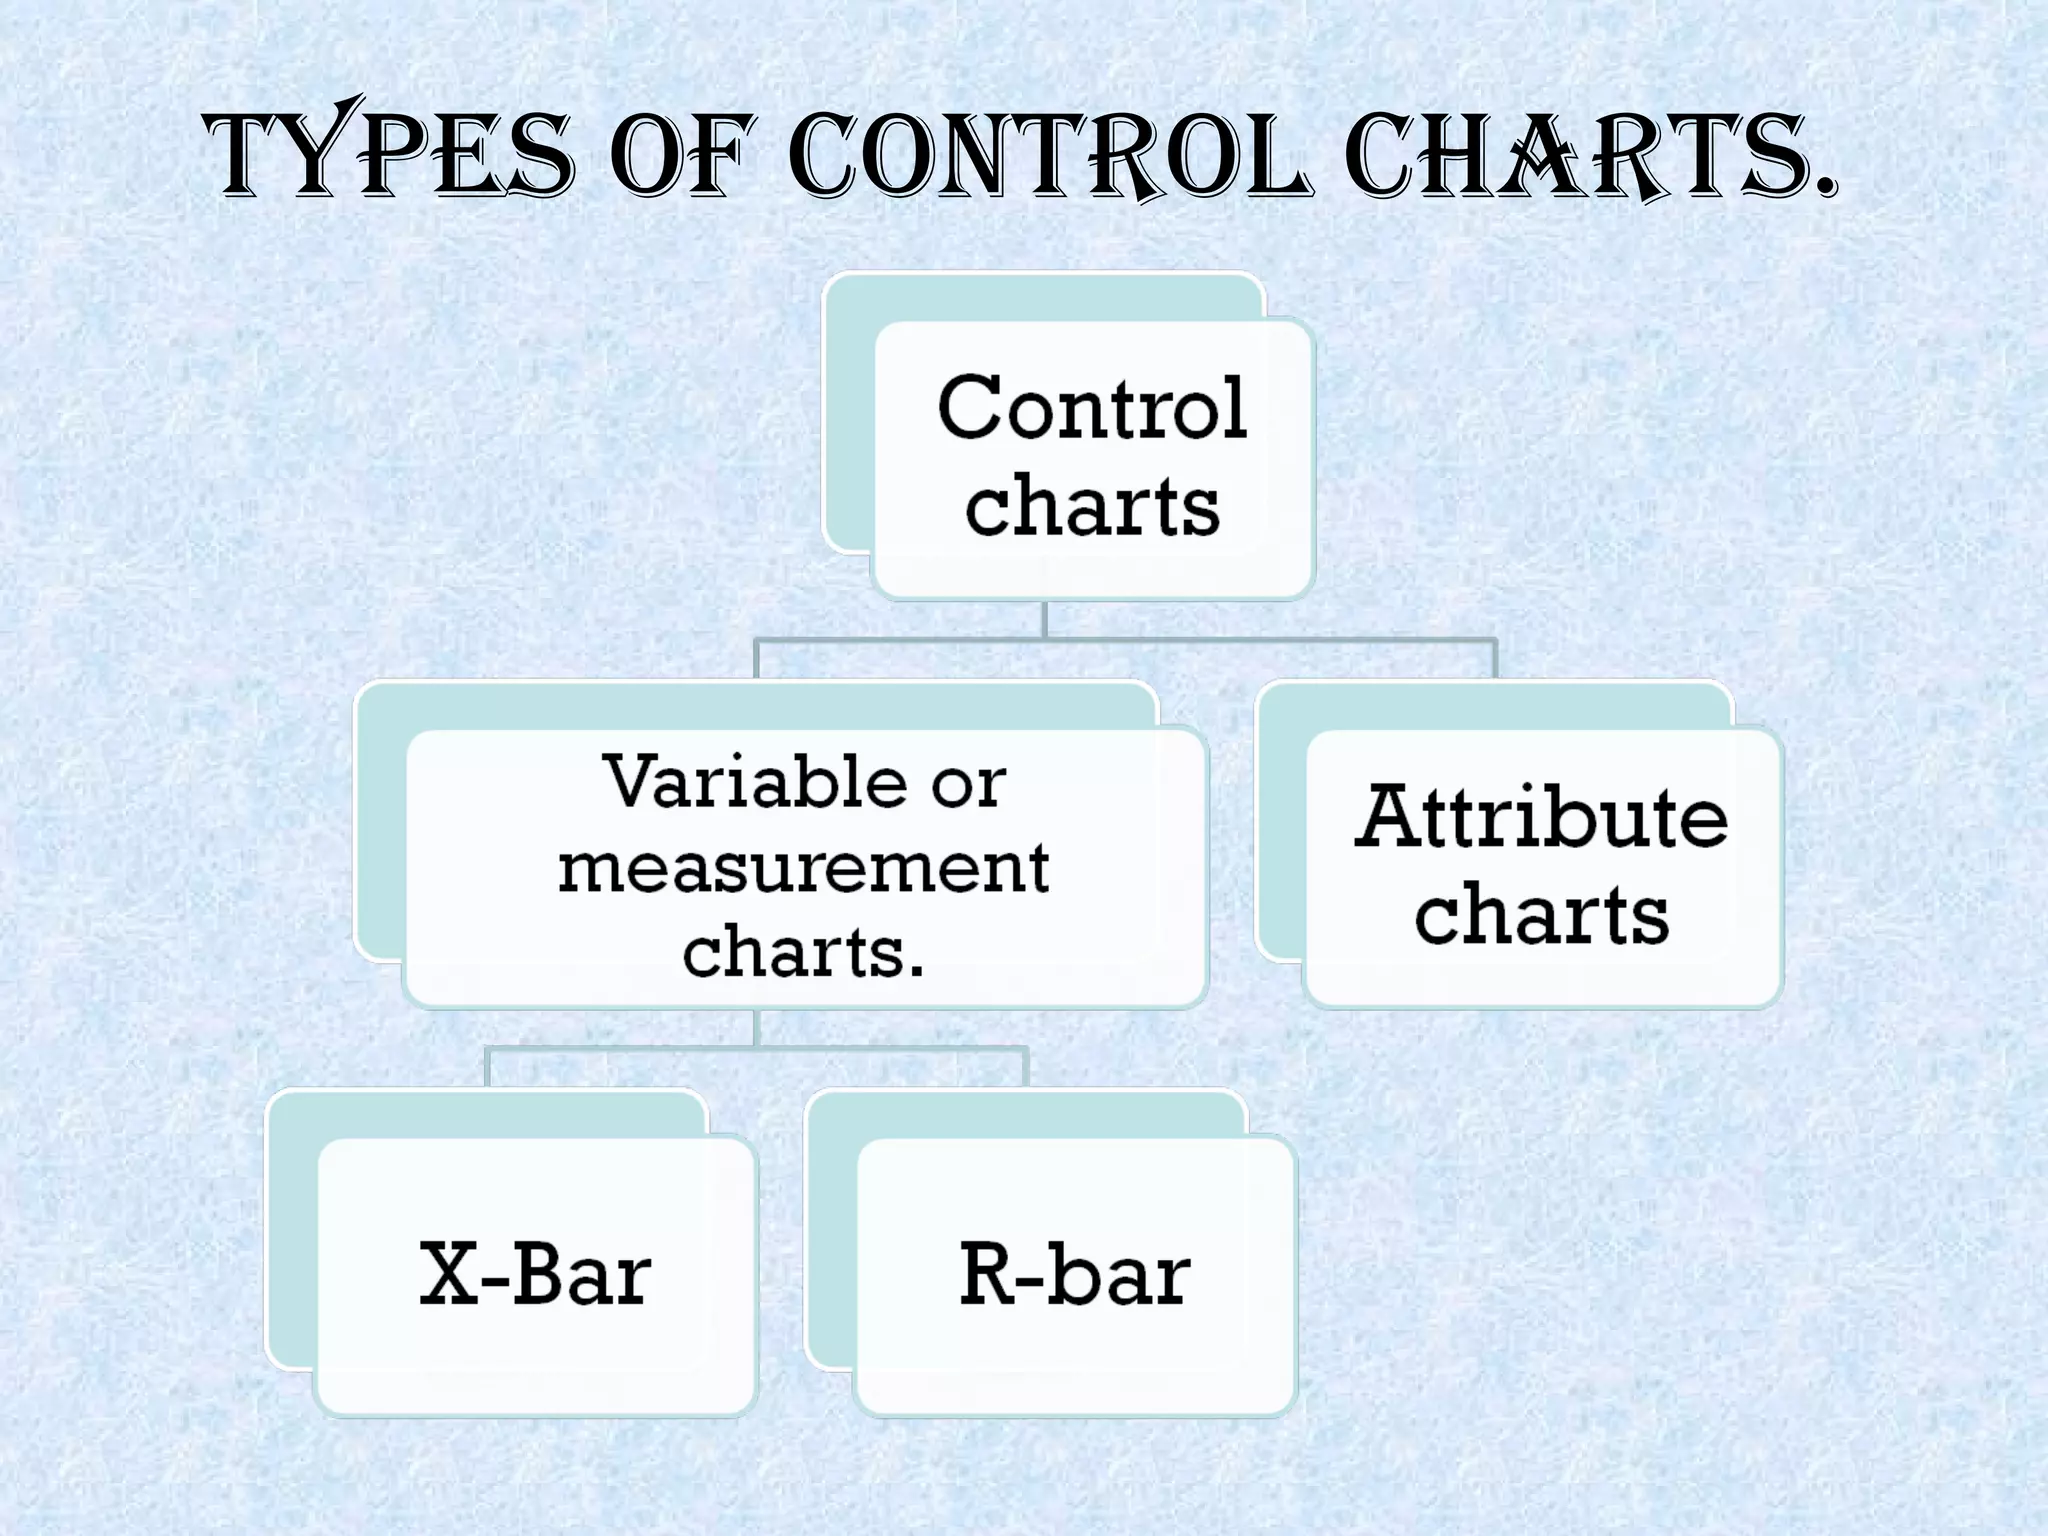
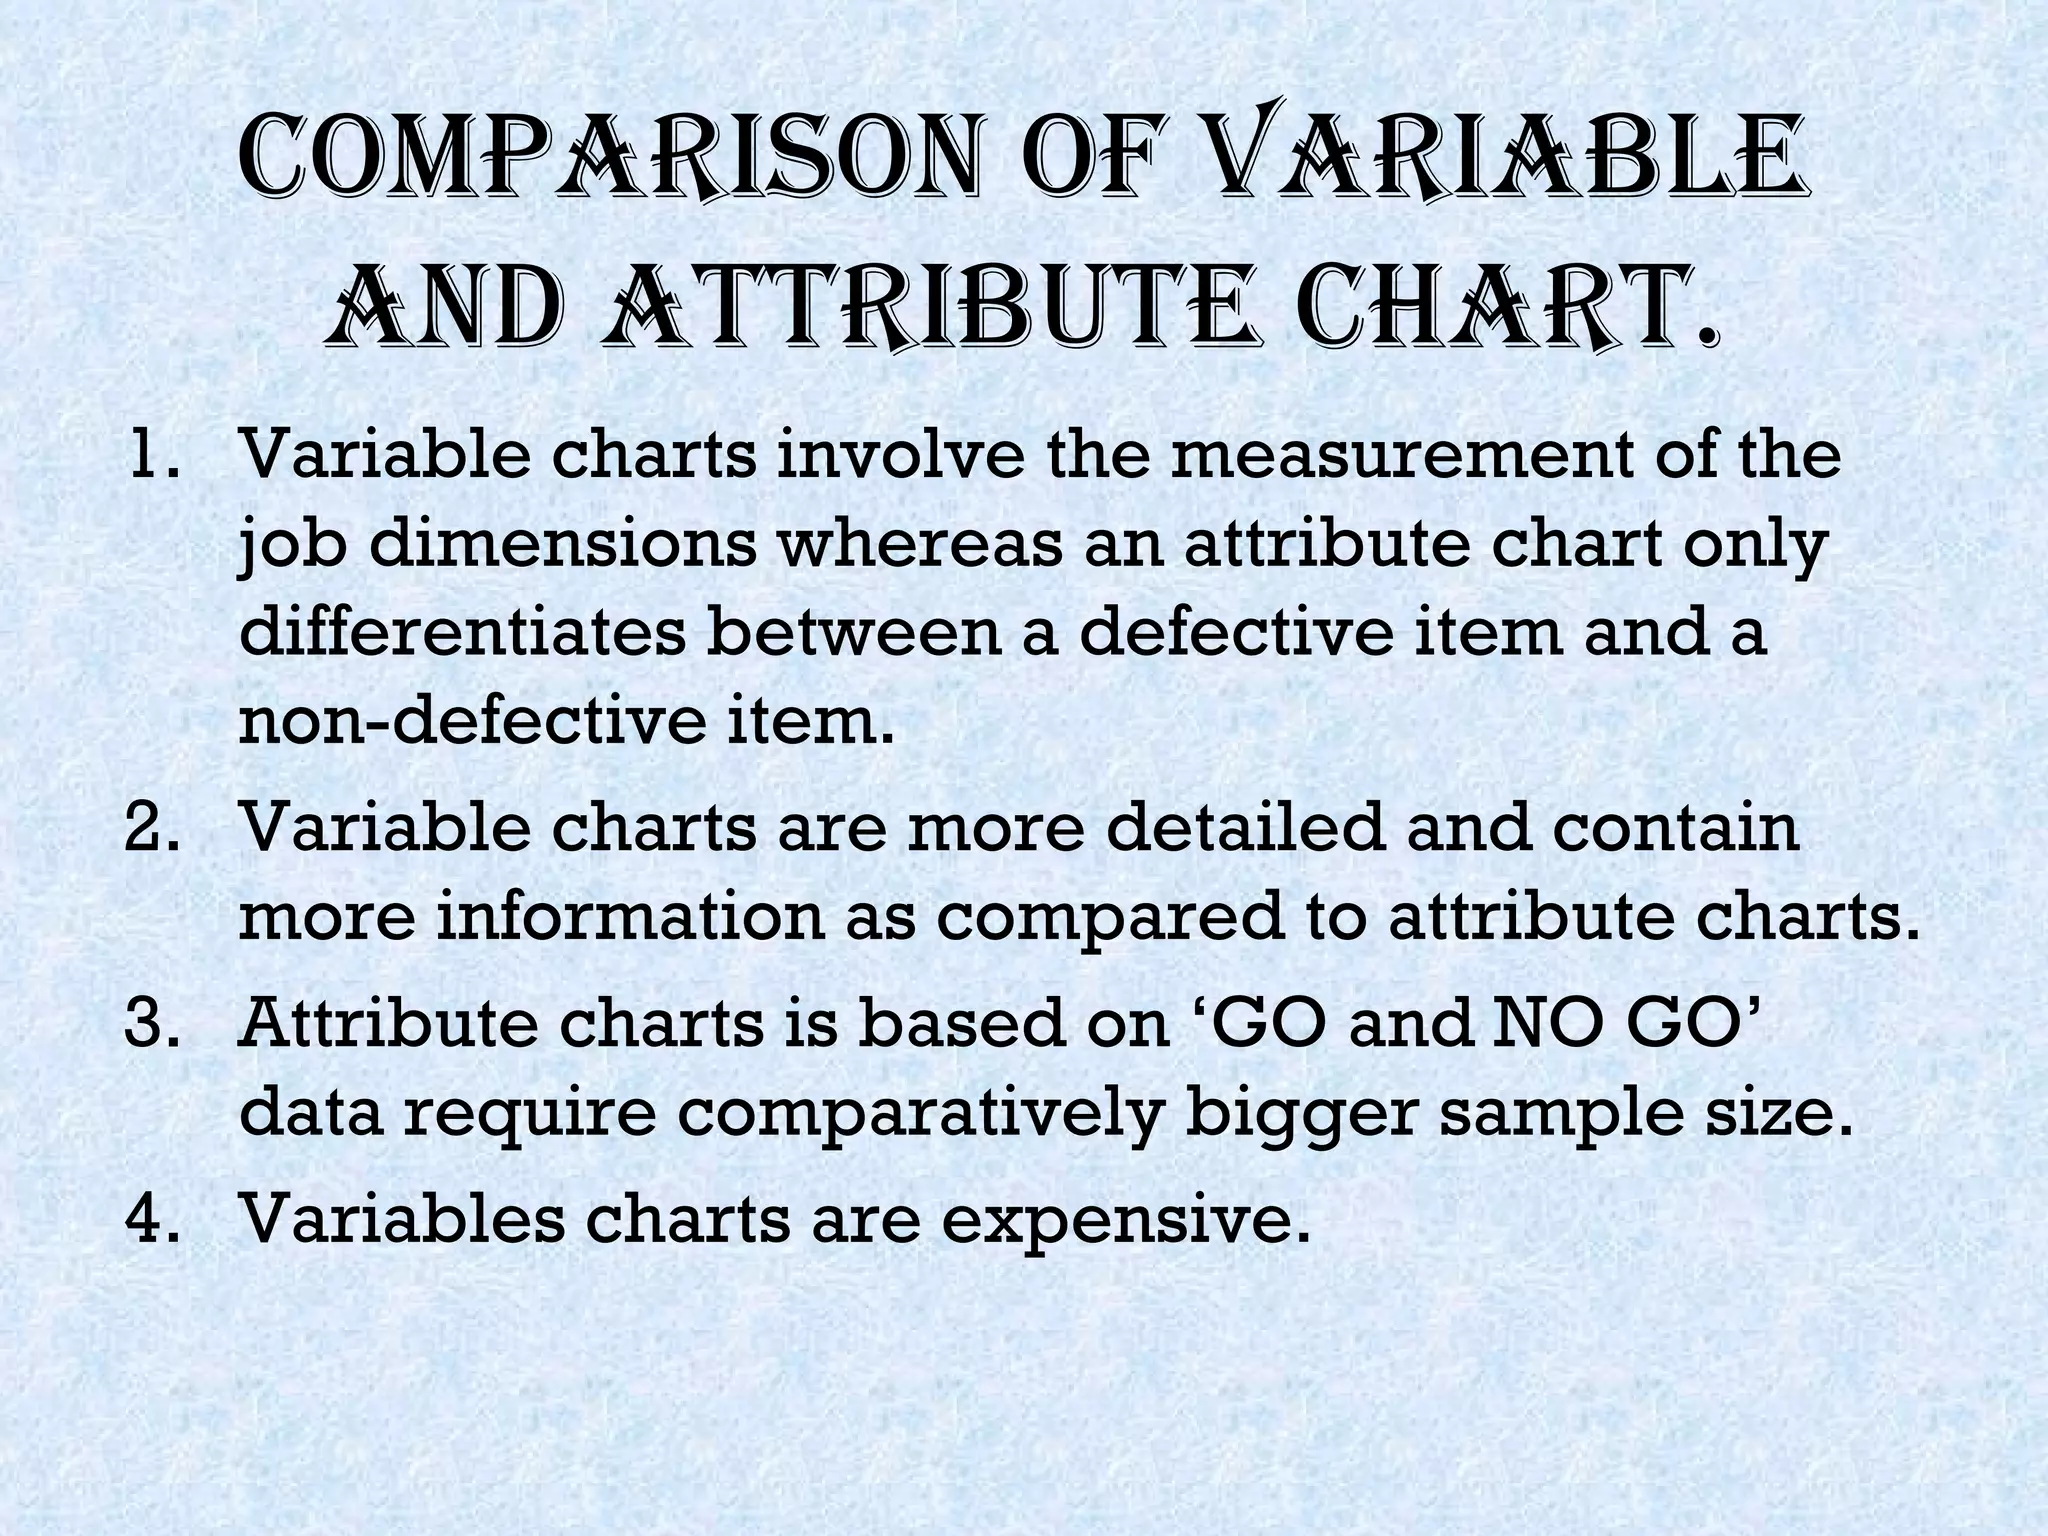
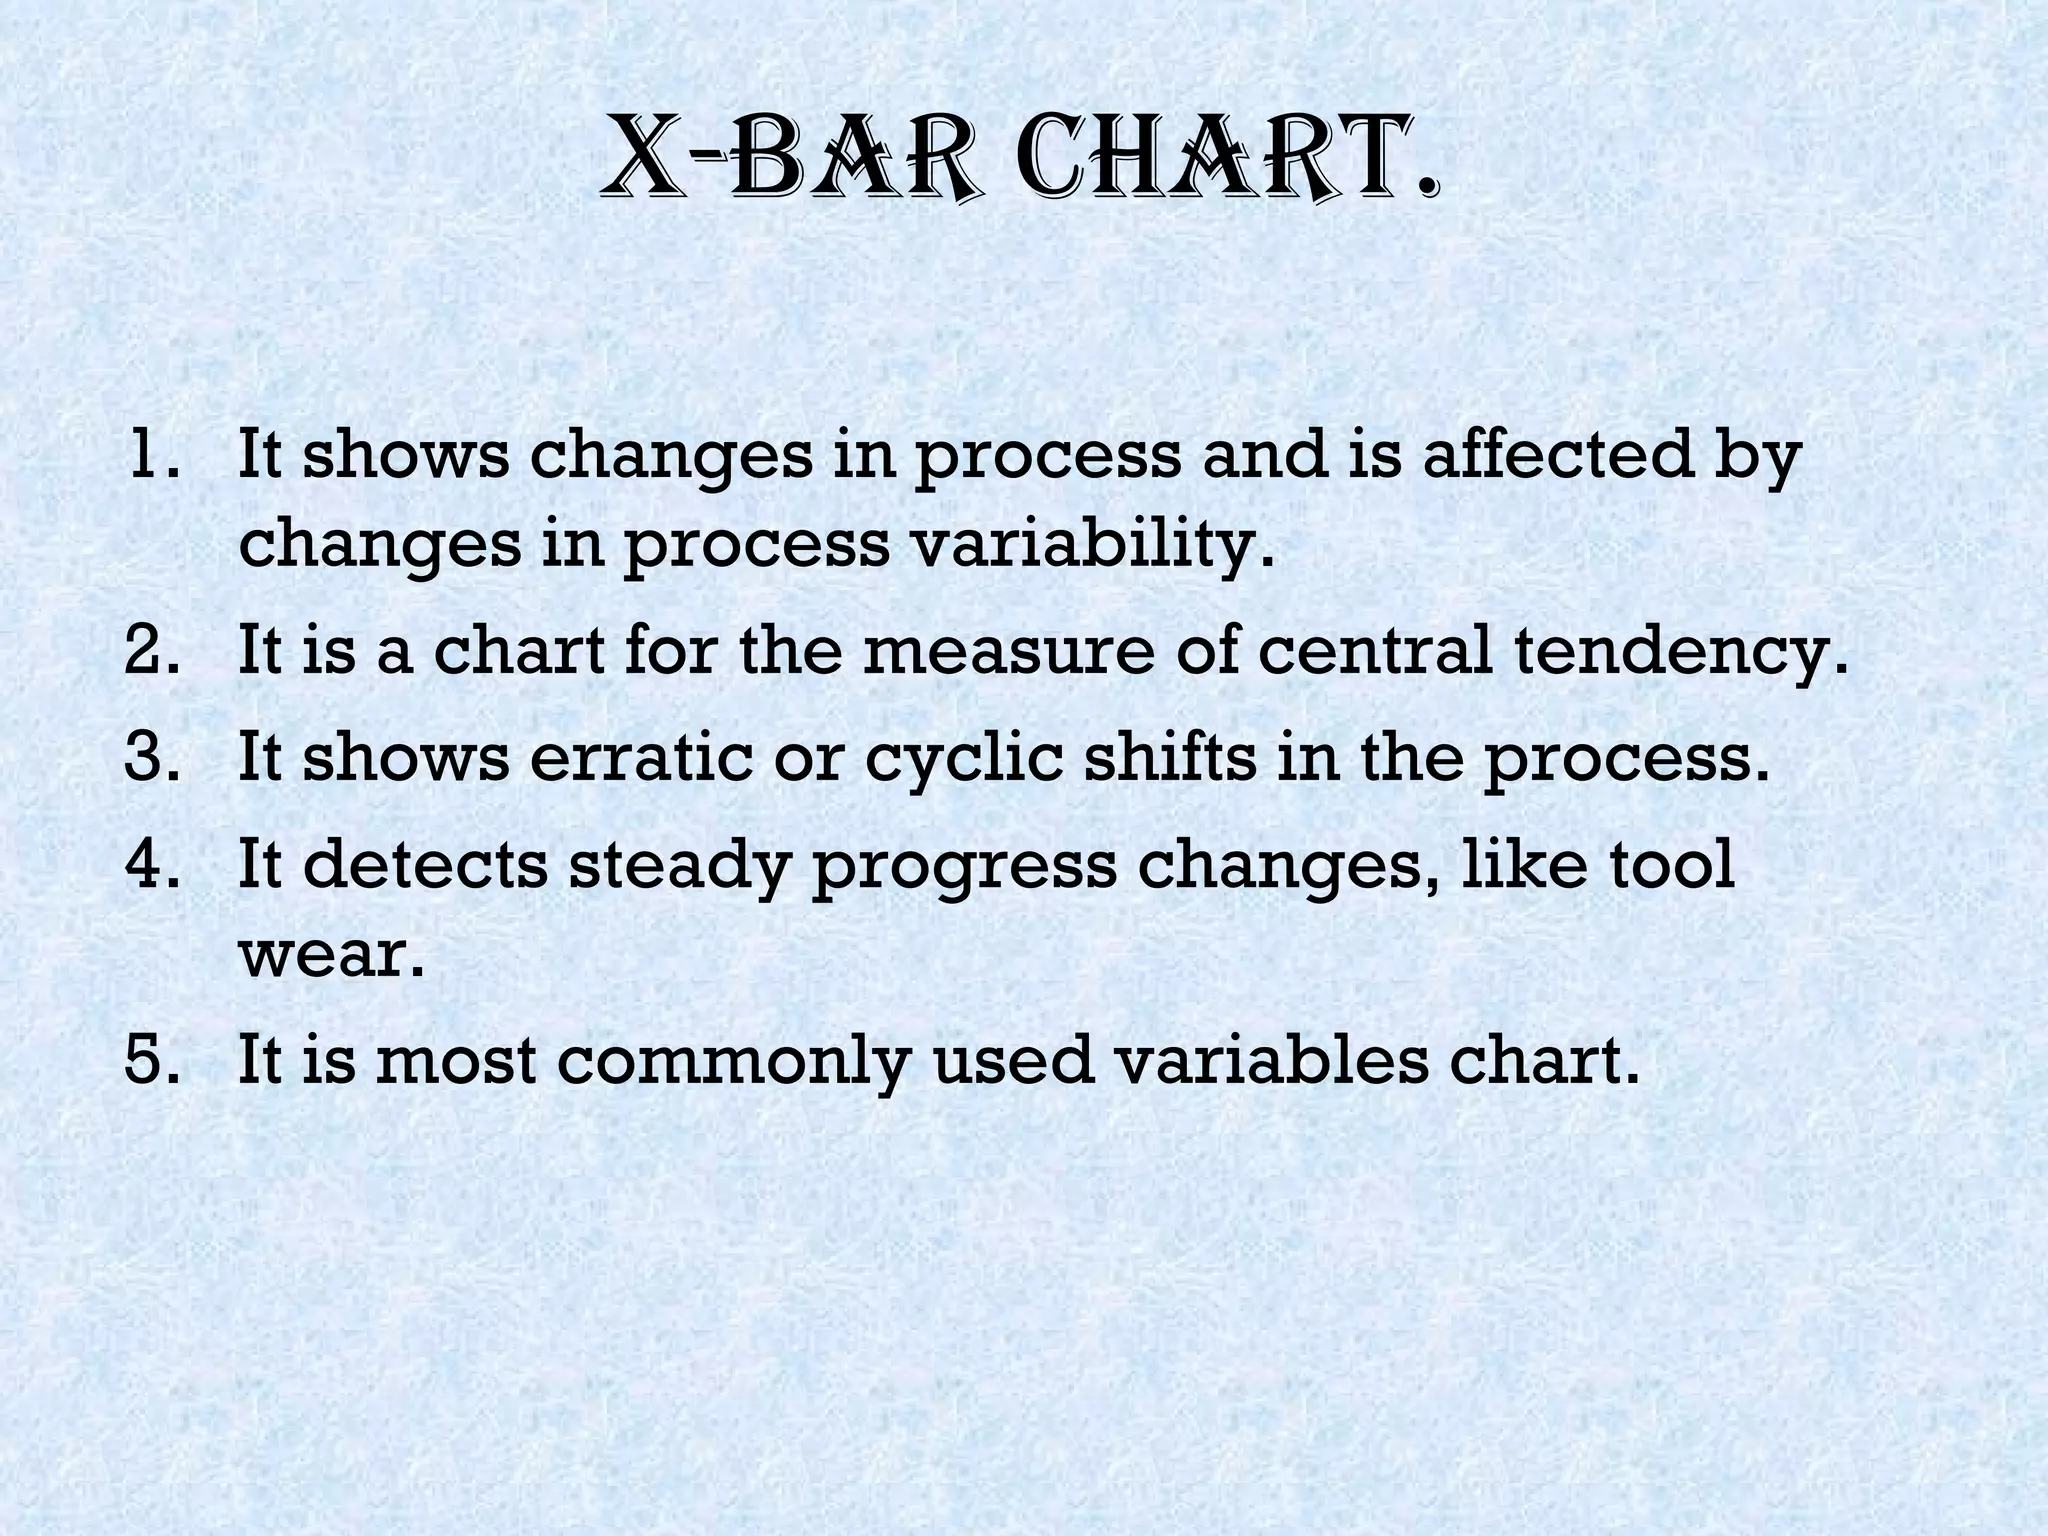
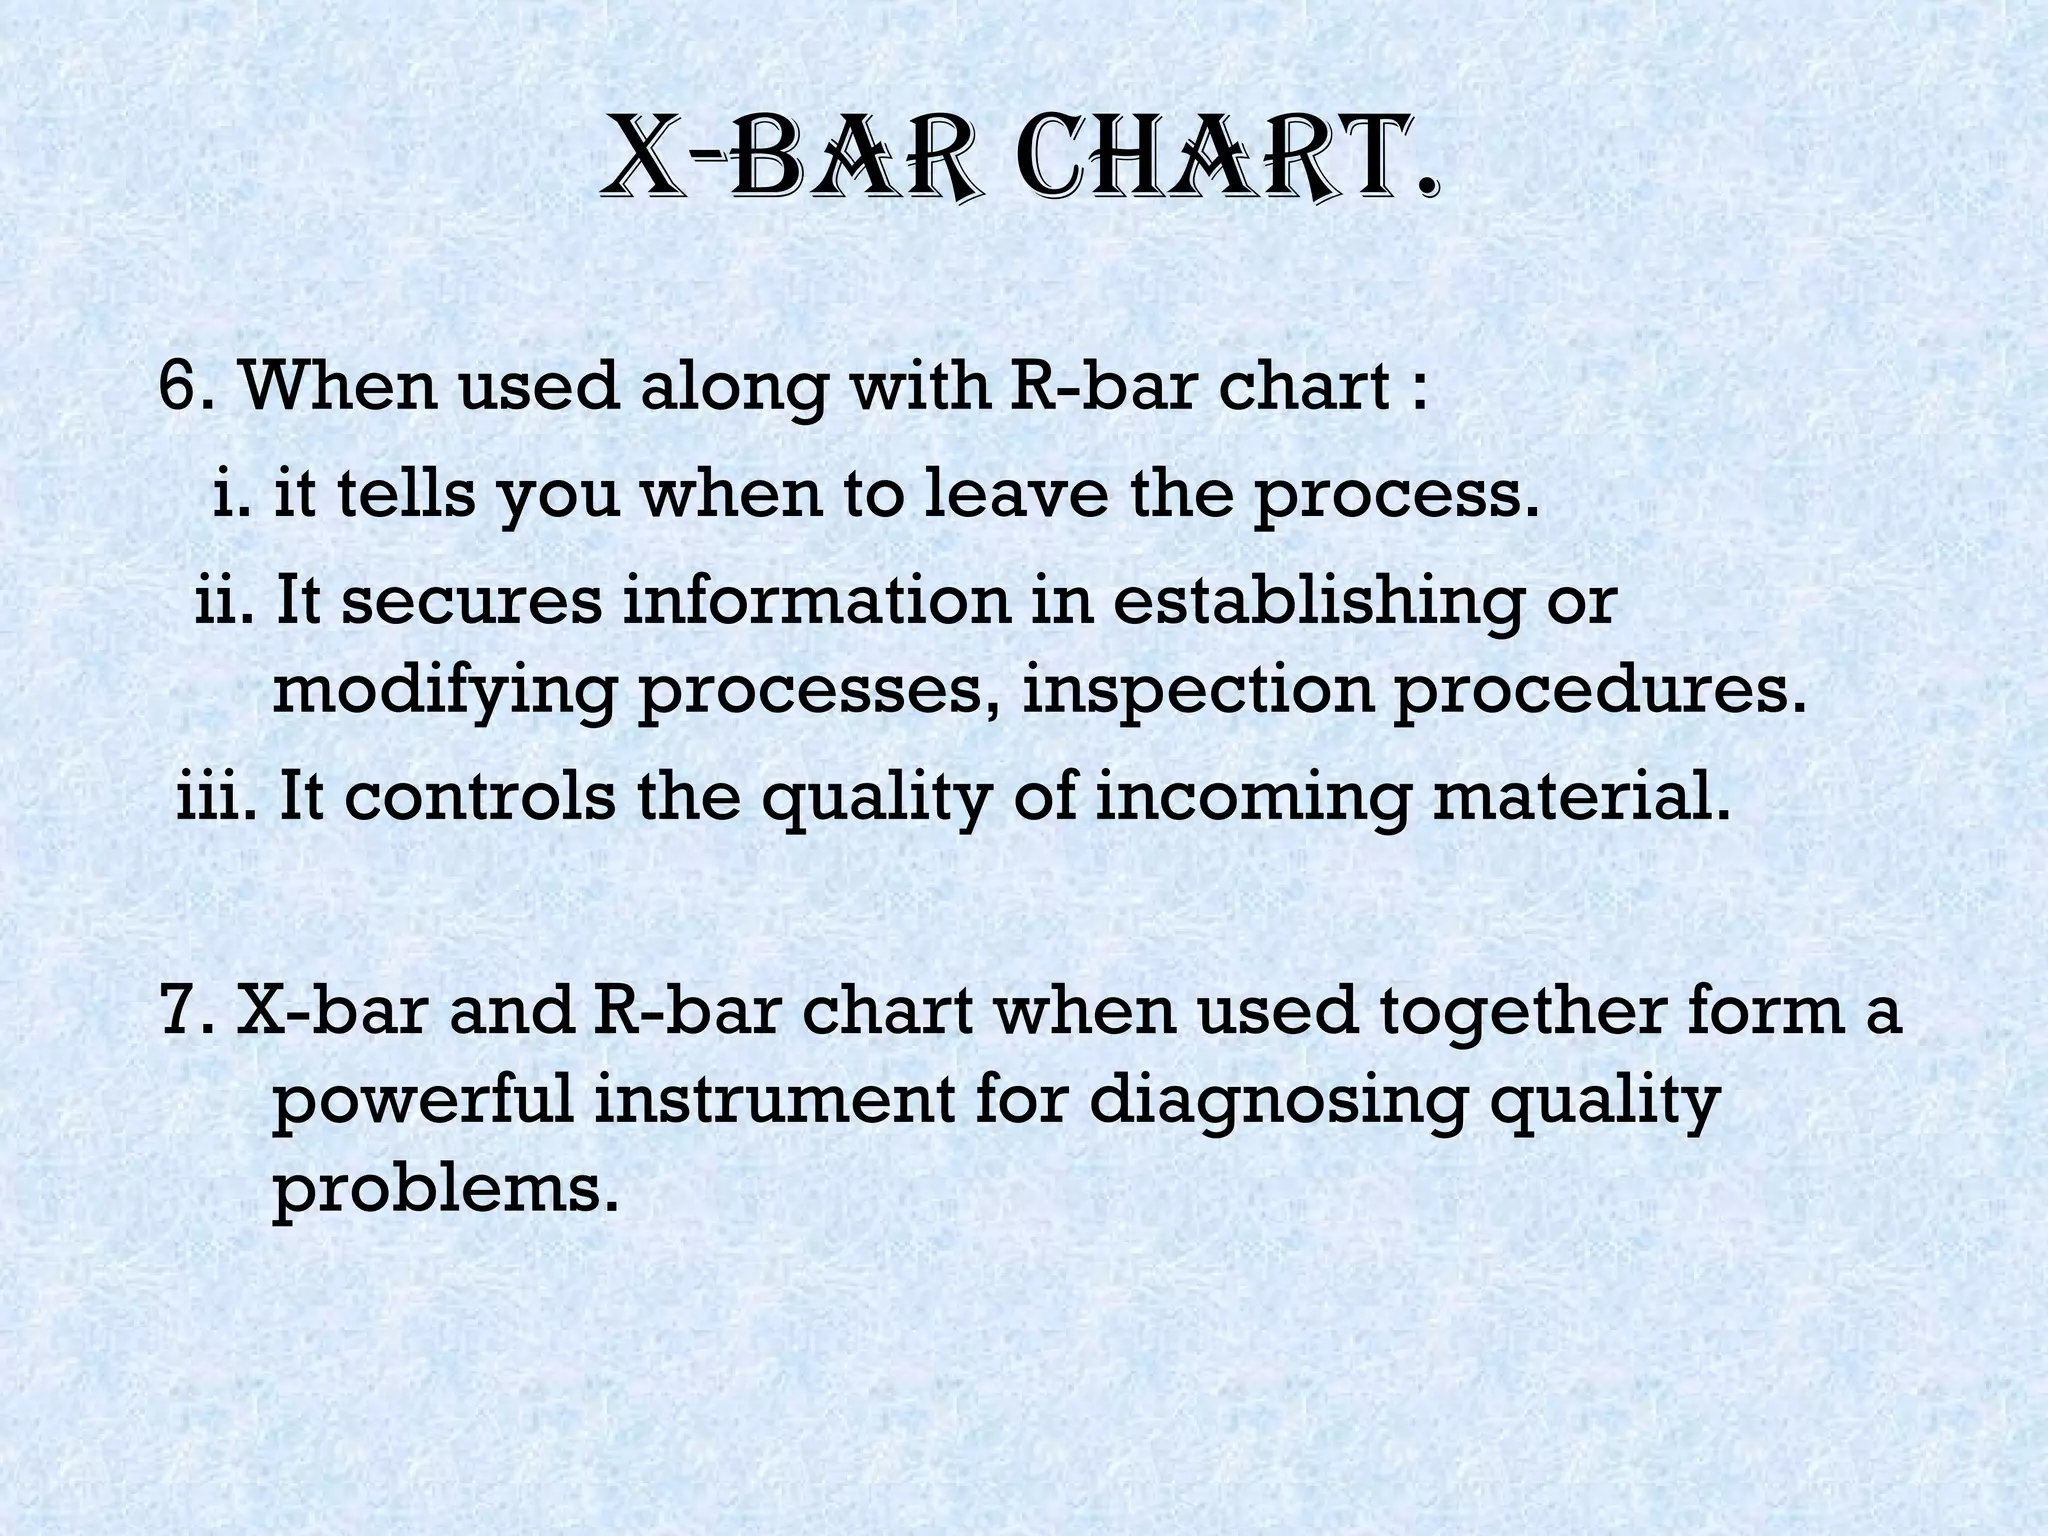
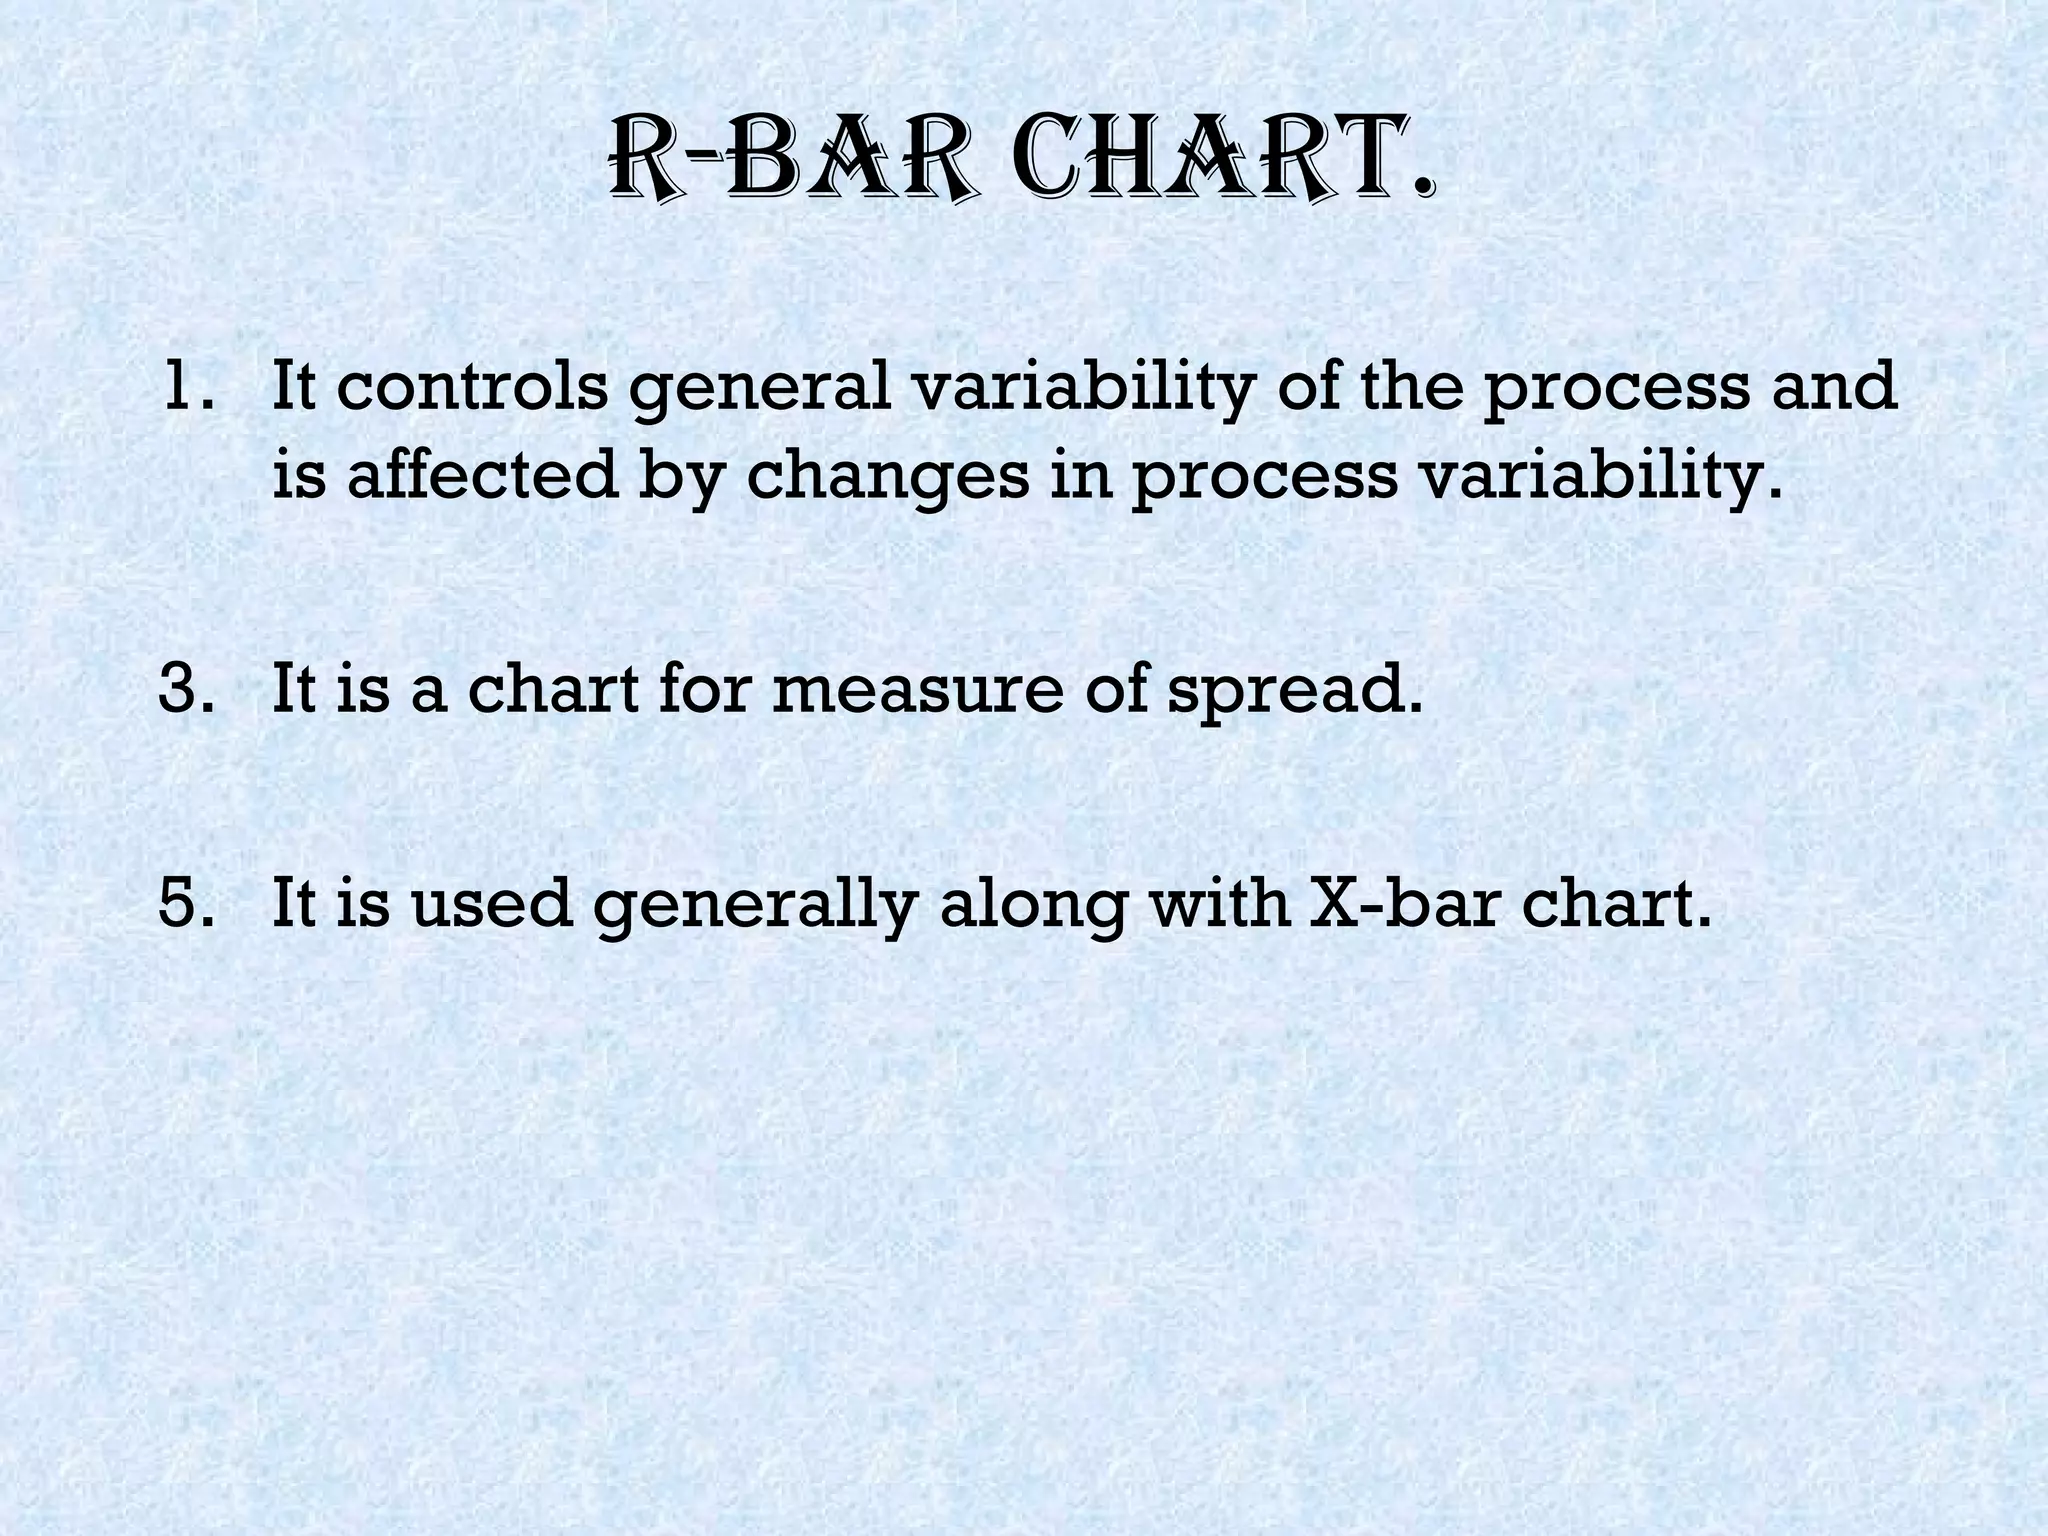
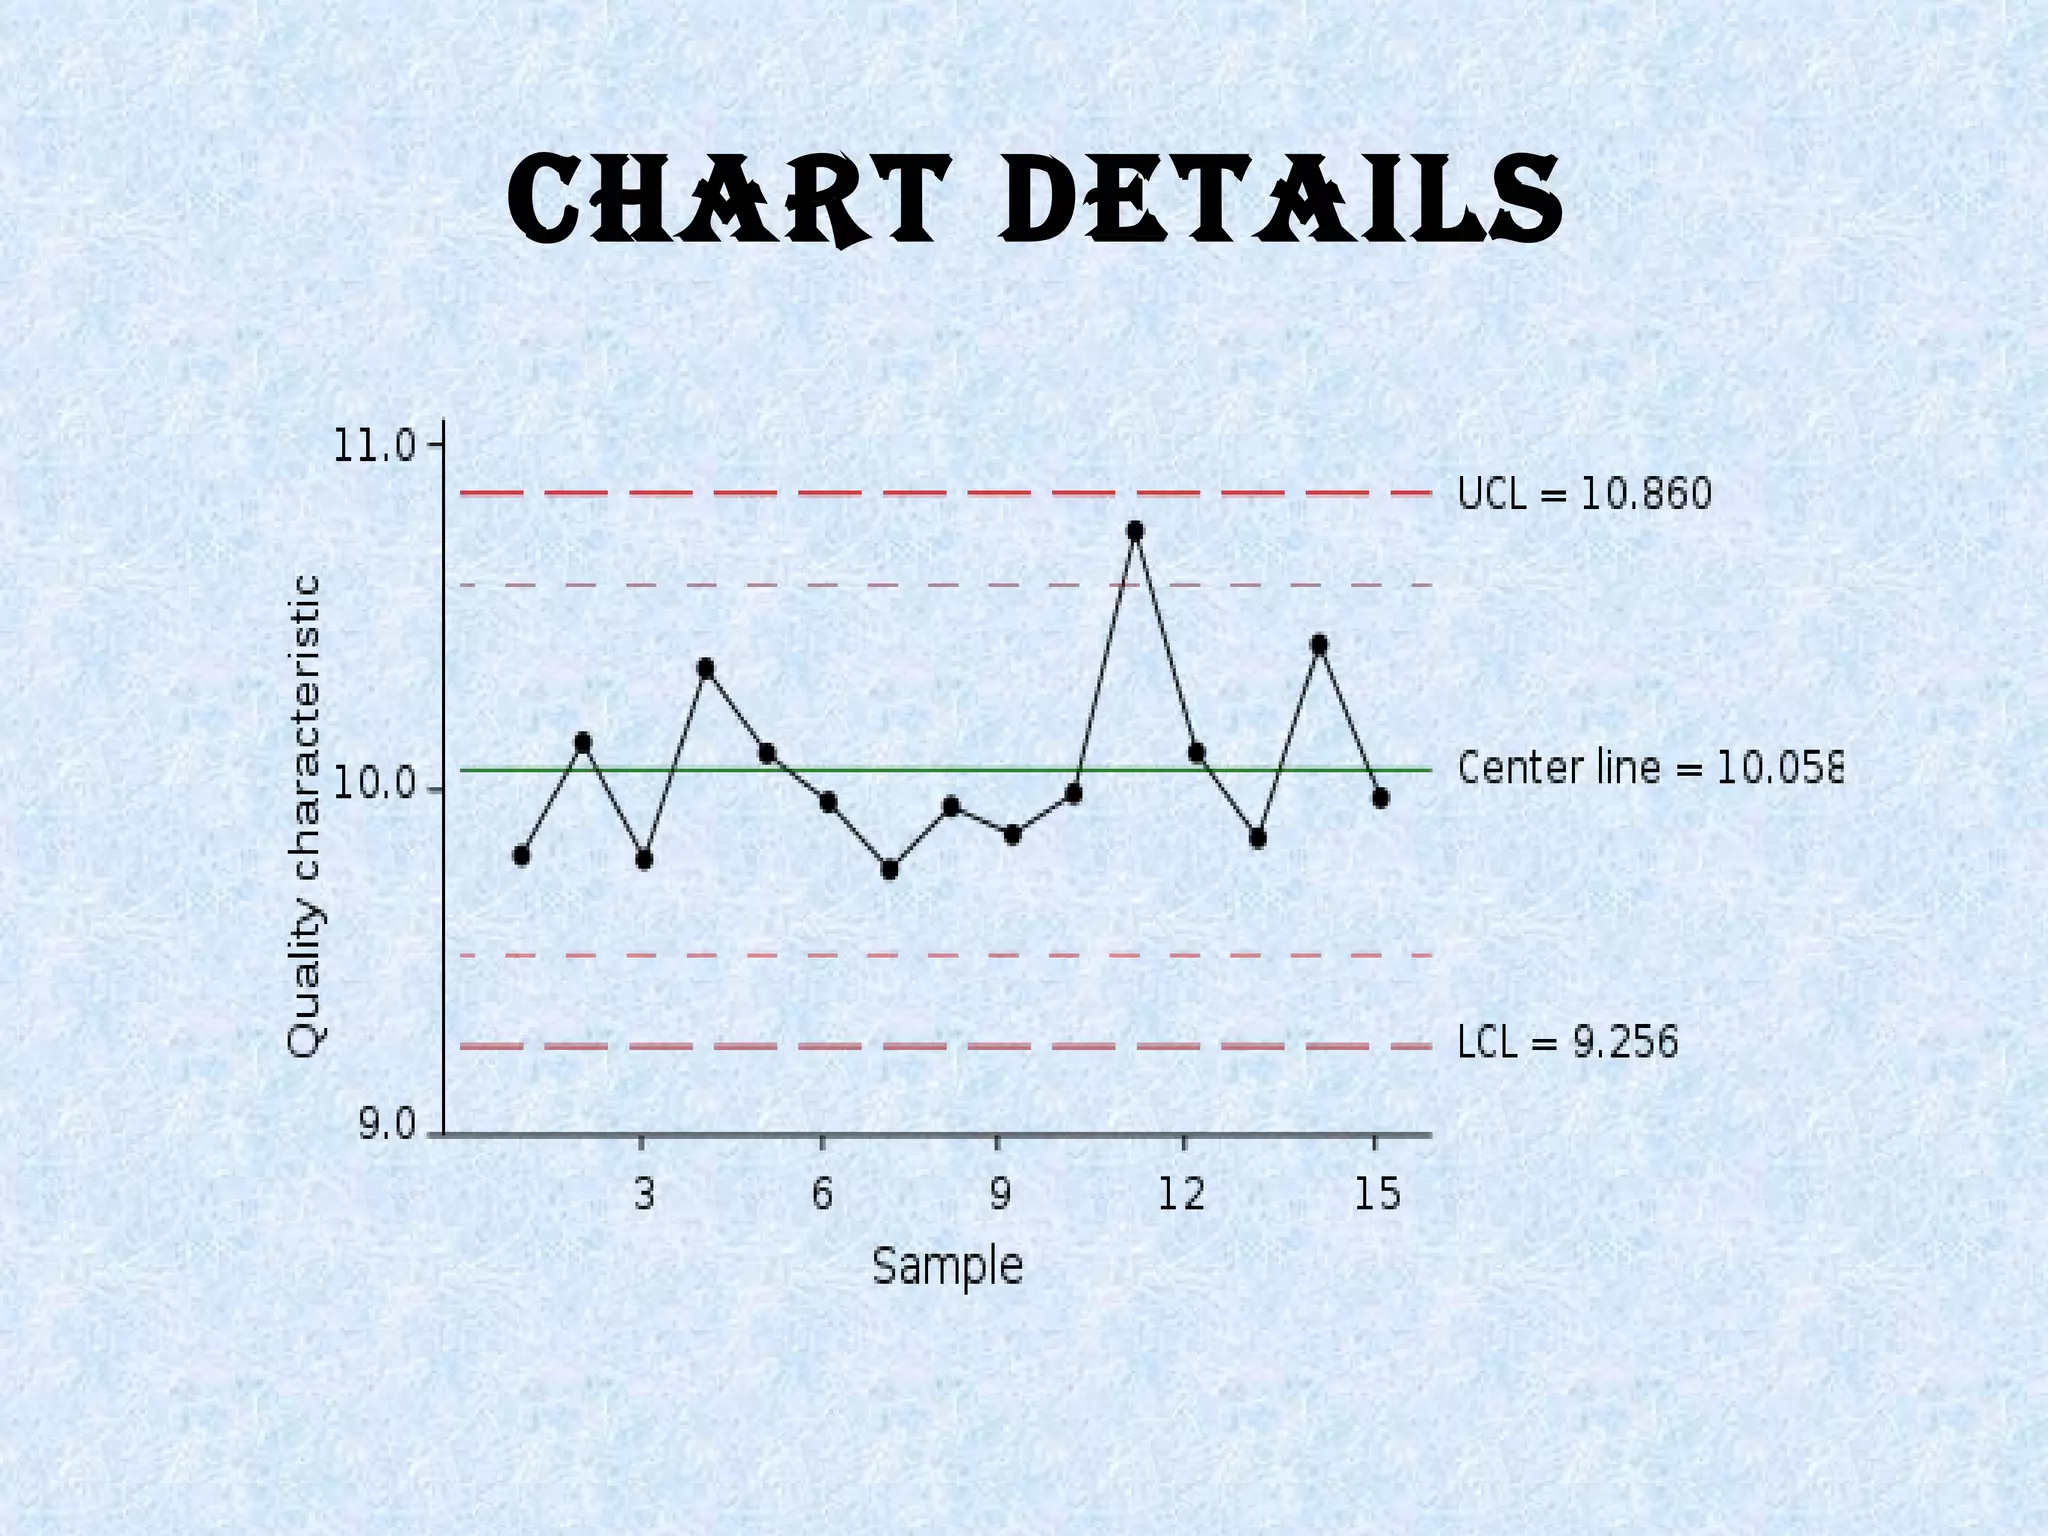
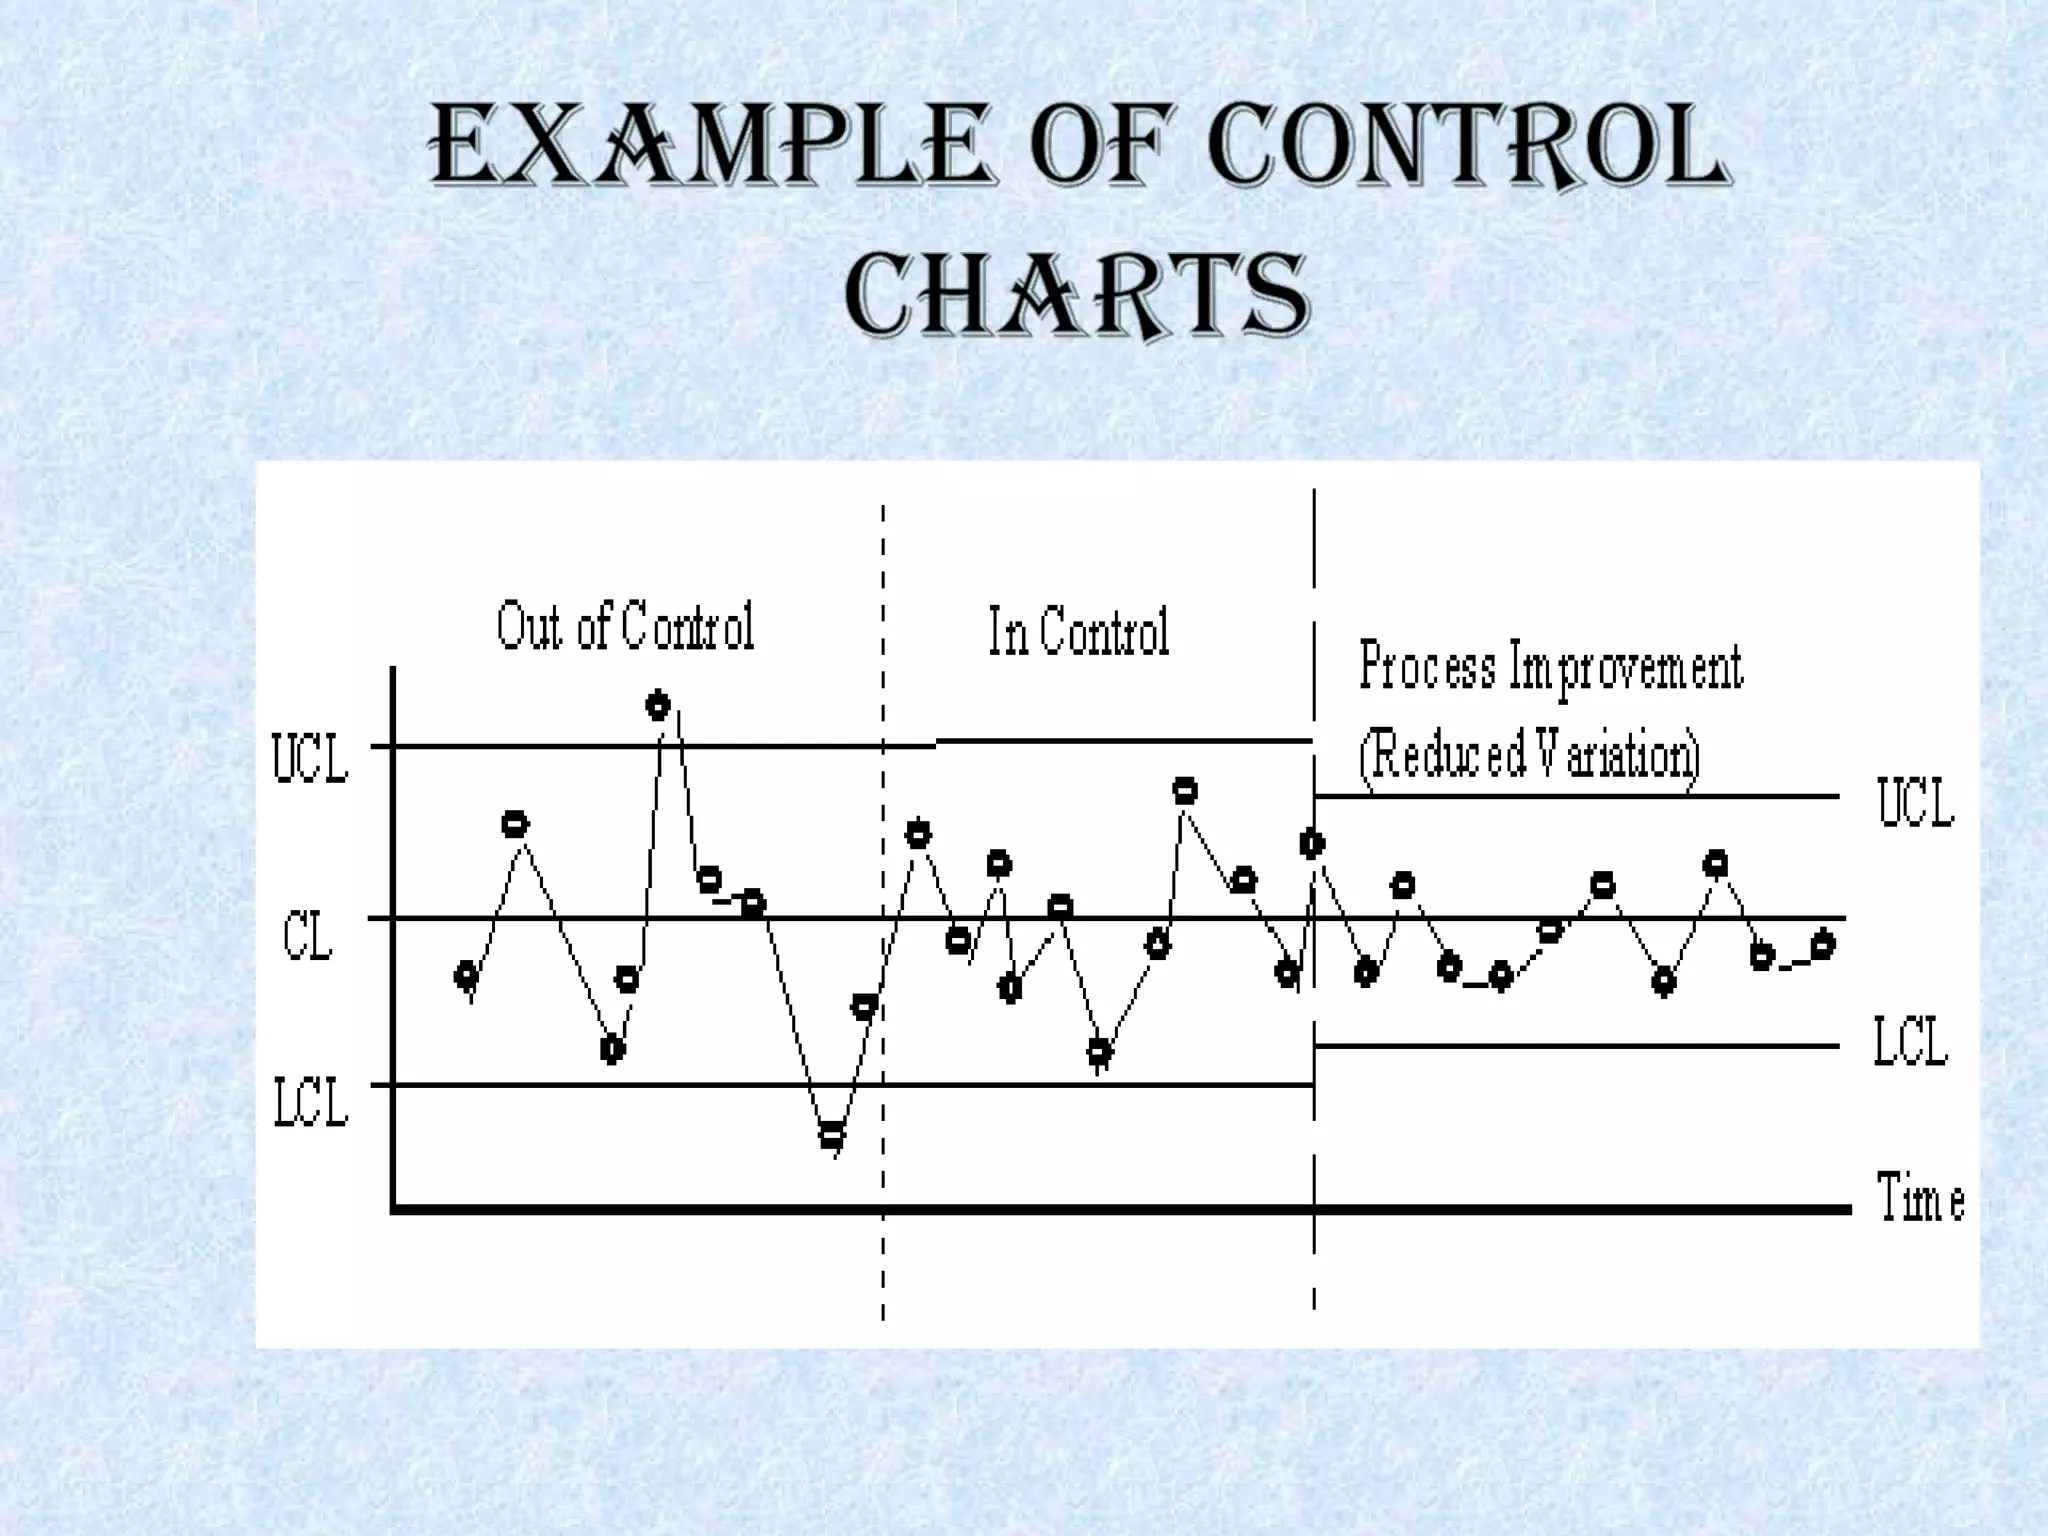
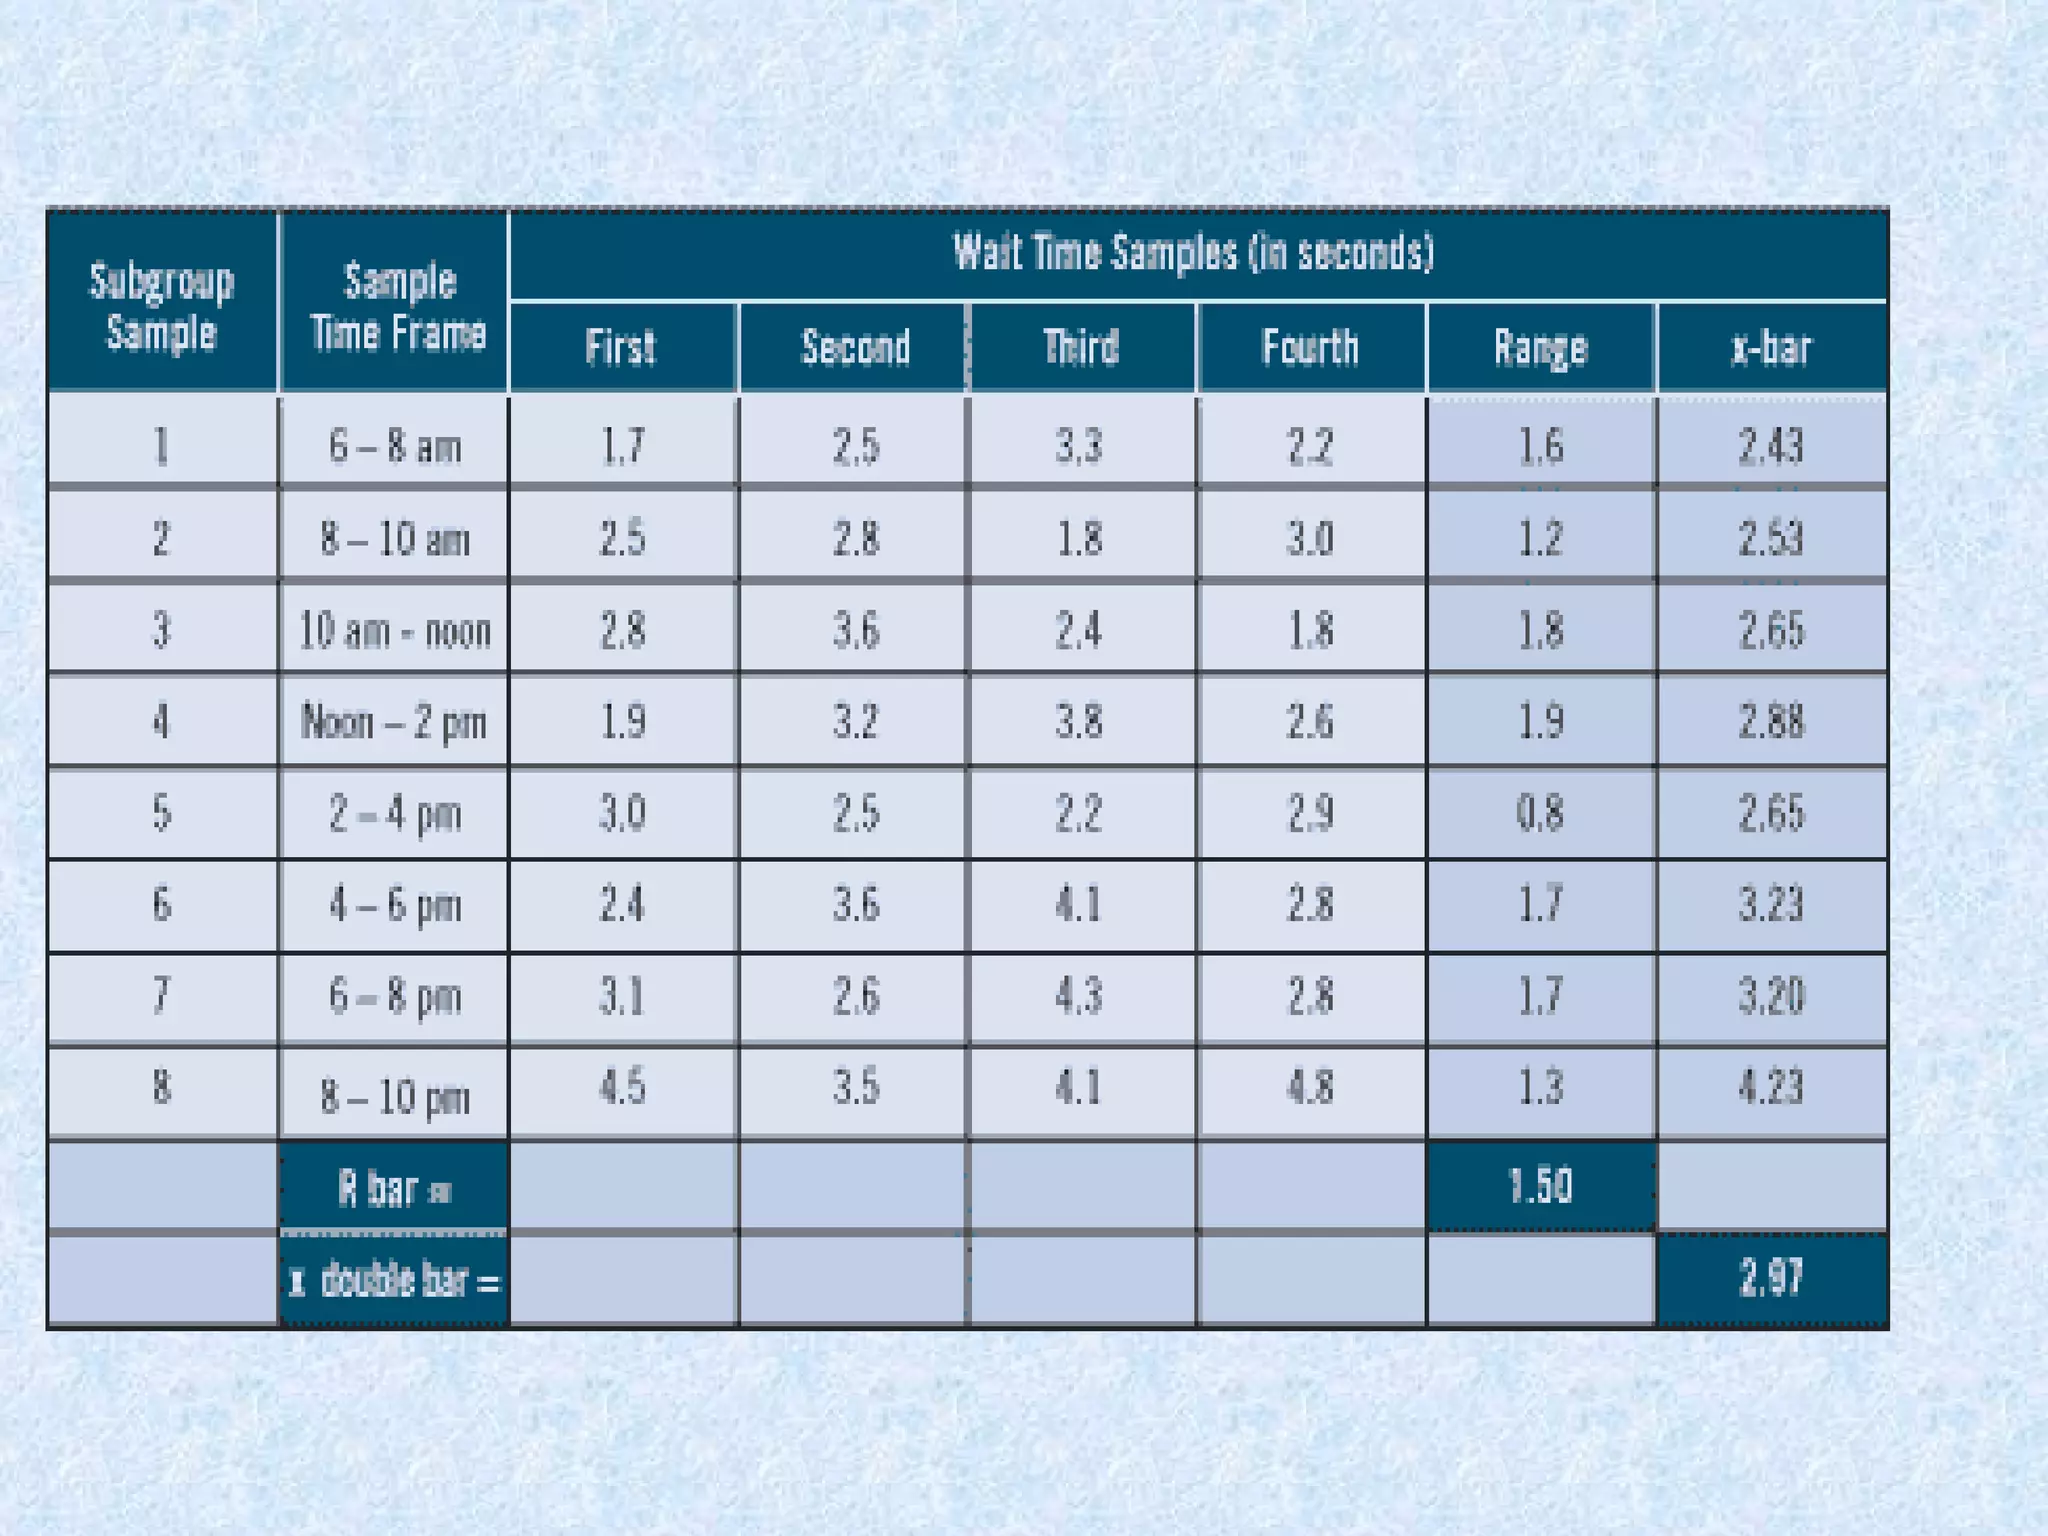
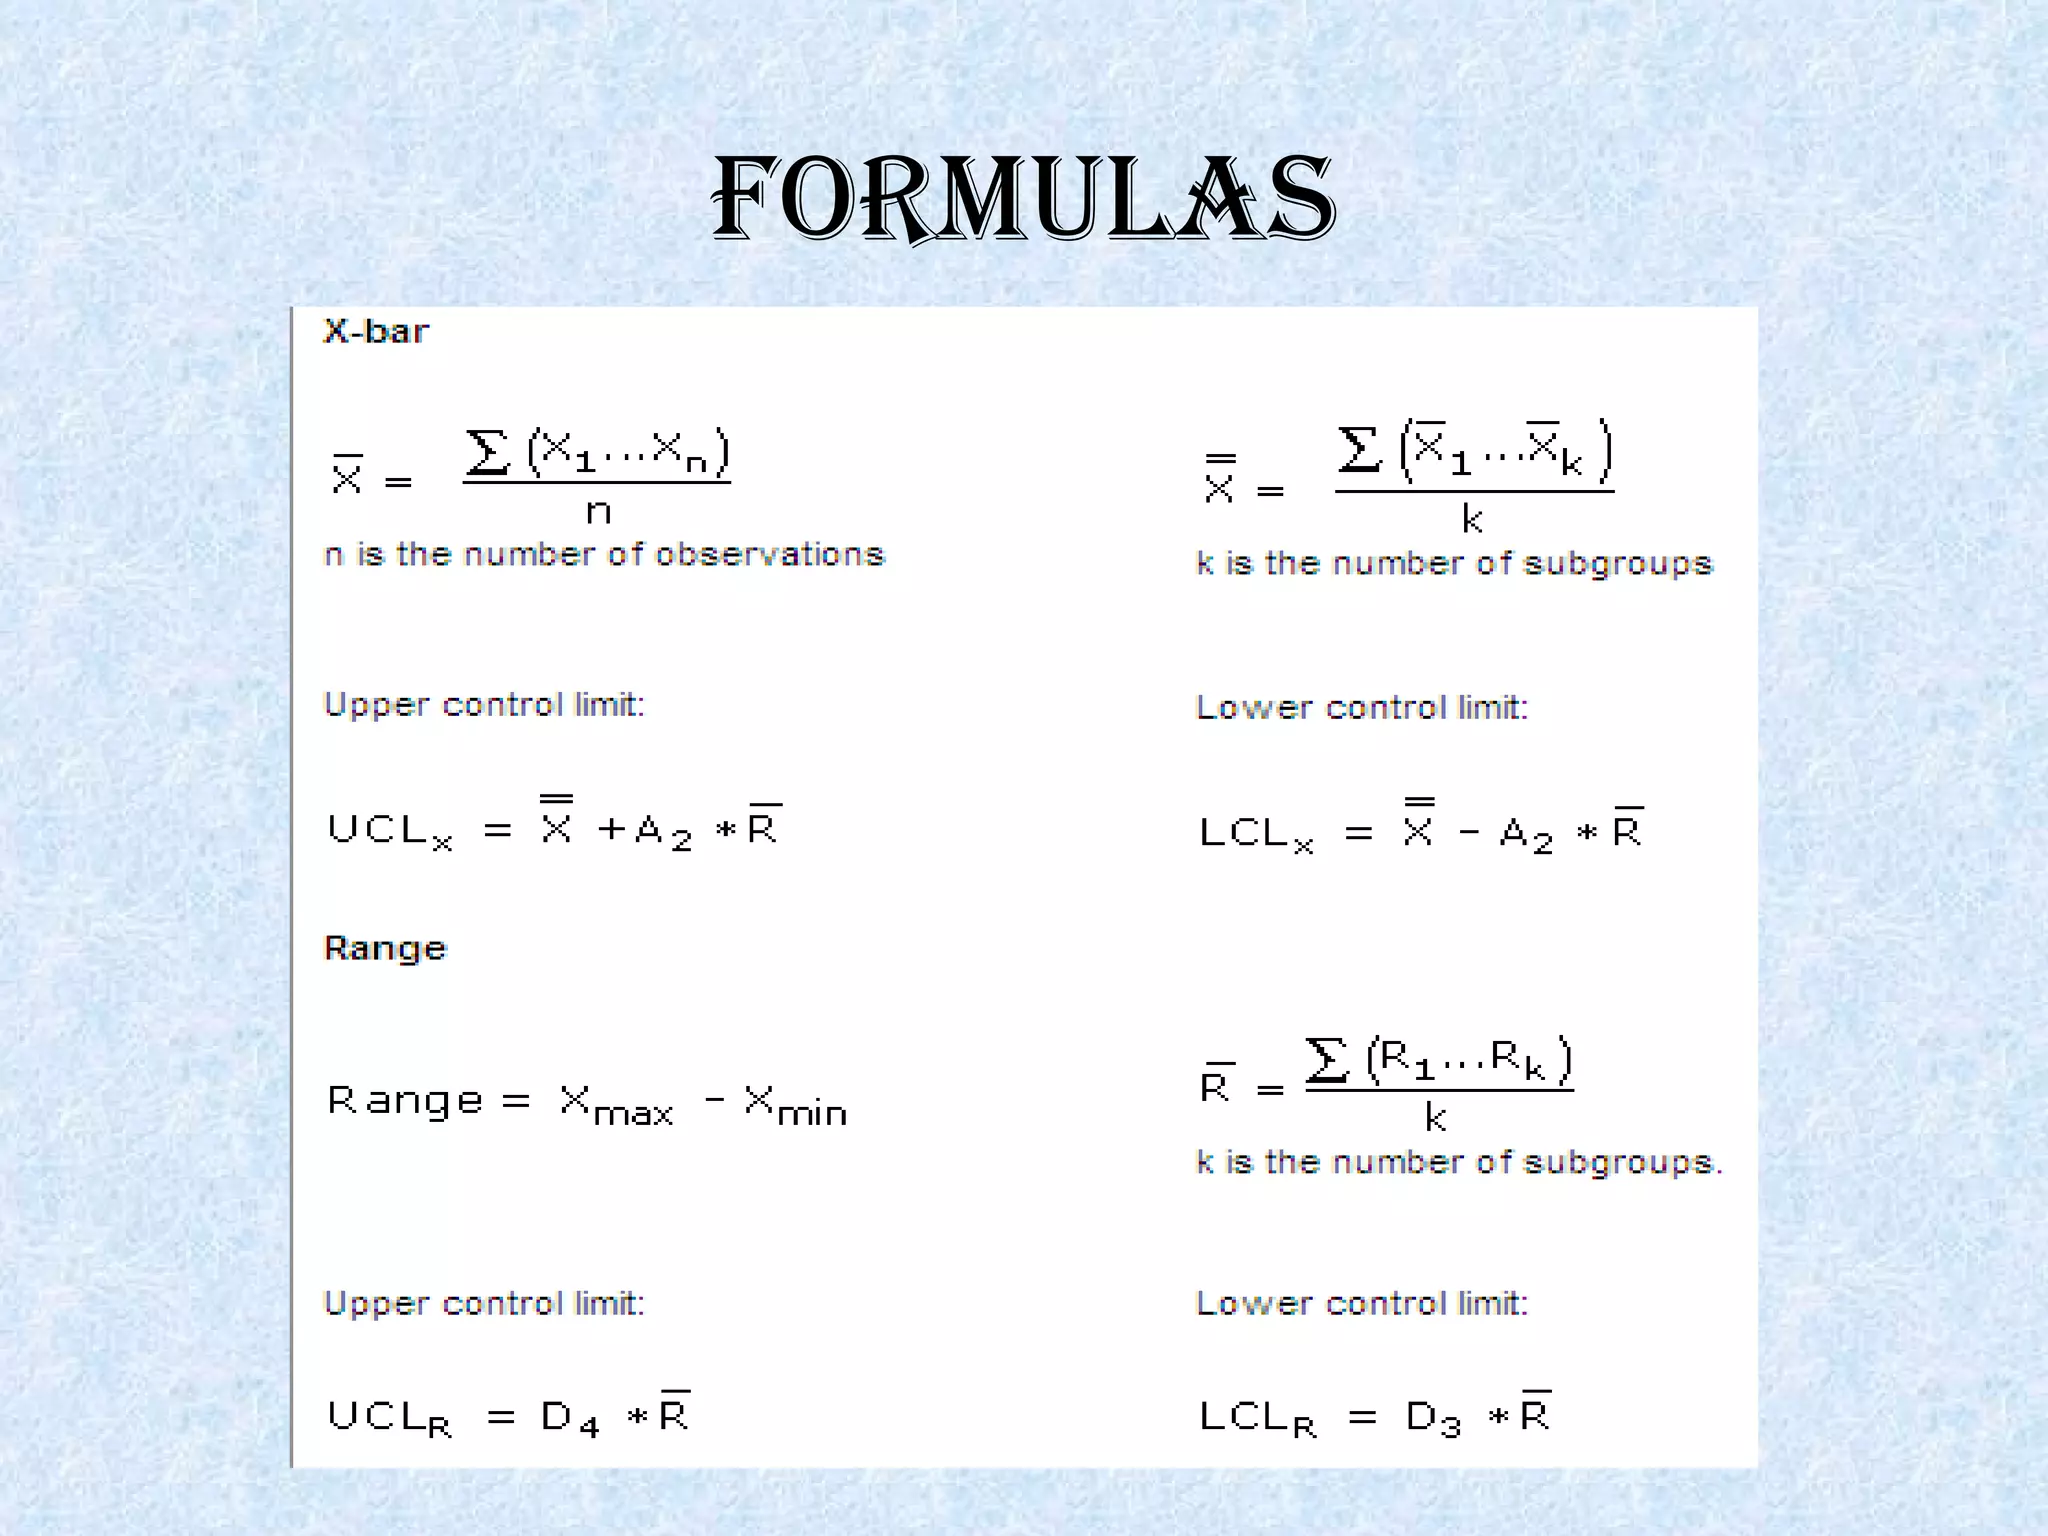
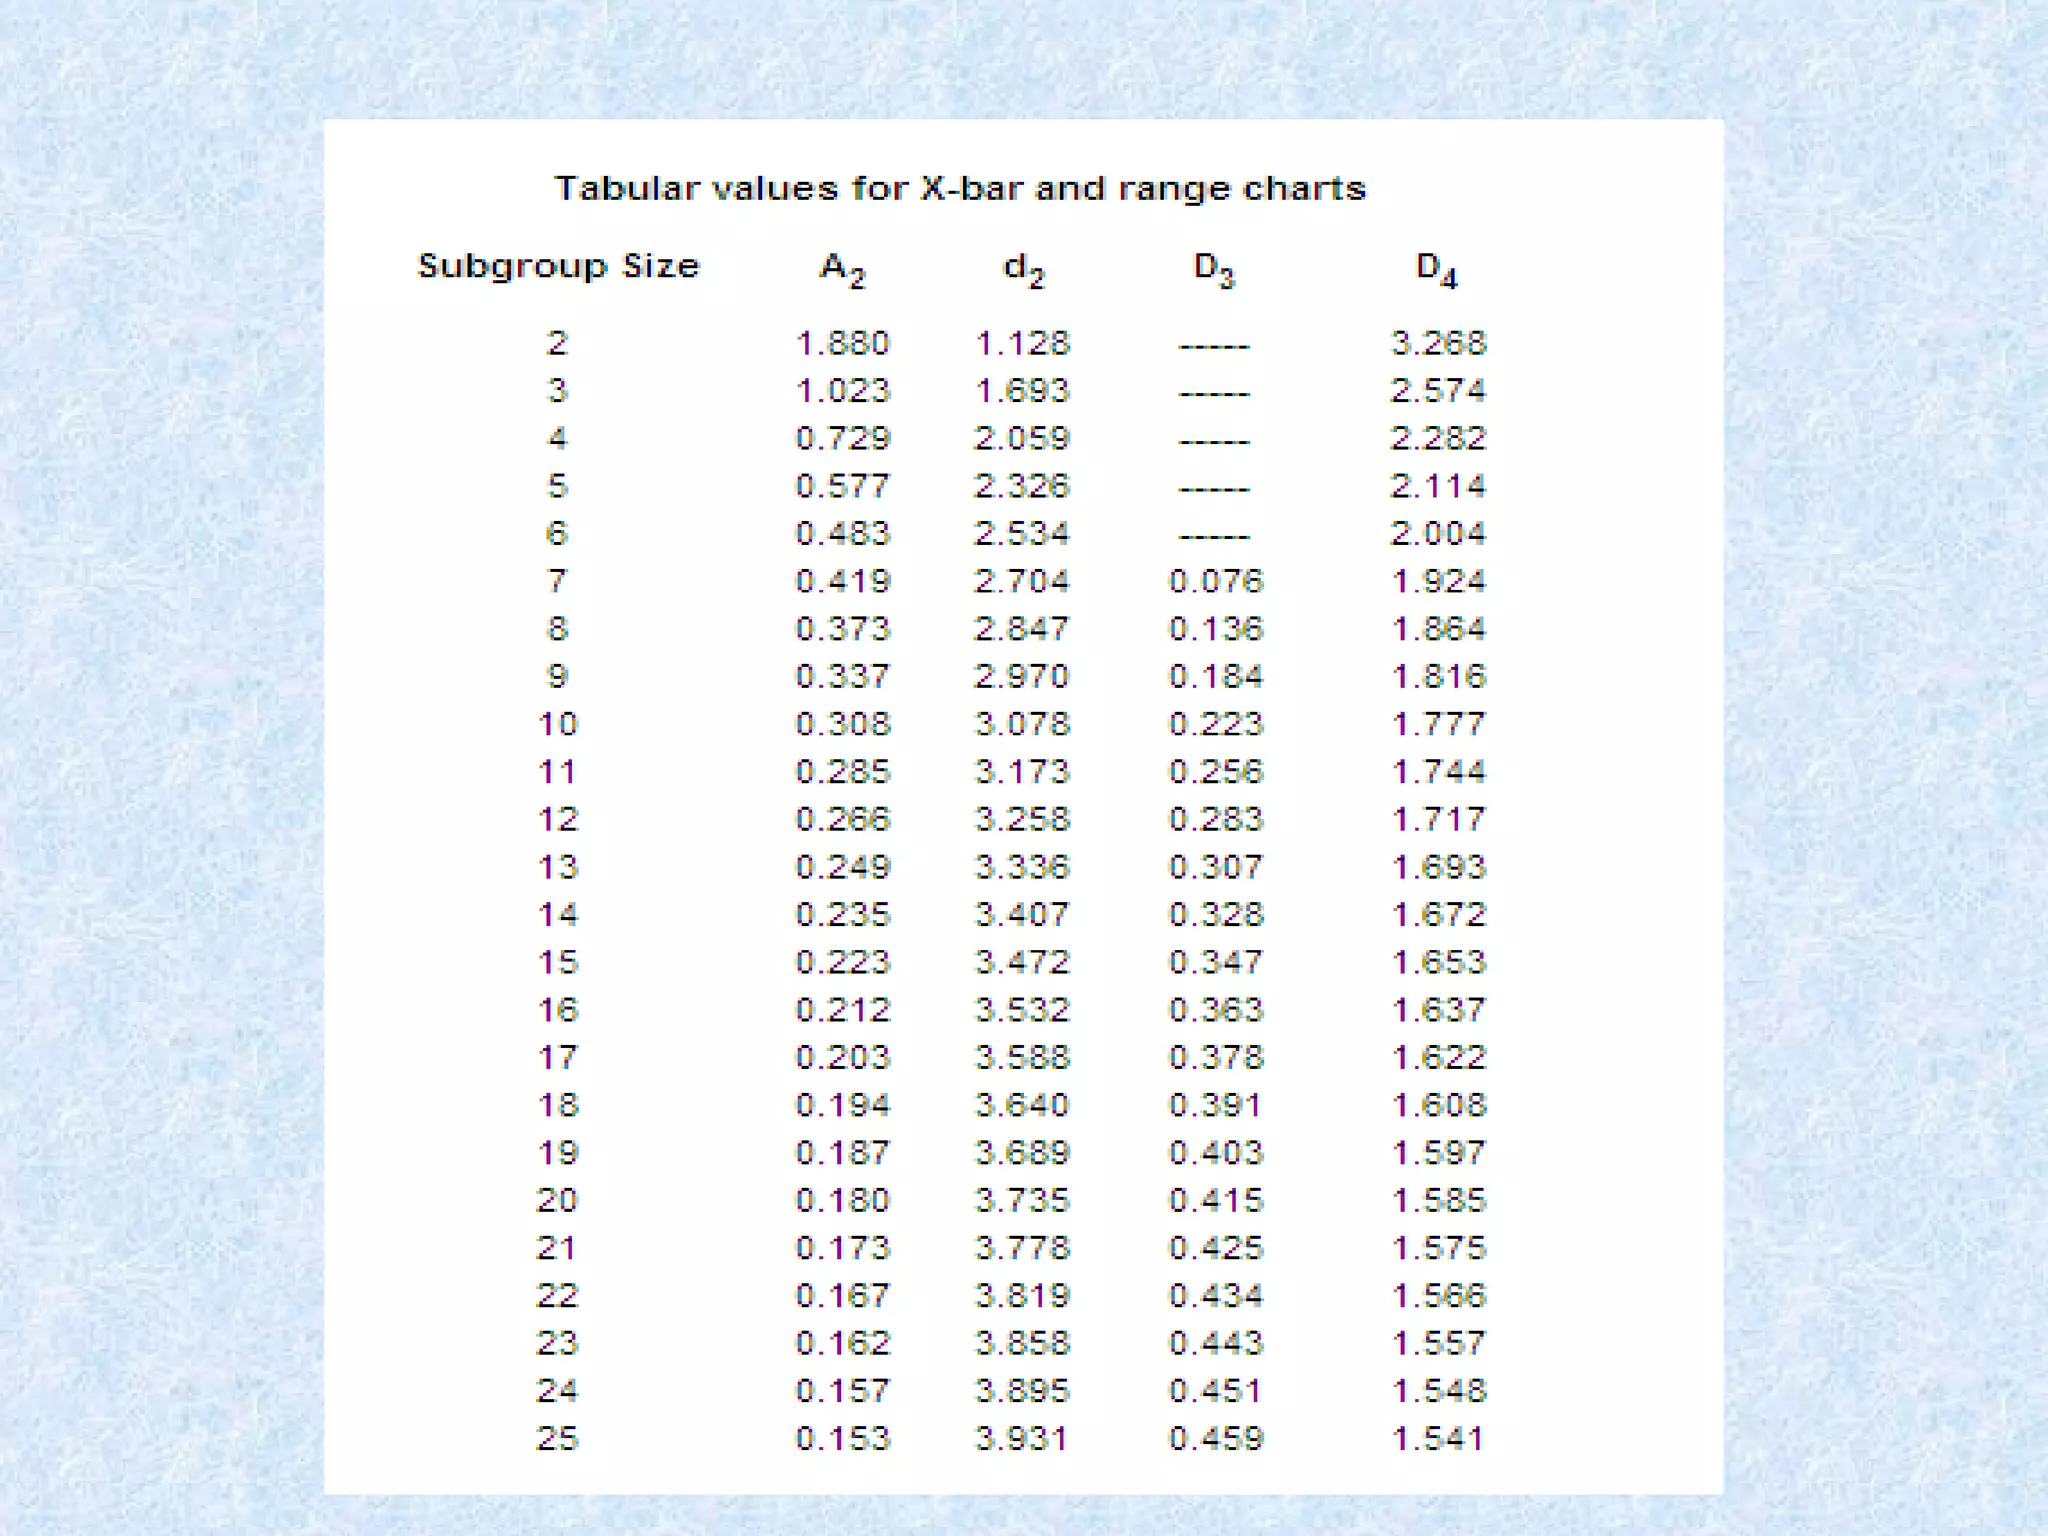
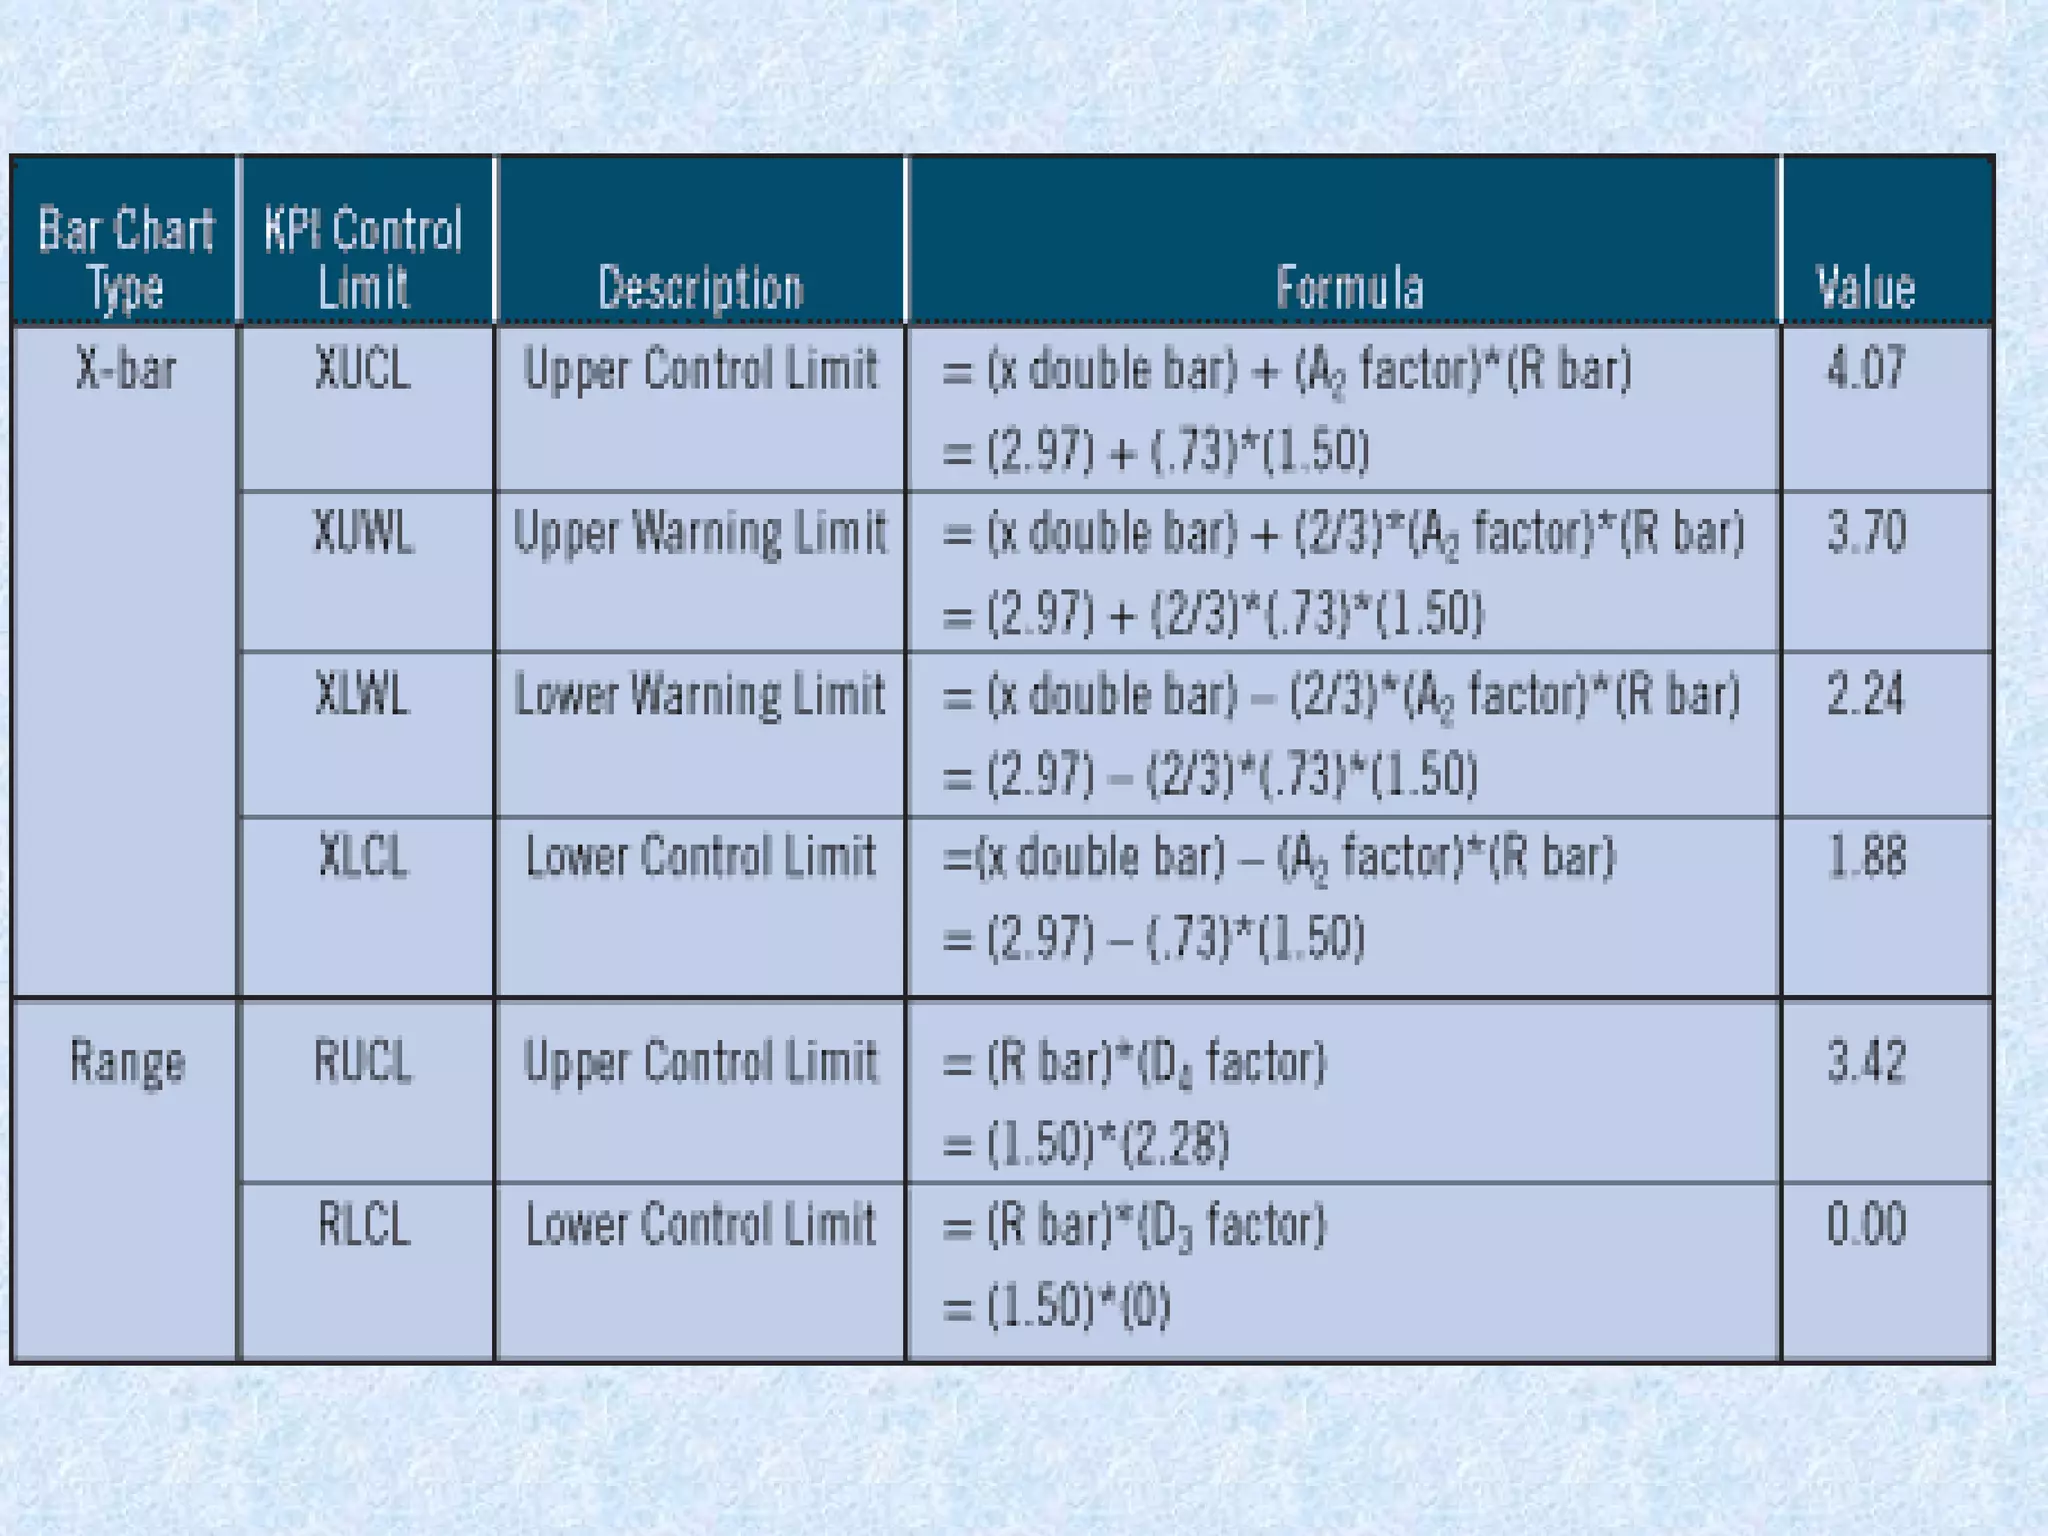
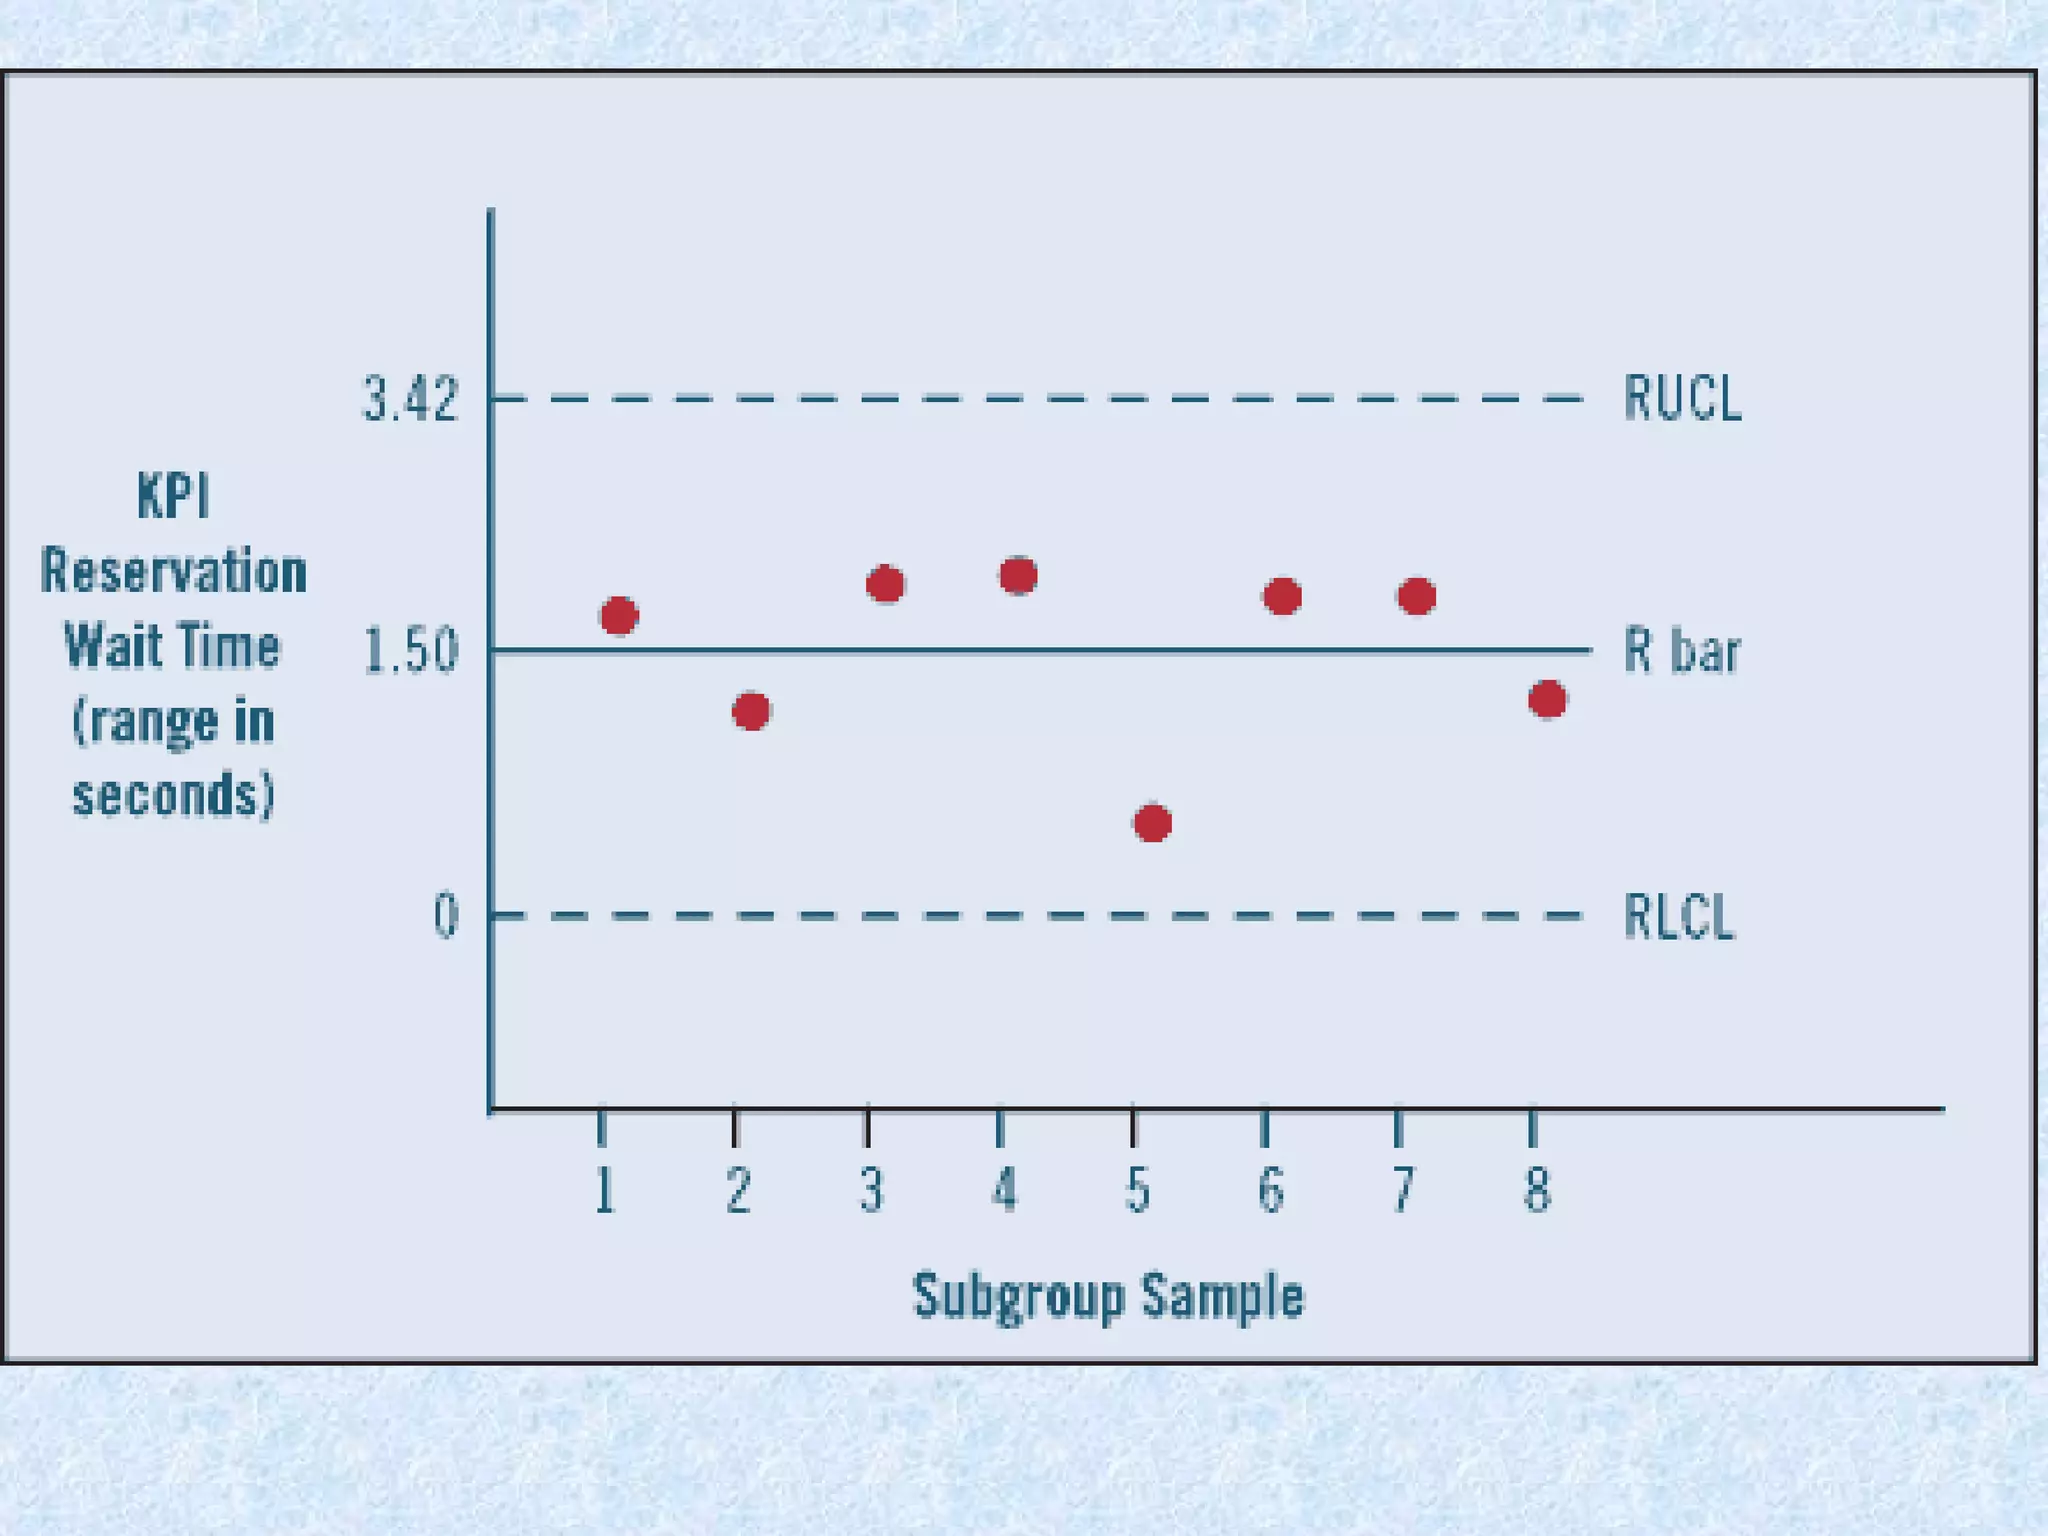
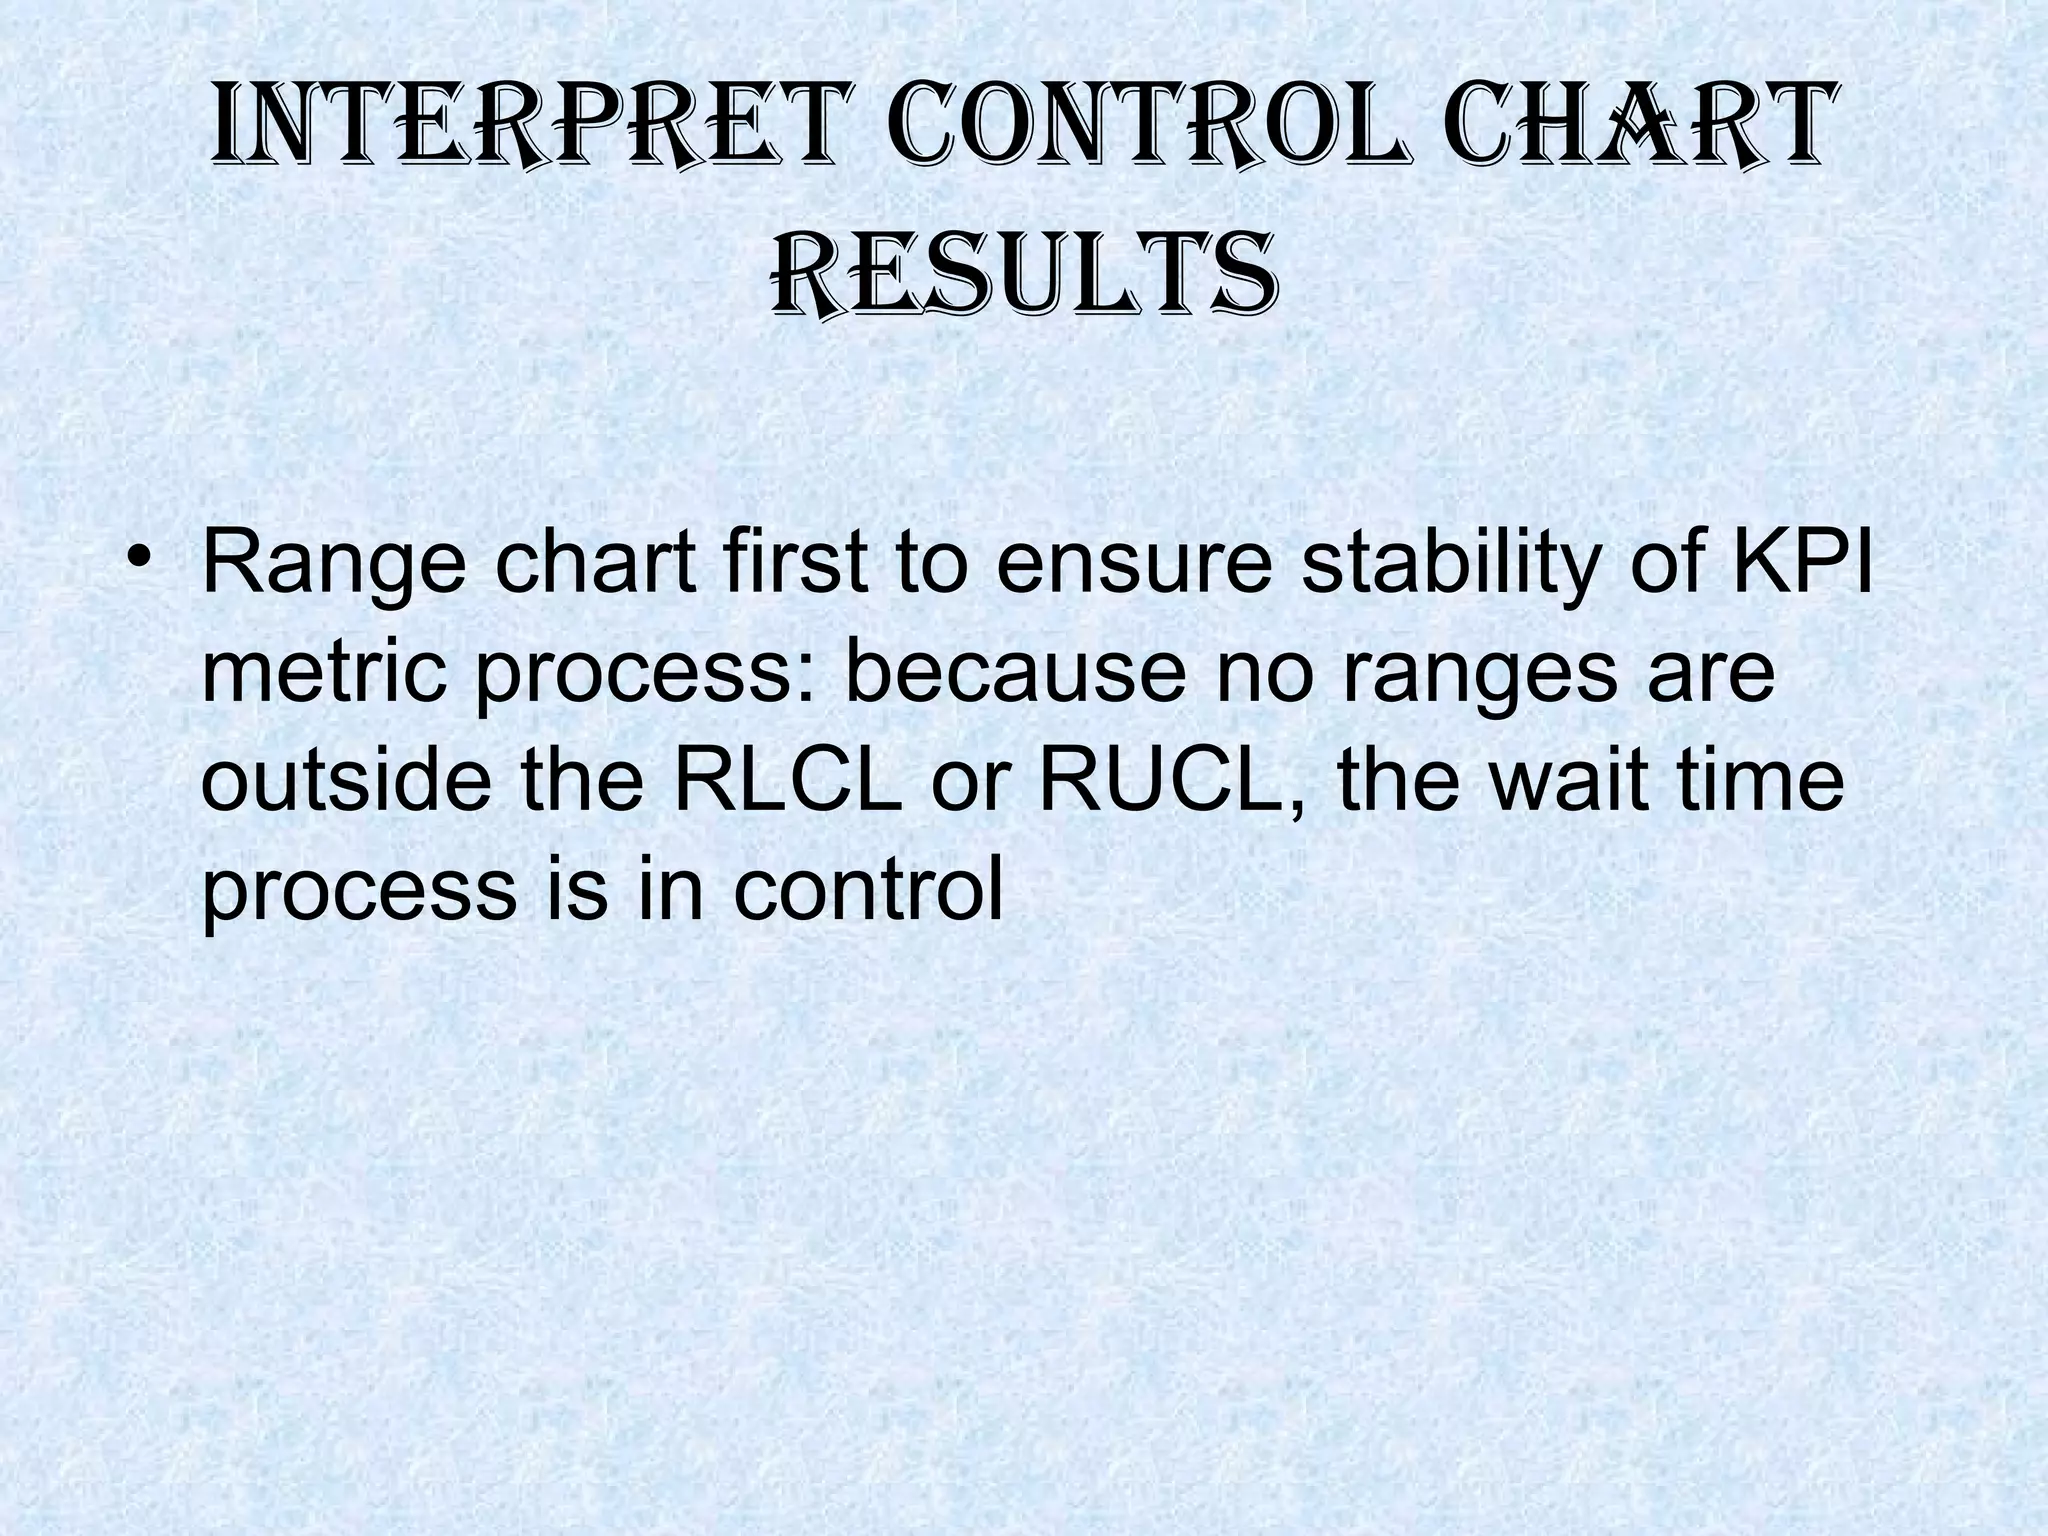
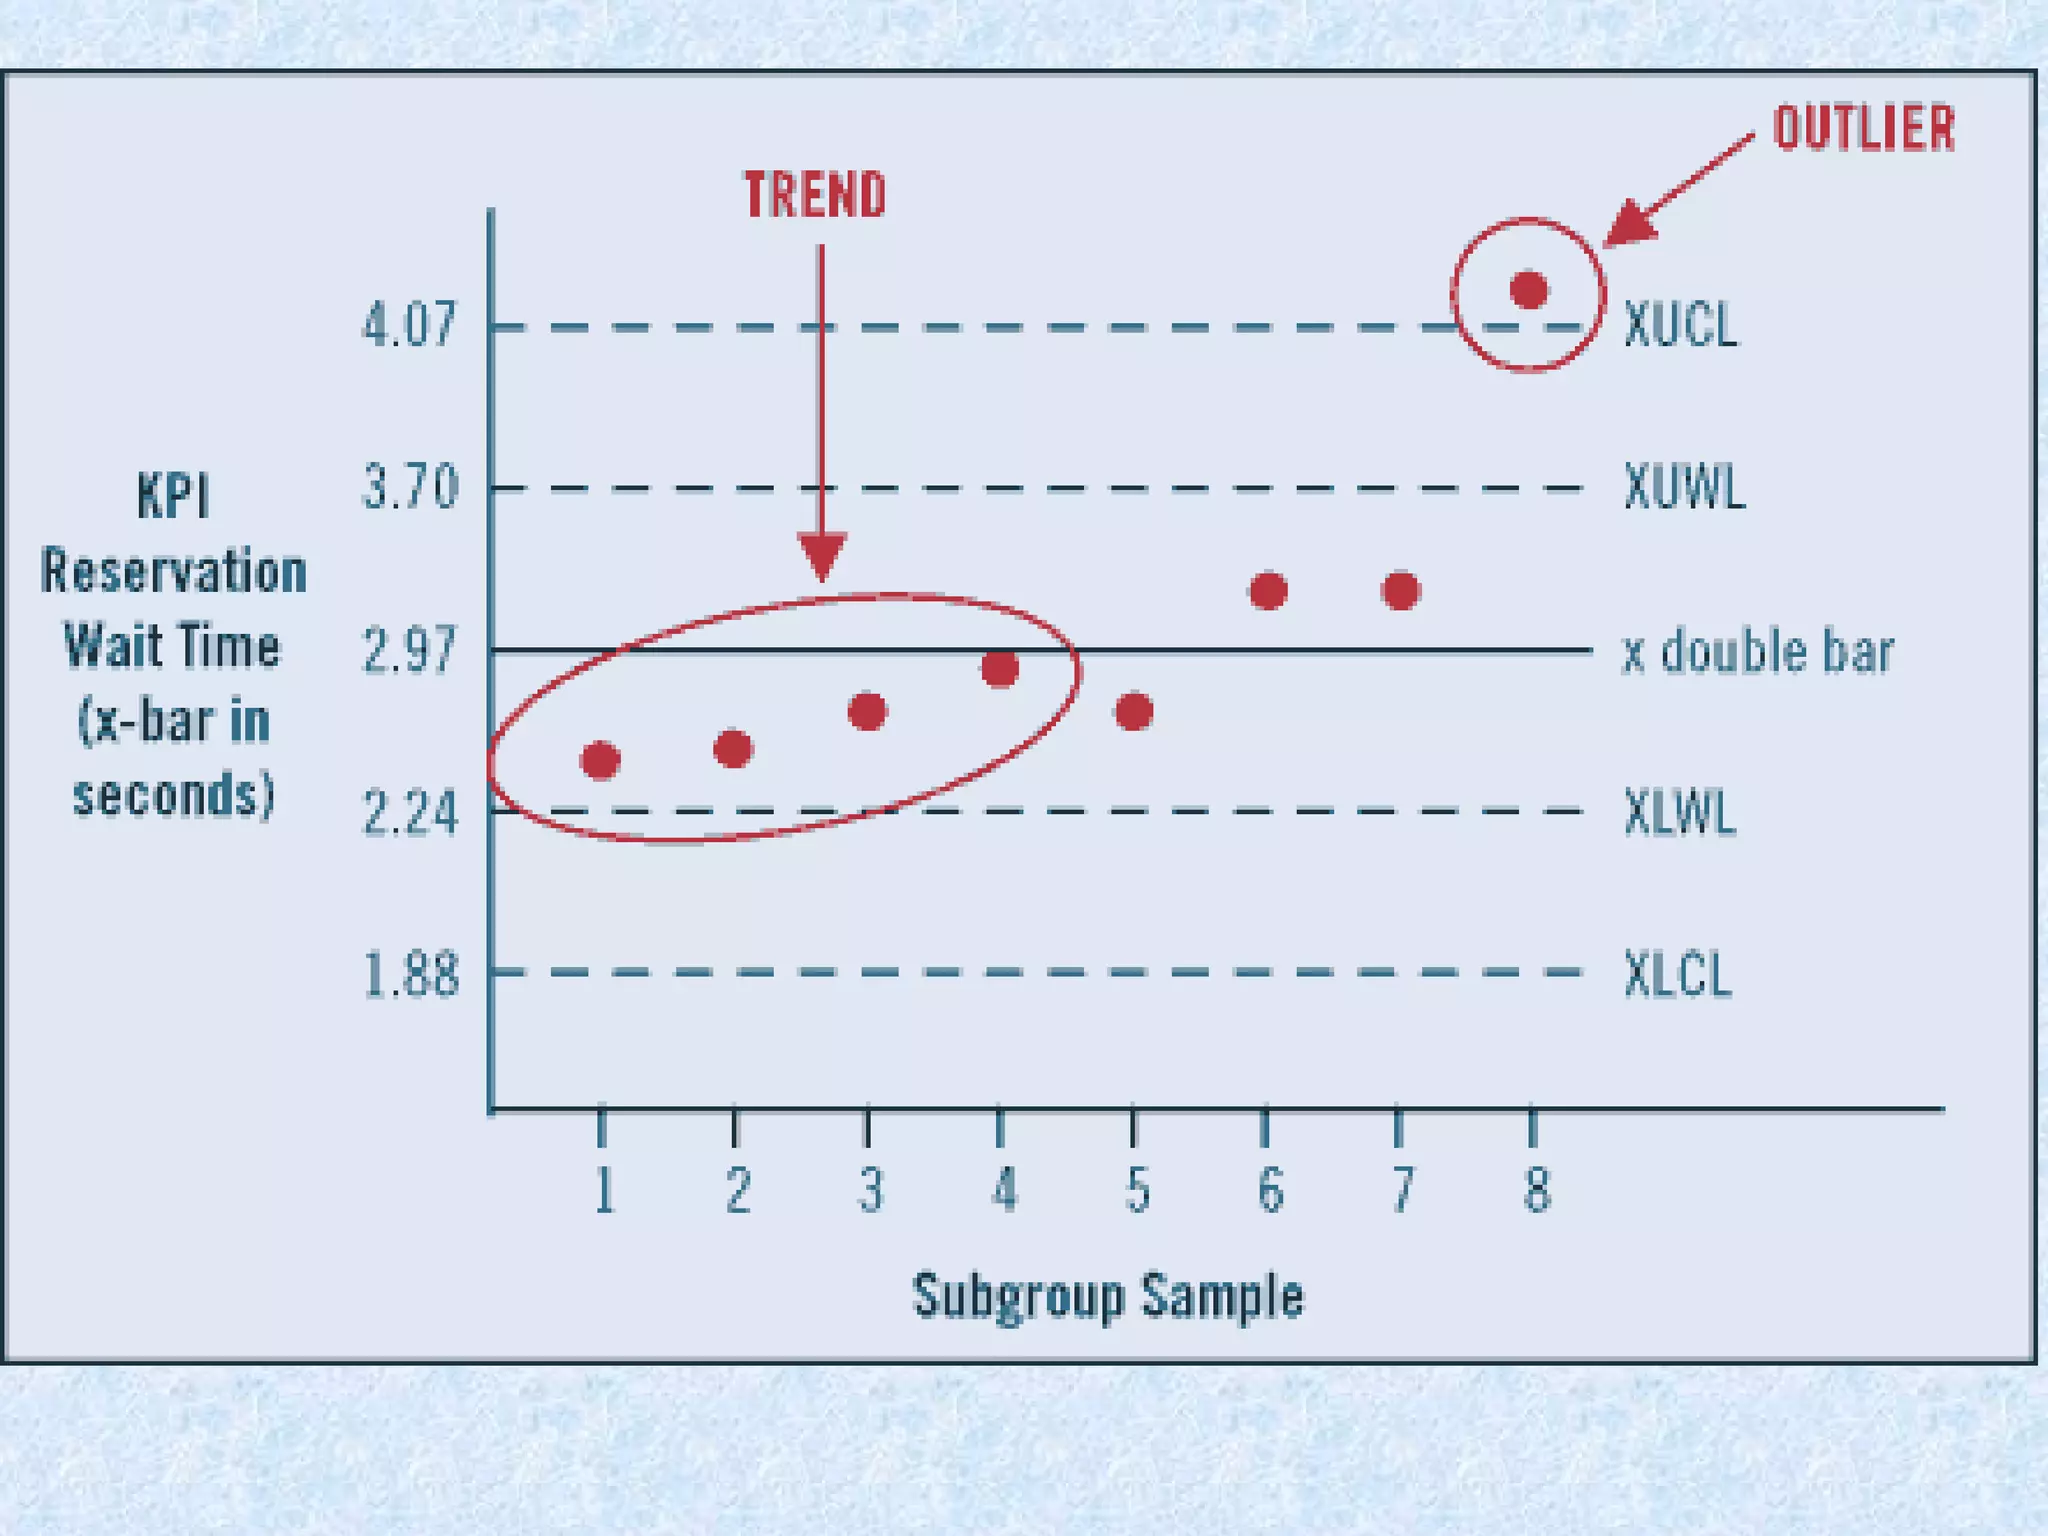
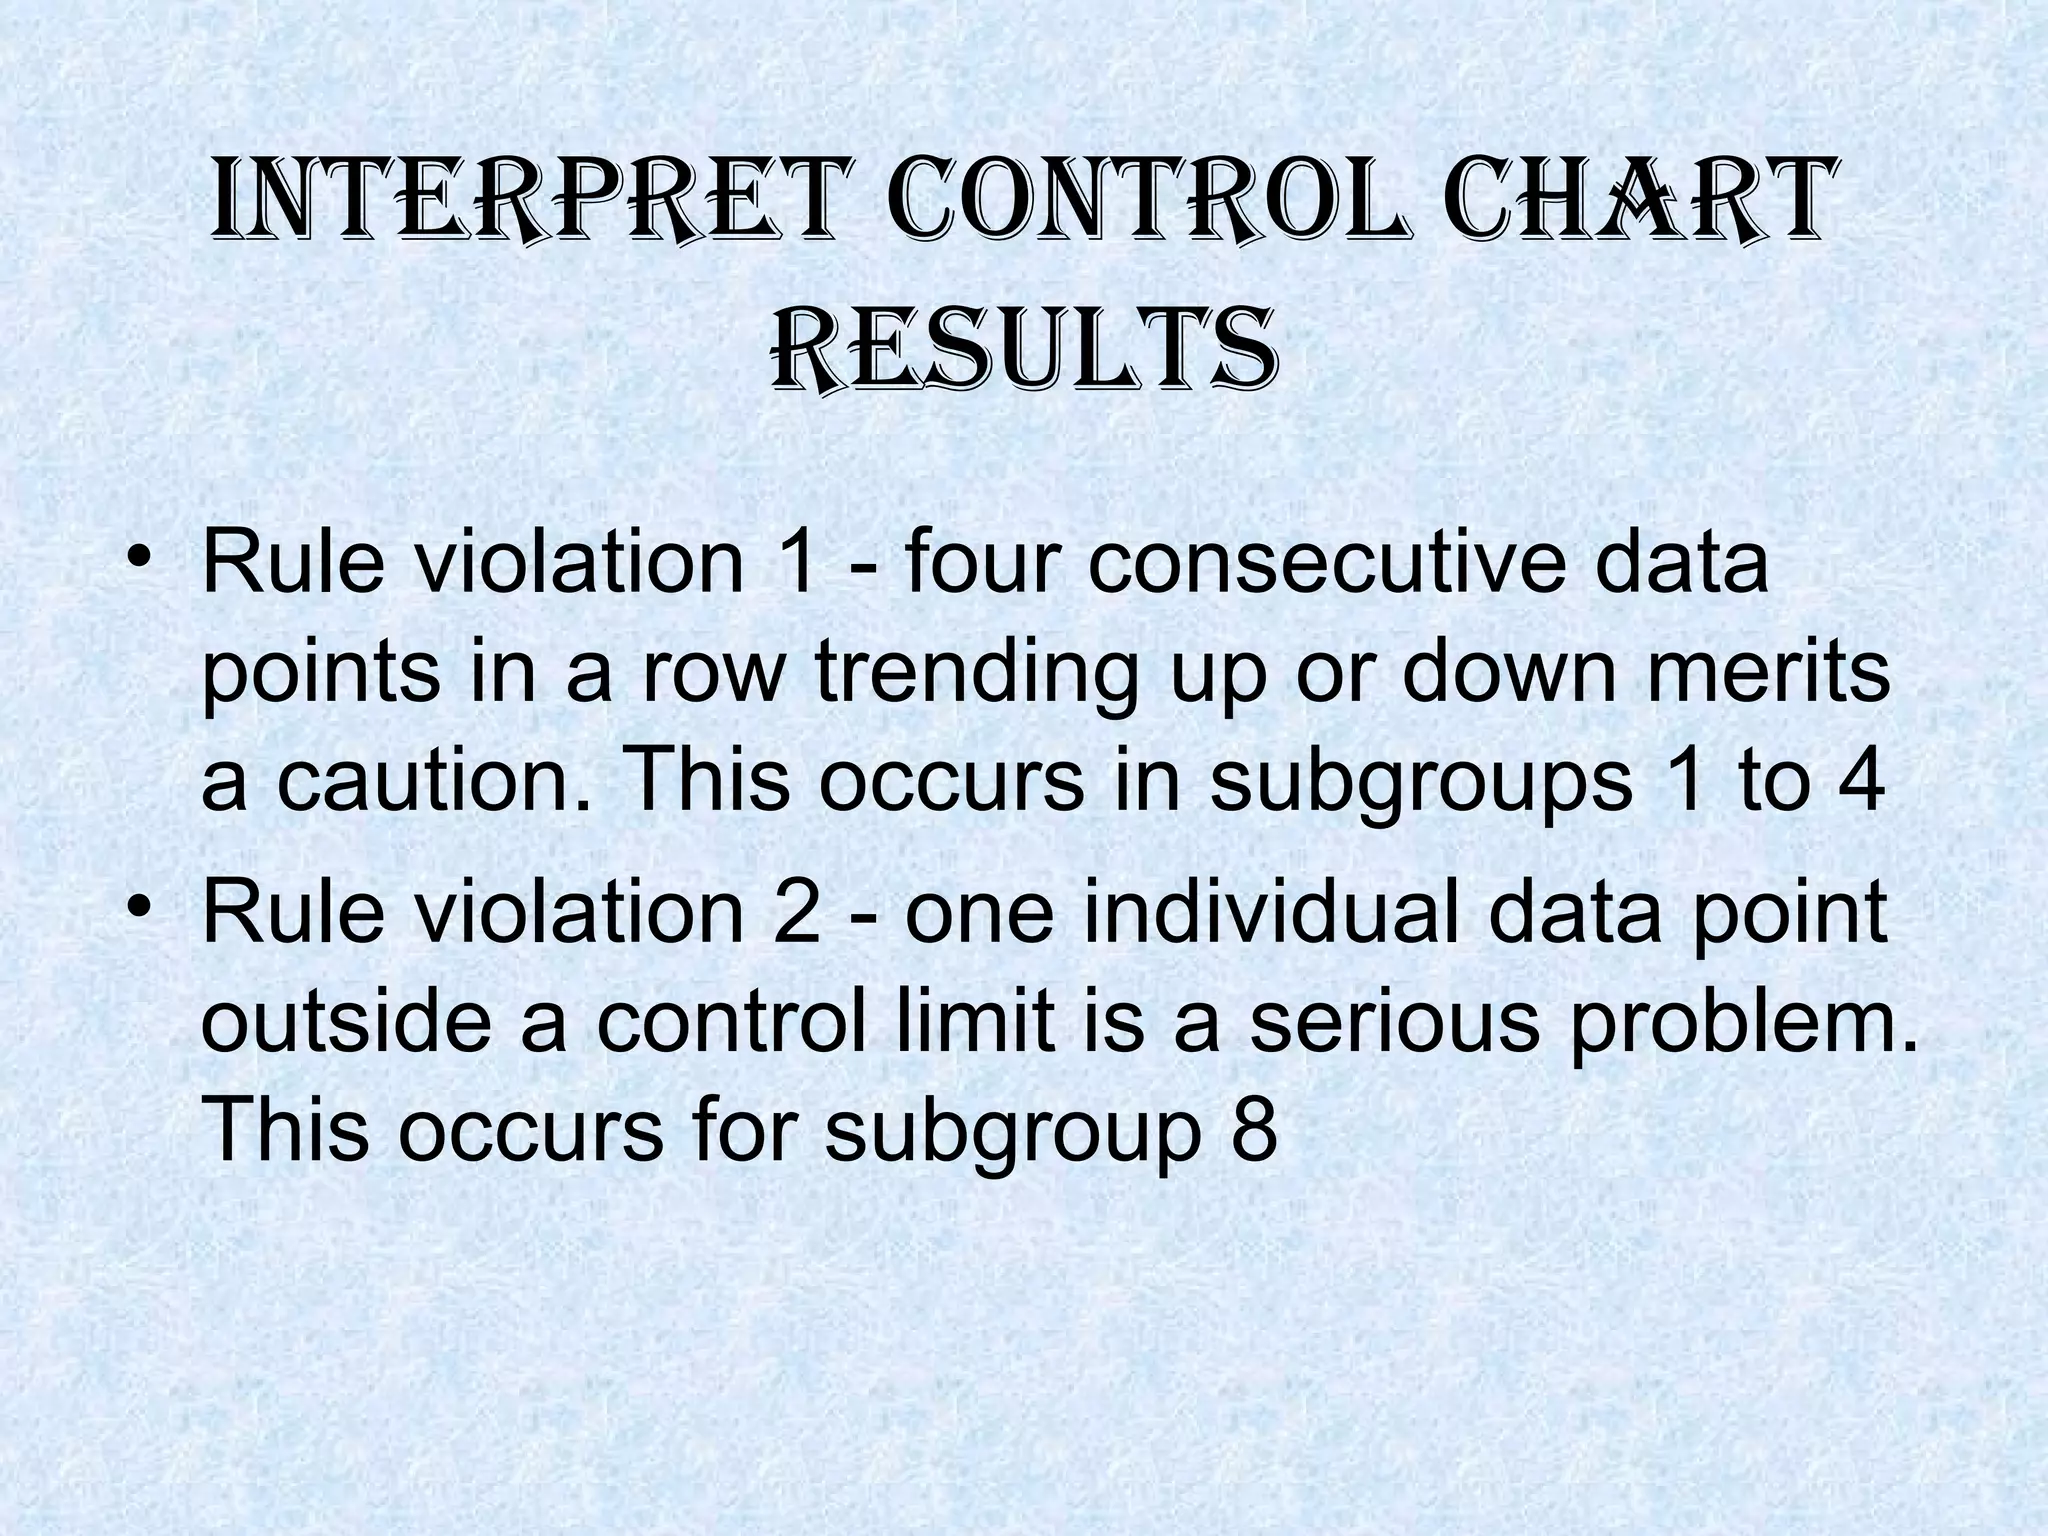
The document presents information on control charts including what they are, their purpose and advantages, types of control charts, and how to construct and interpret them. Control charts are graphical representations that detect variations in a production process and warn if quality characteristics depart from specified tolerance limits. The main types discussed are X-bar and R-bar charts, with X-bar charts showing changes in the process average and R-bar charts controlling process variability. A case study example on using control charts in the hospitality industry is also included.

![Control Charts[1]](https://cdn.slidesharecdn.com/ss_thumbnails/controlcharts1-1226081330857138-9-thumbnail.jpg?width=640&height=640&fit=bounds)


![Control Charts[1]](https://cdn.slidesharecdn.com/ss_thumbnails/controlcharts1-1226961283054520-8-thumbnail.jpg?width=640&height=640&fit=bounds)


![Control charts[1]](https://cdn.slidesharecdn.com/ss_thumbnails/controlcharts1-100924110931-phpapp01-thumbnail.jpg?width=640&height=640&fit=bounds)


