Downloaded 222 times

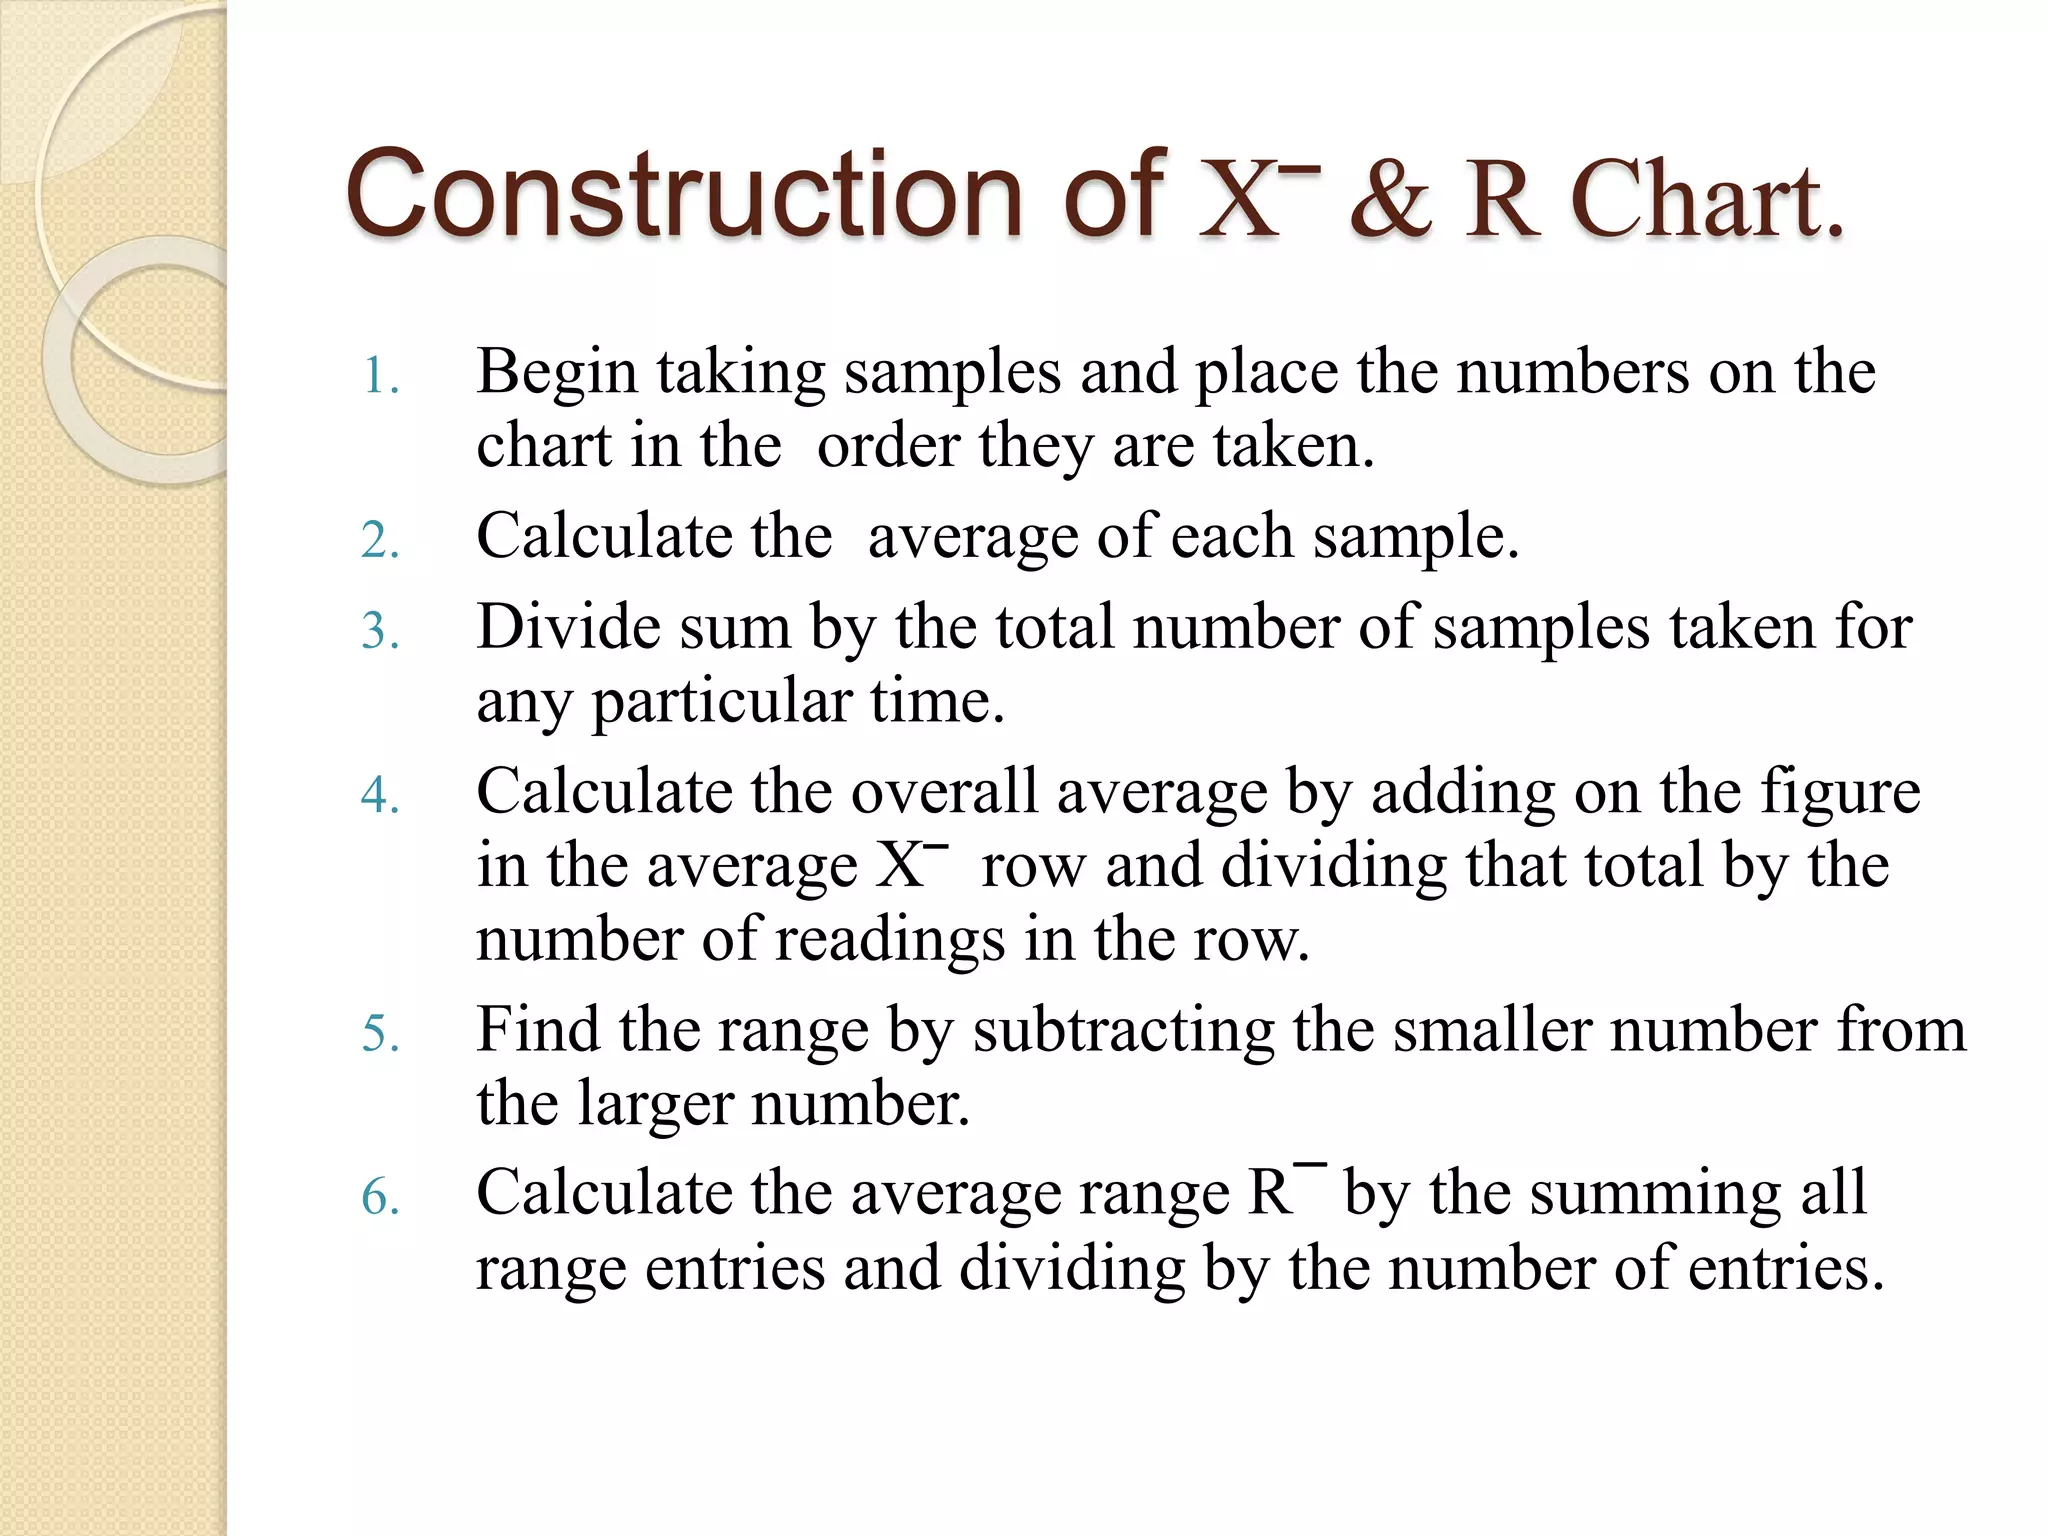
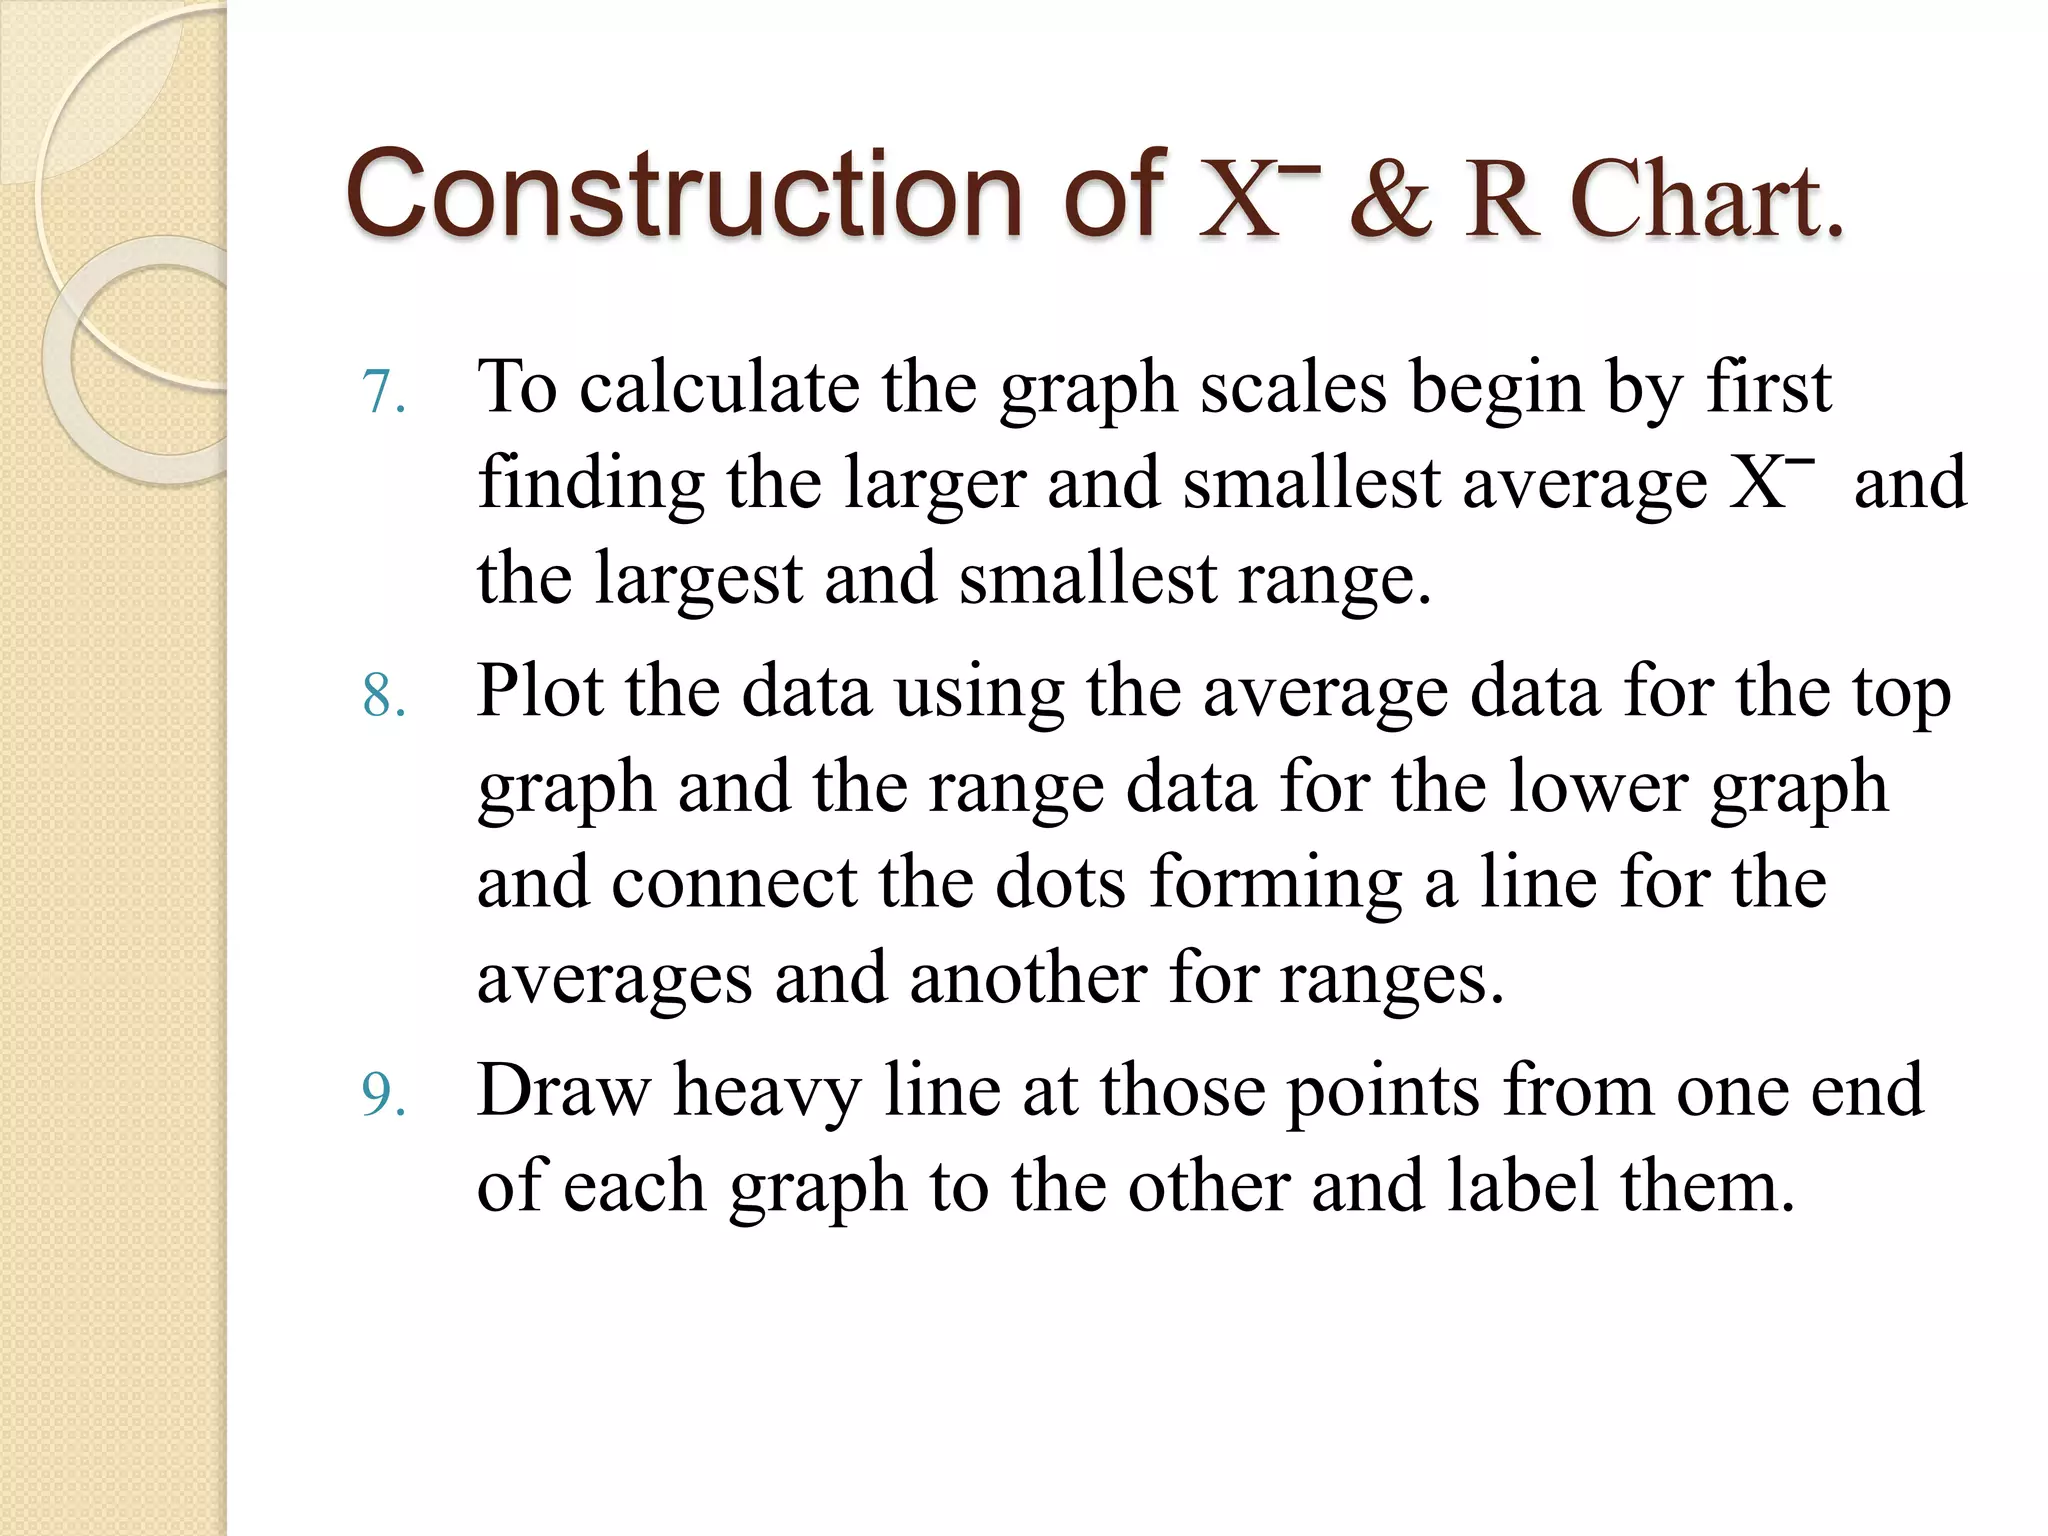
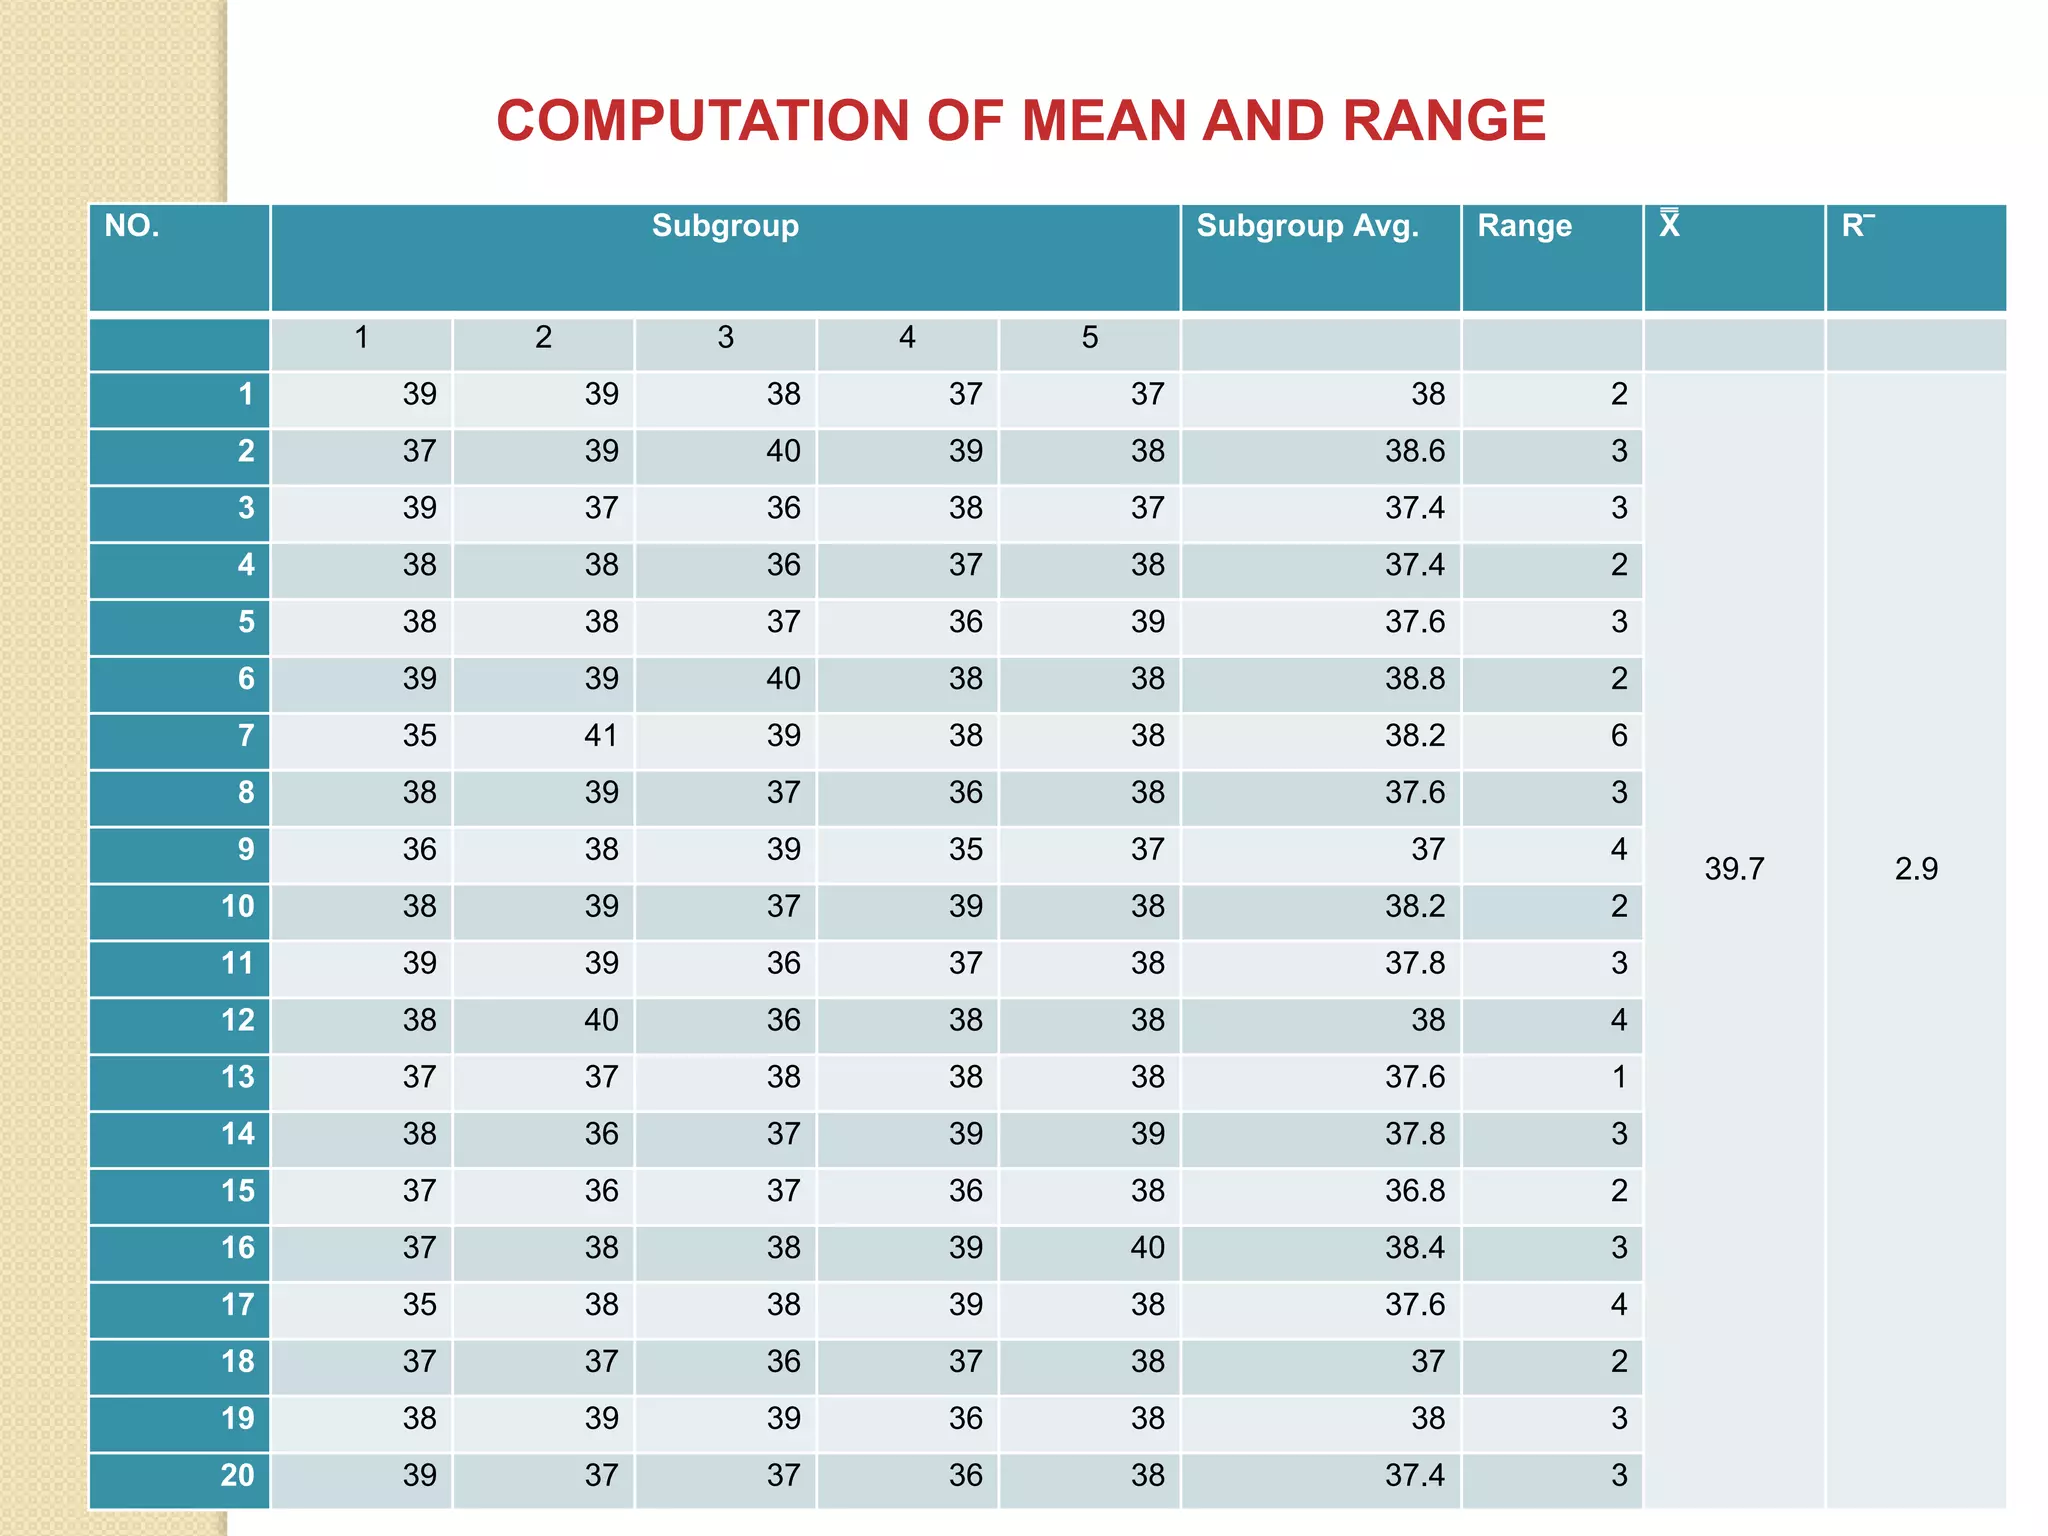
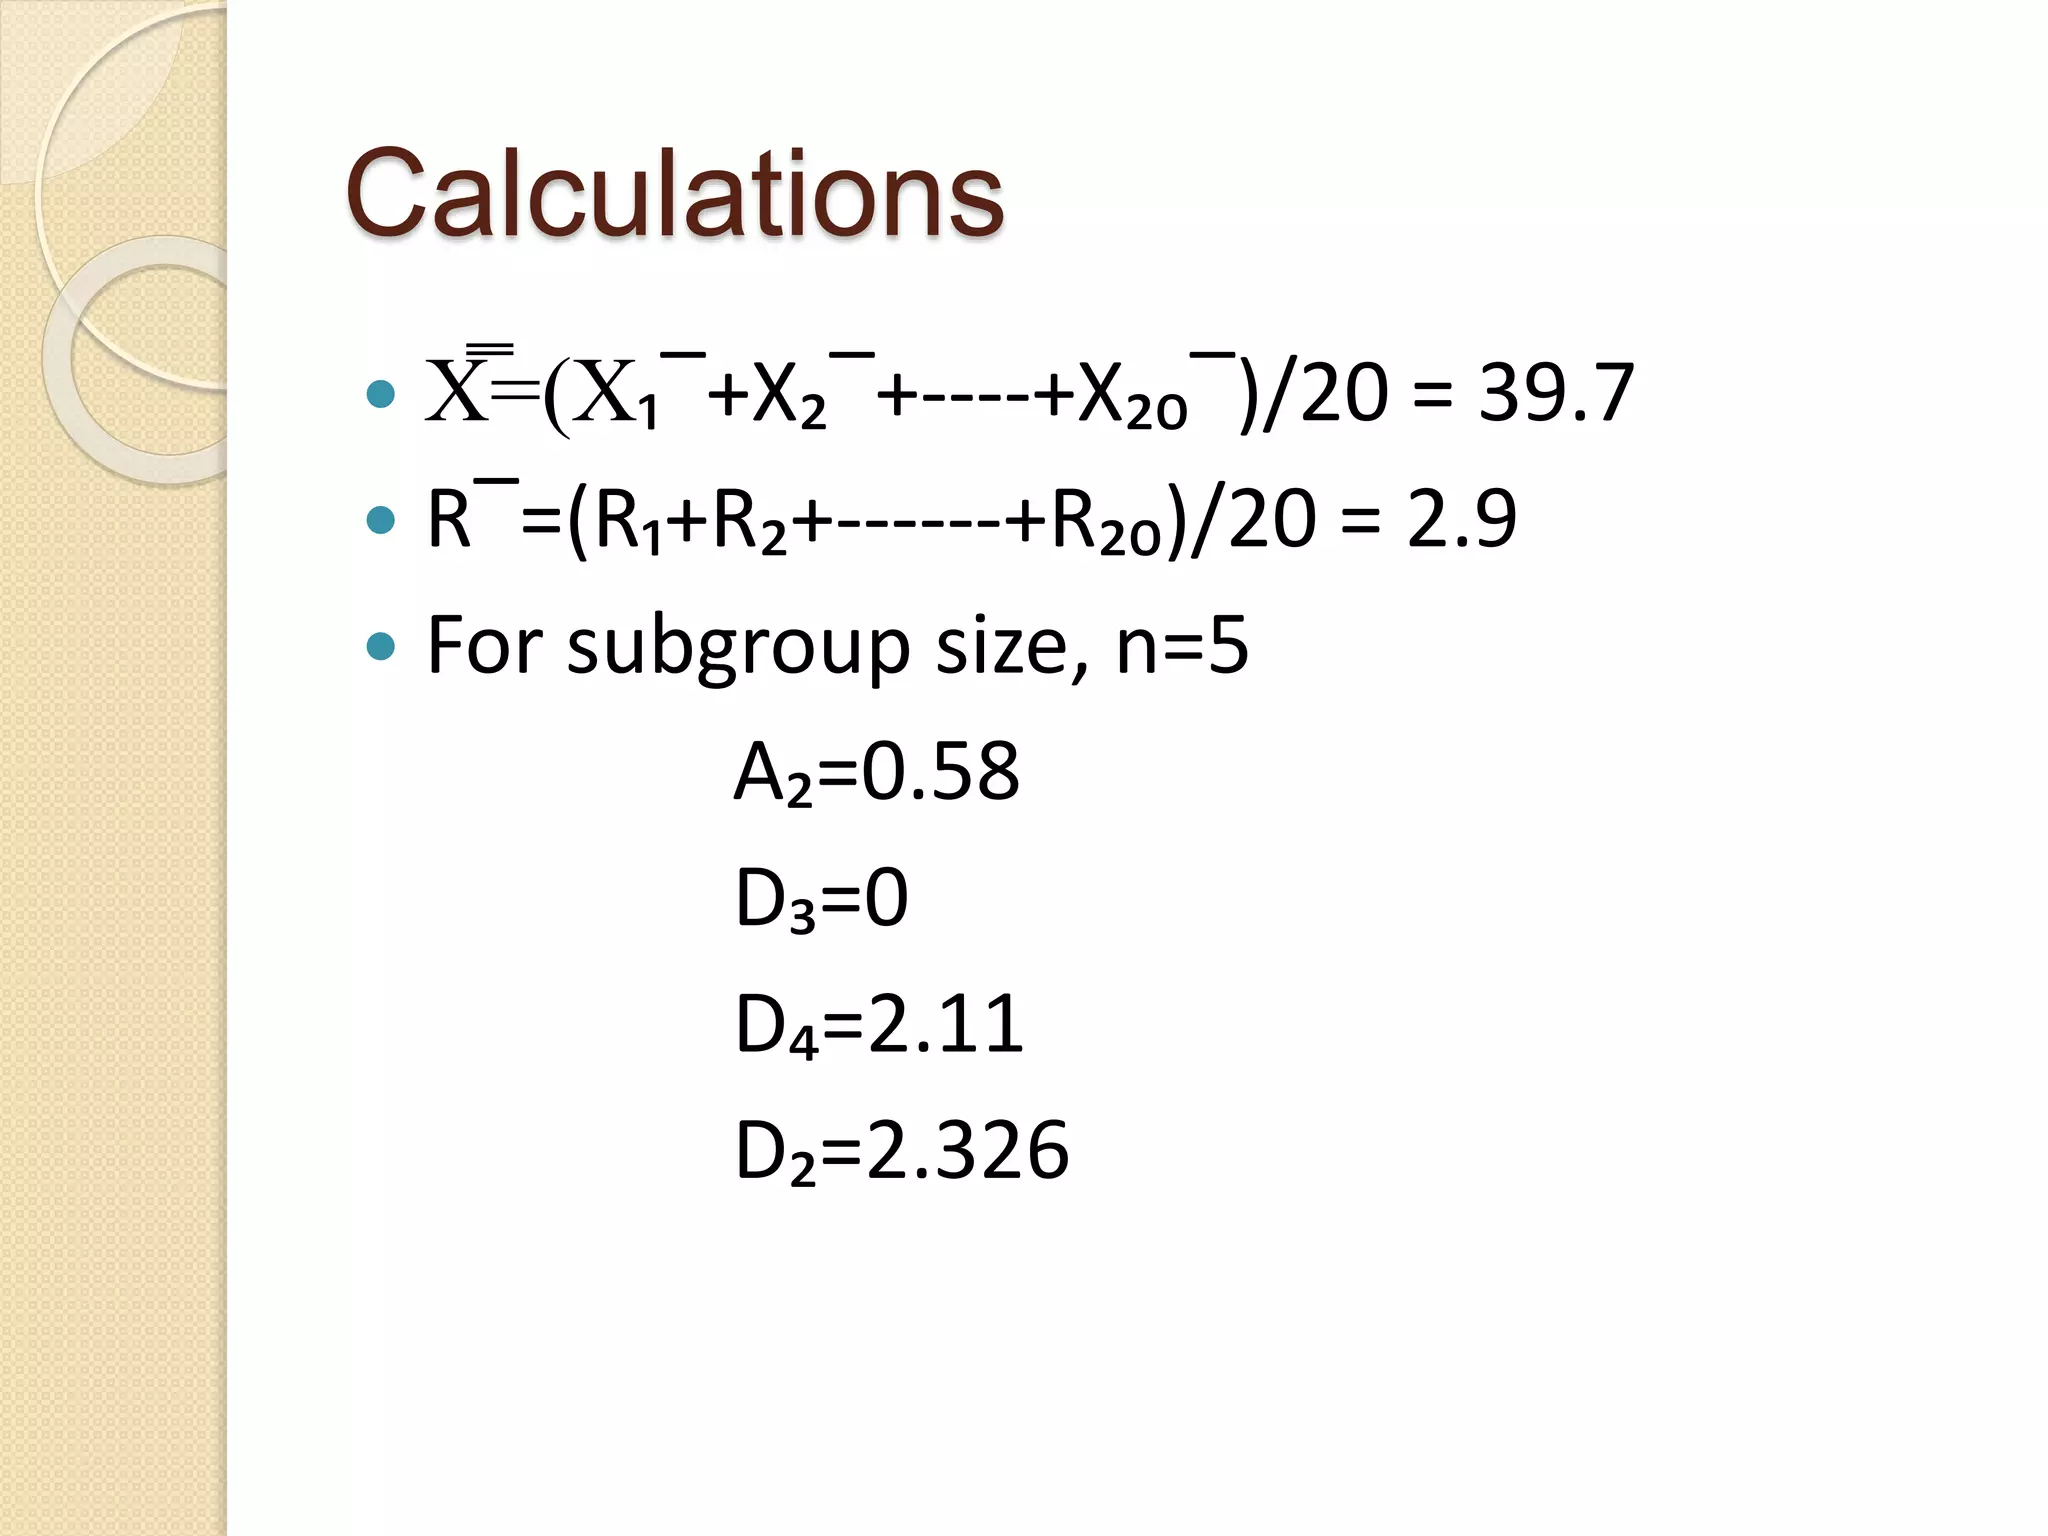
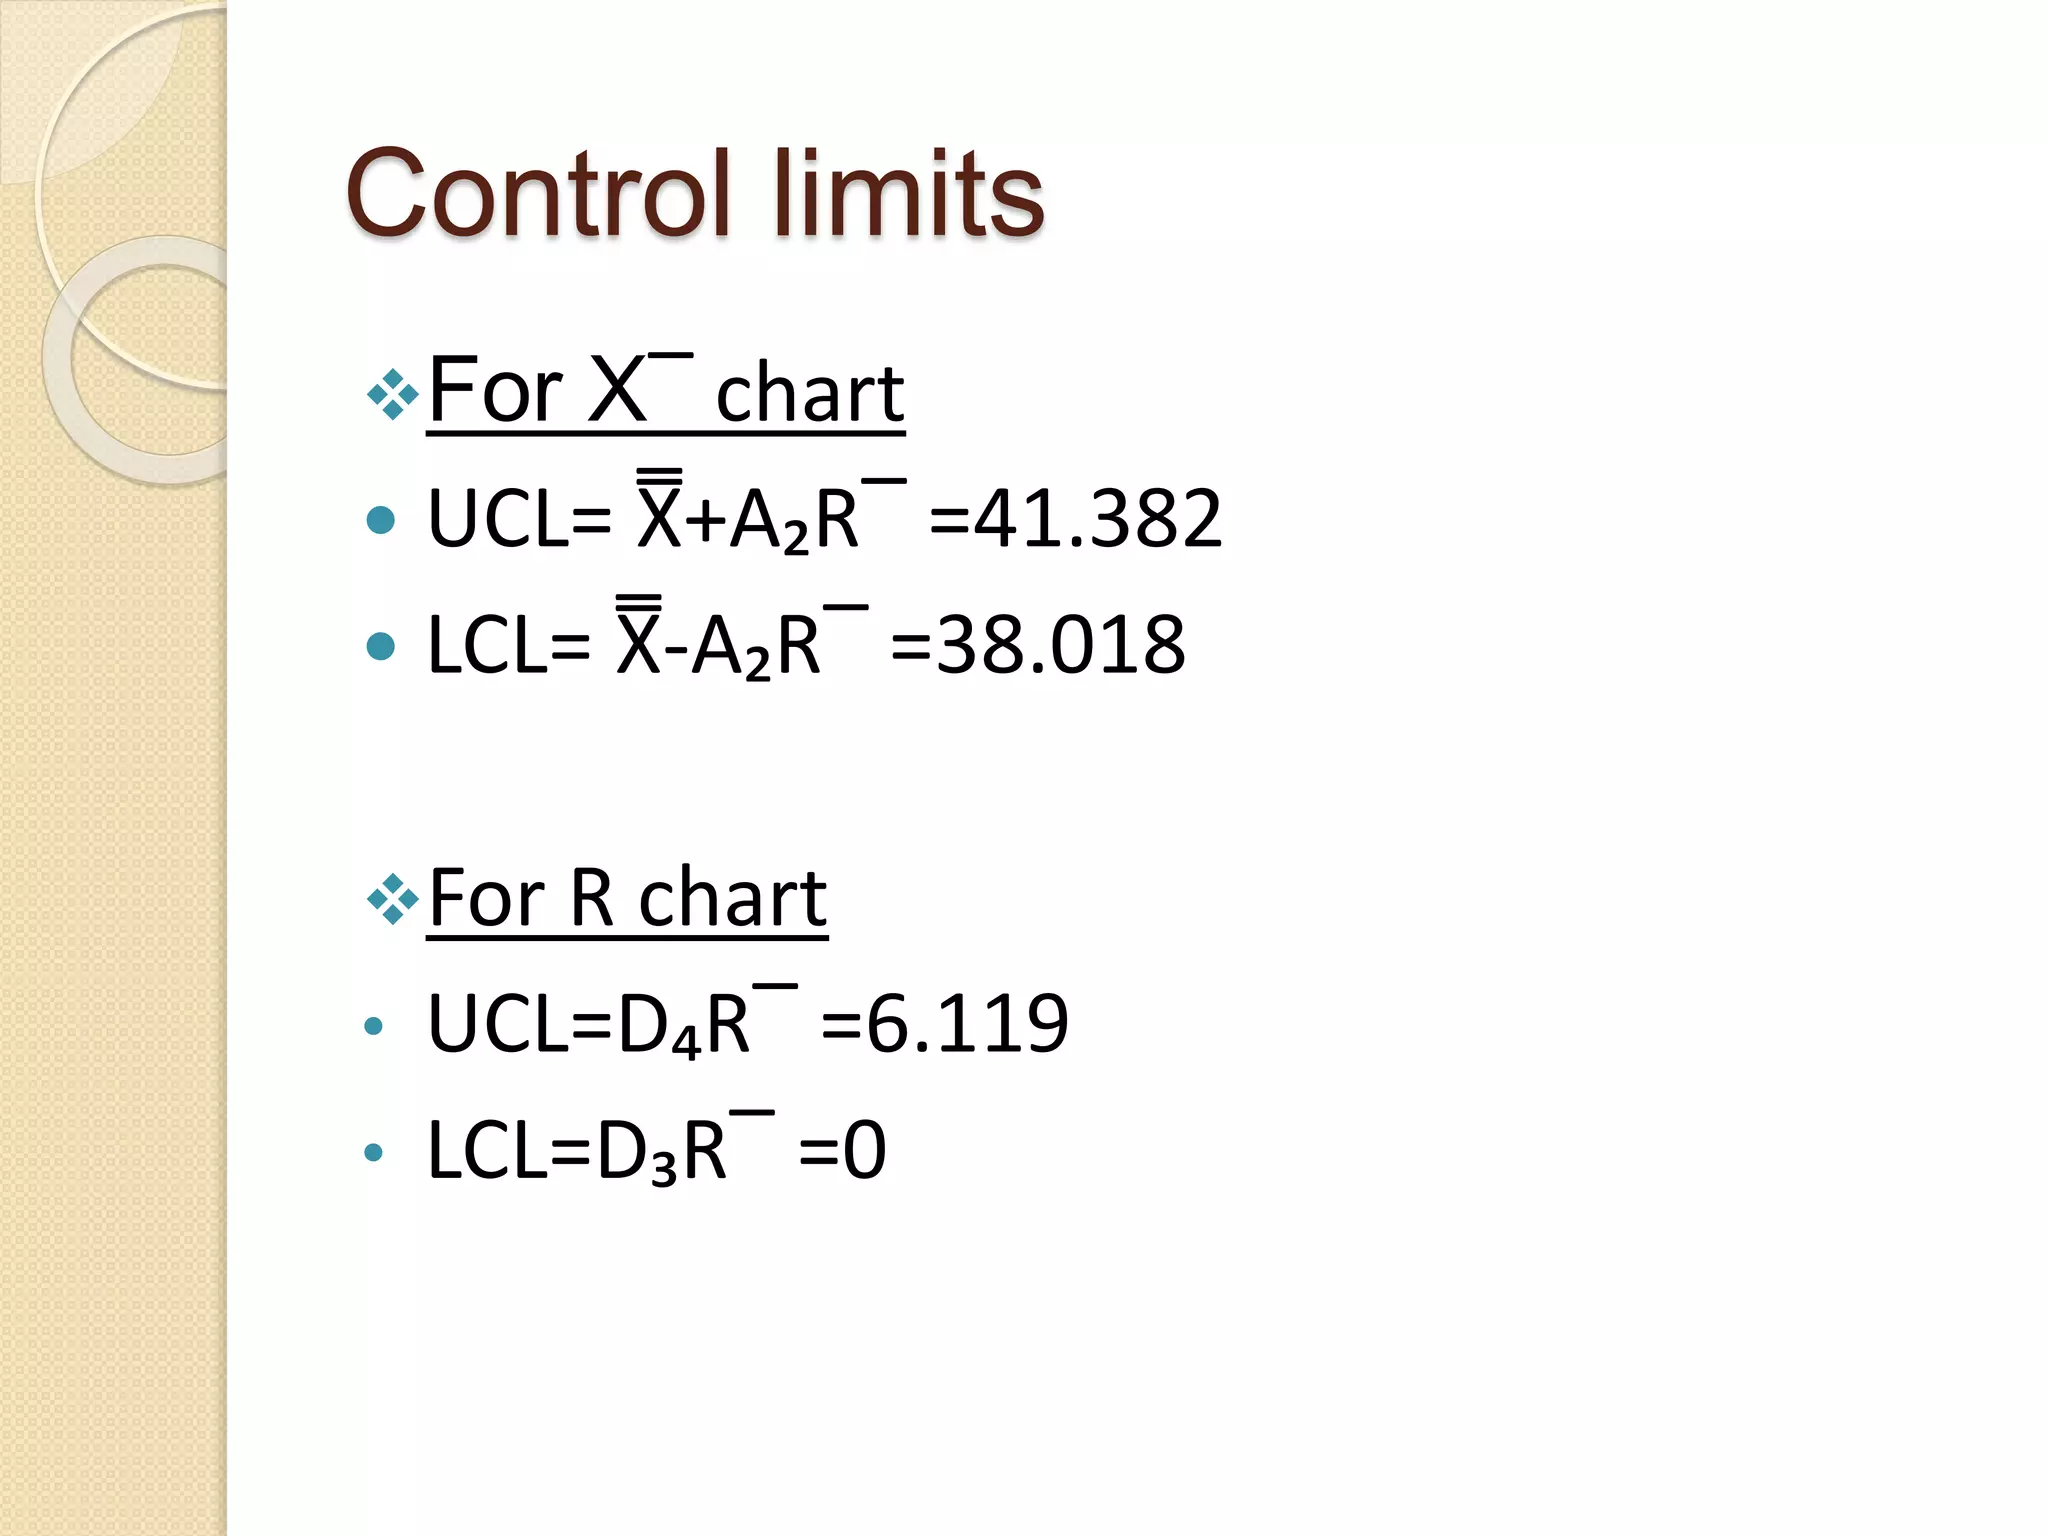
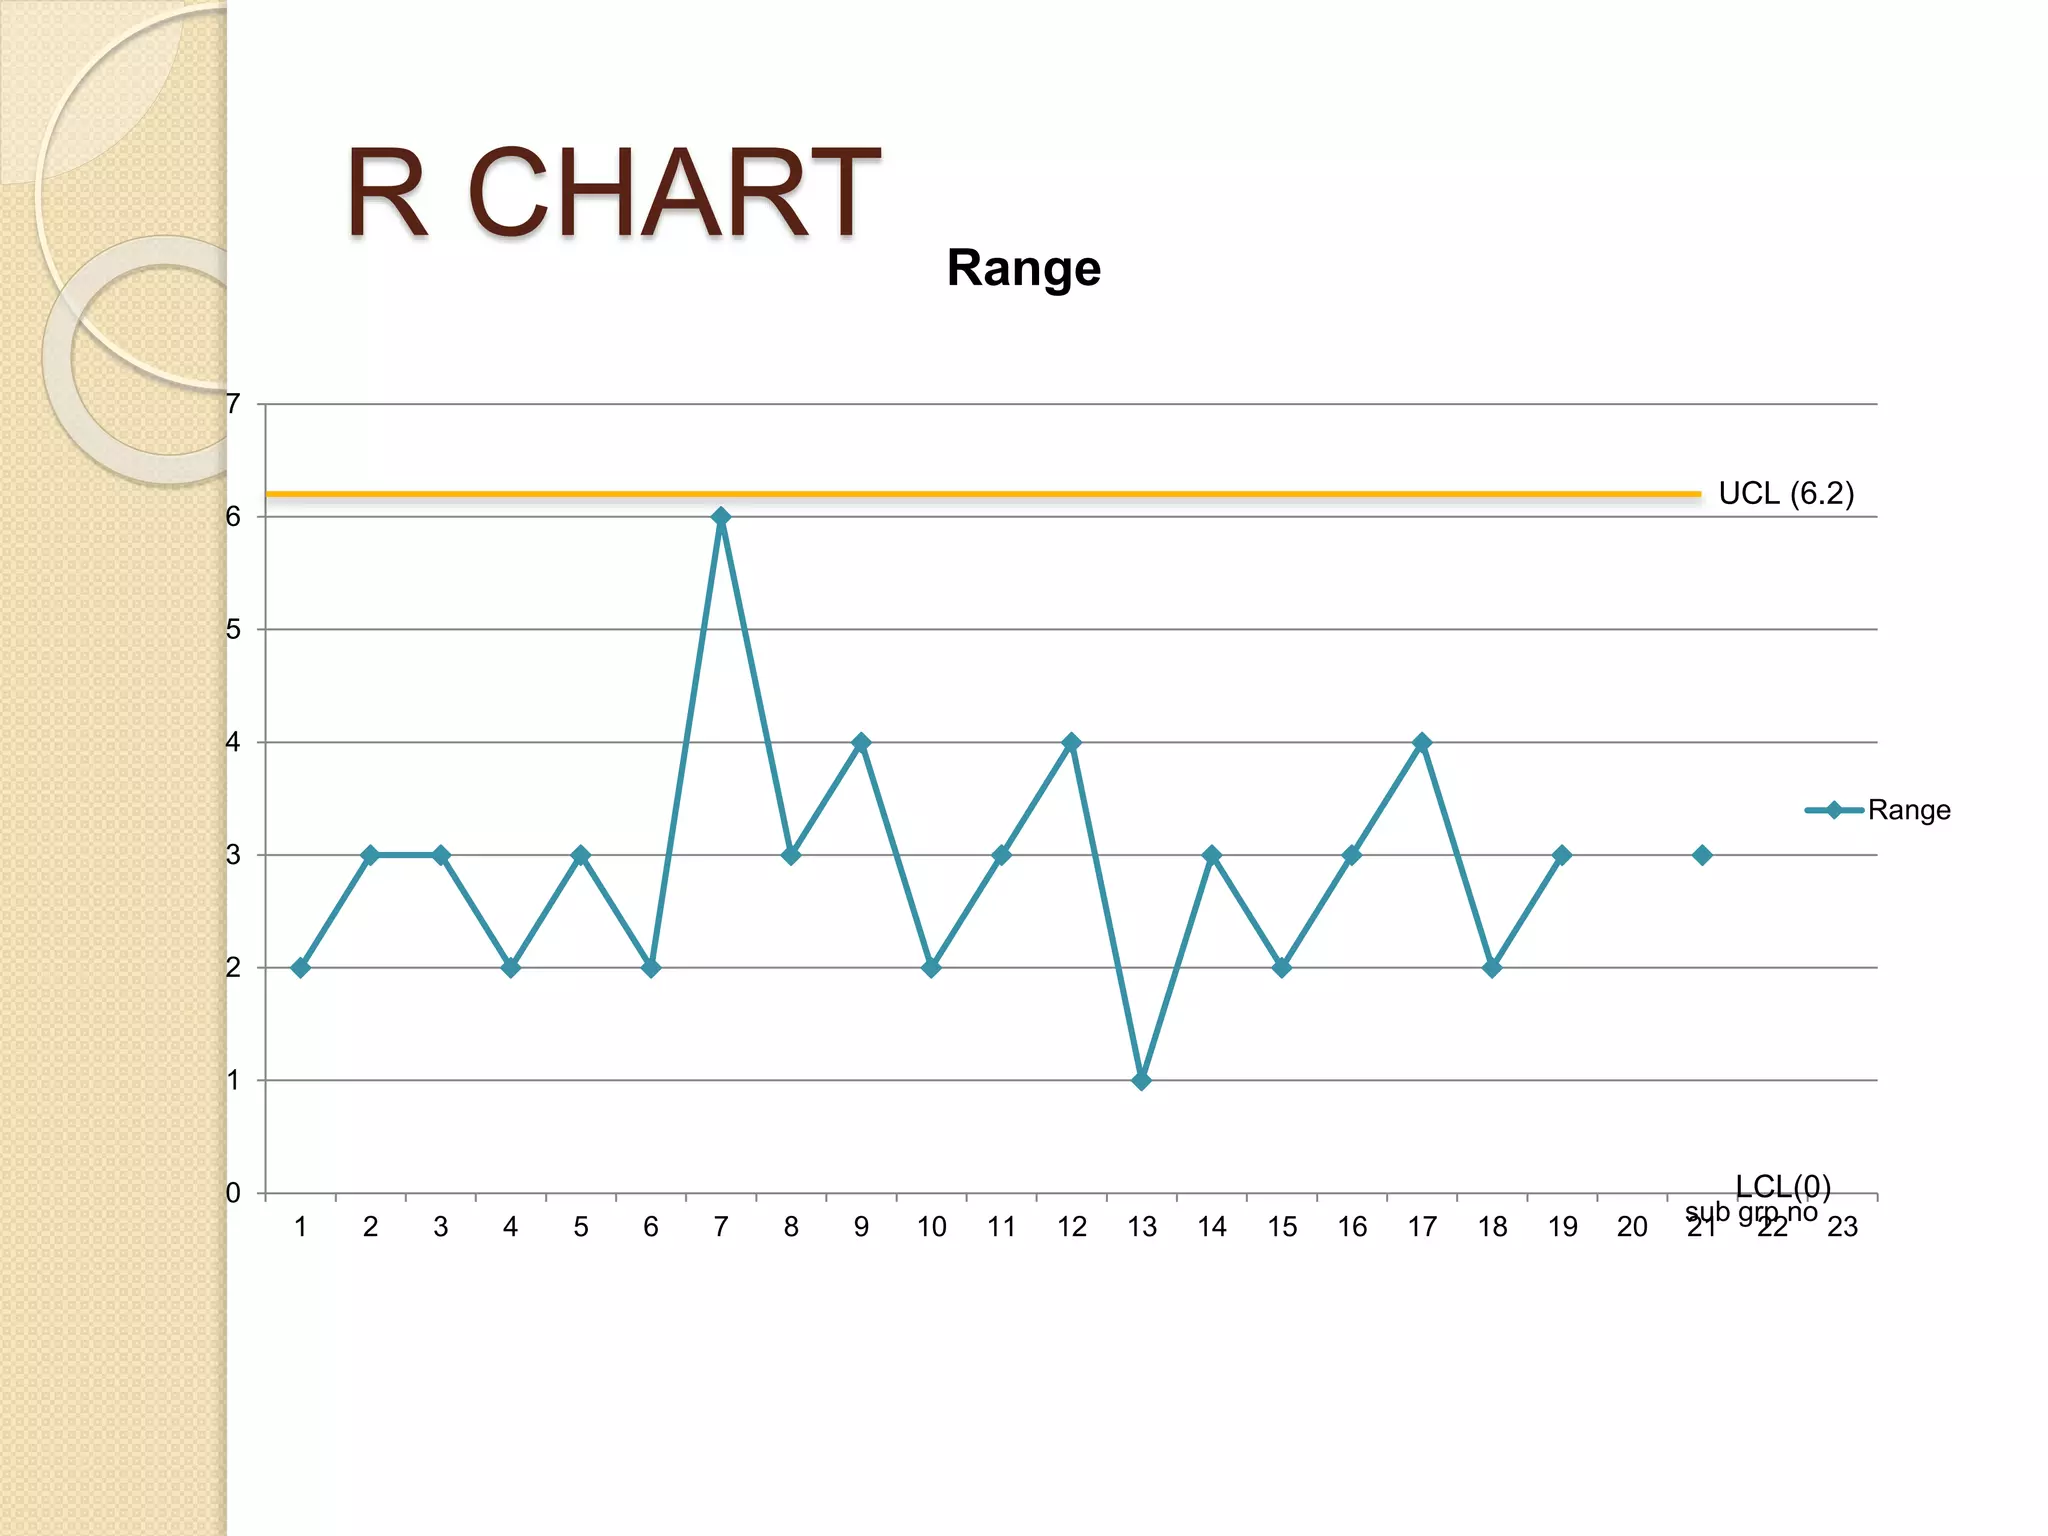
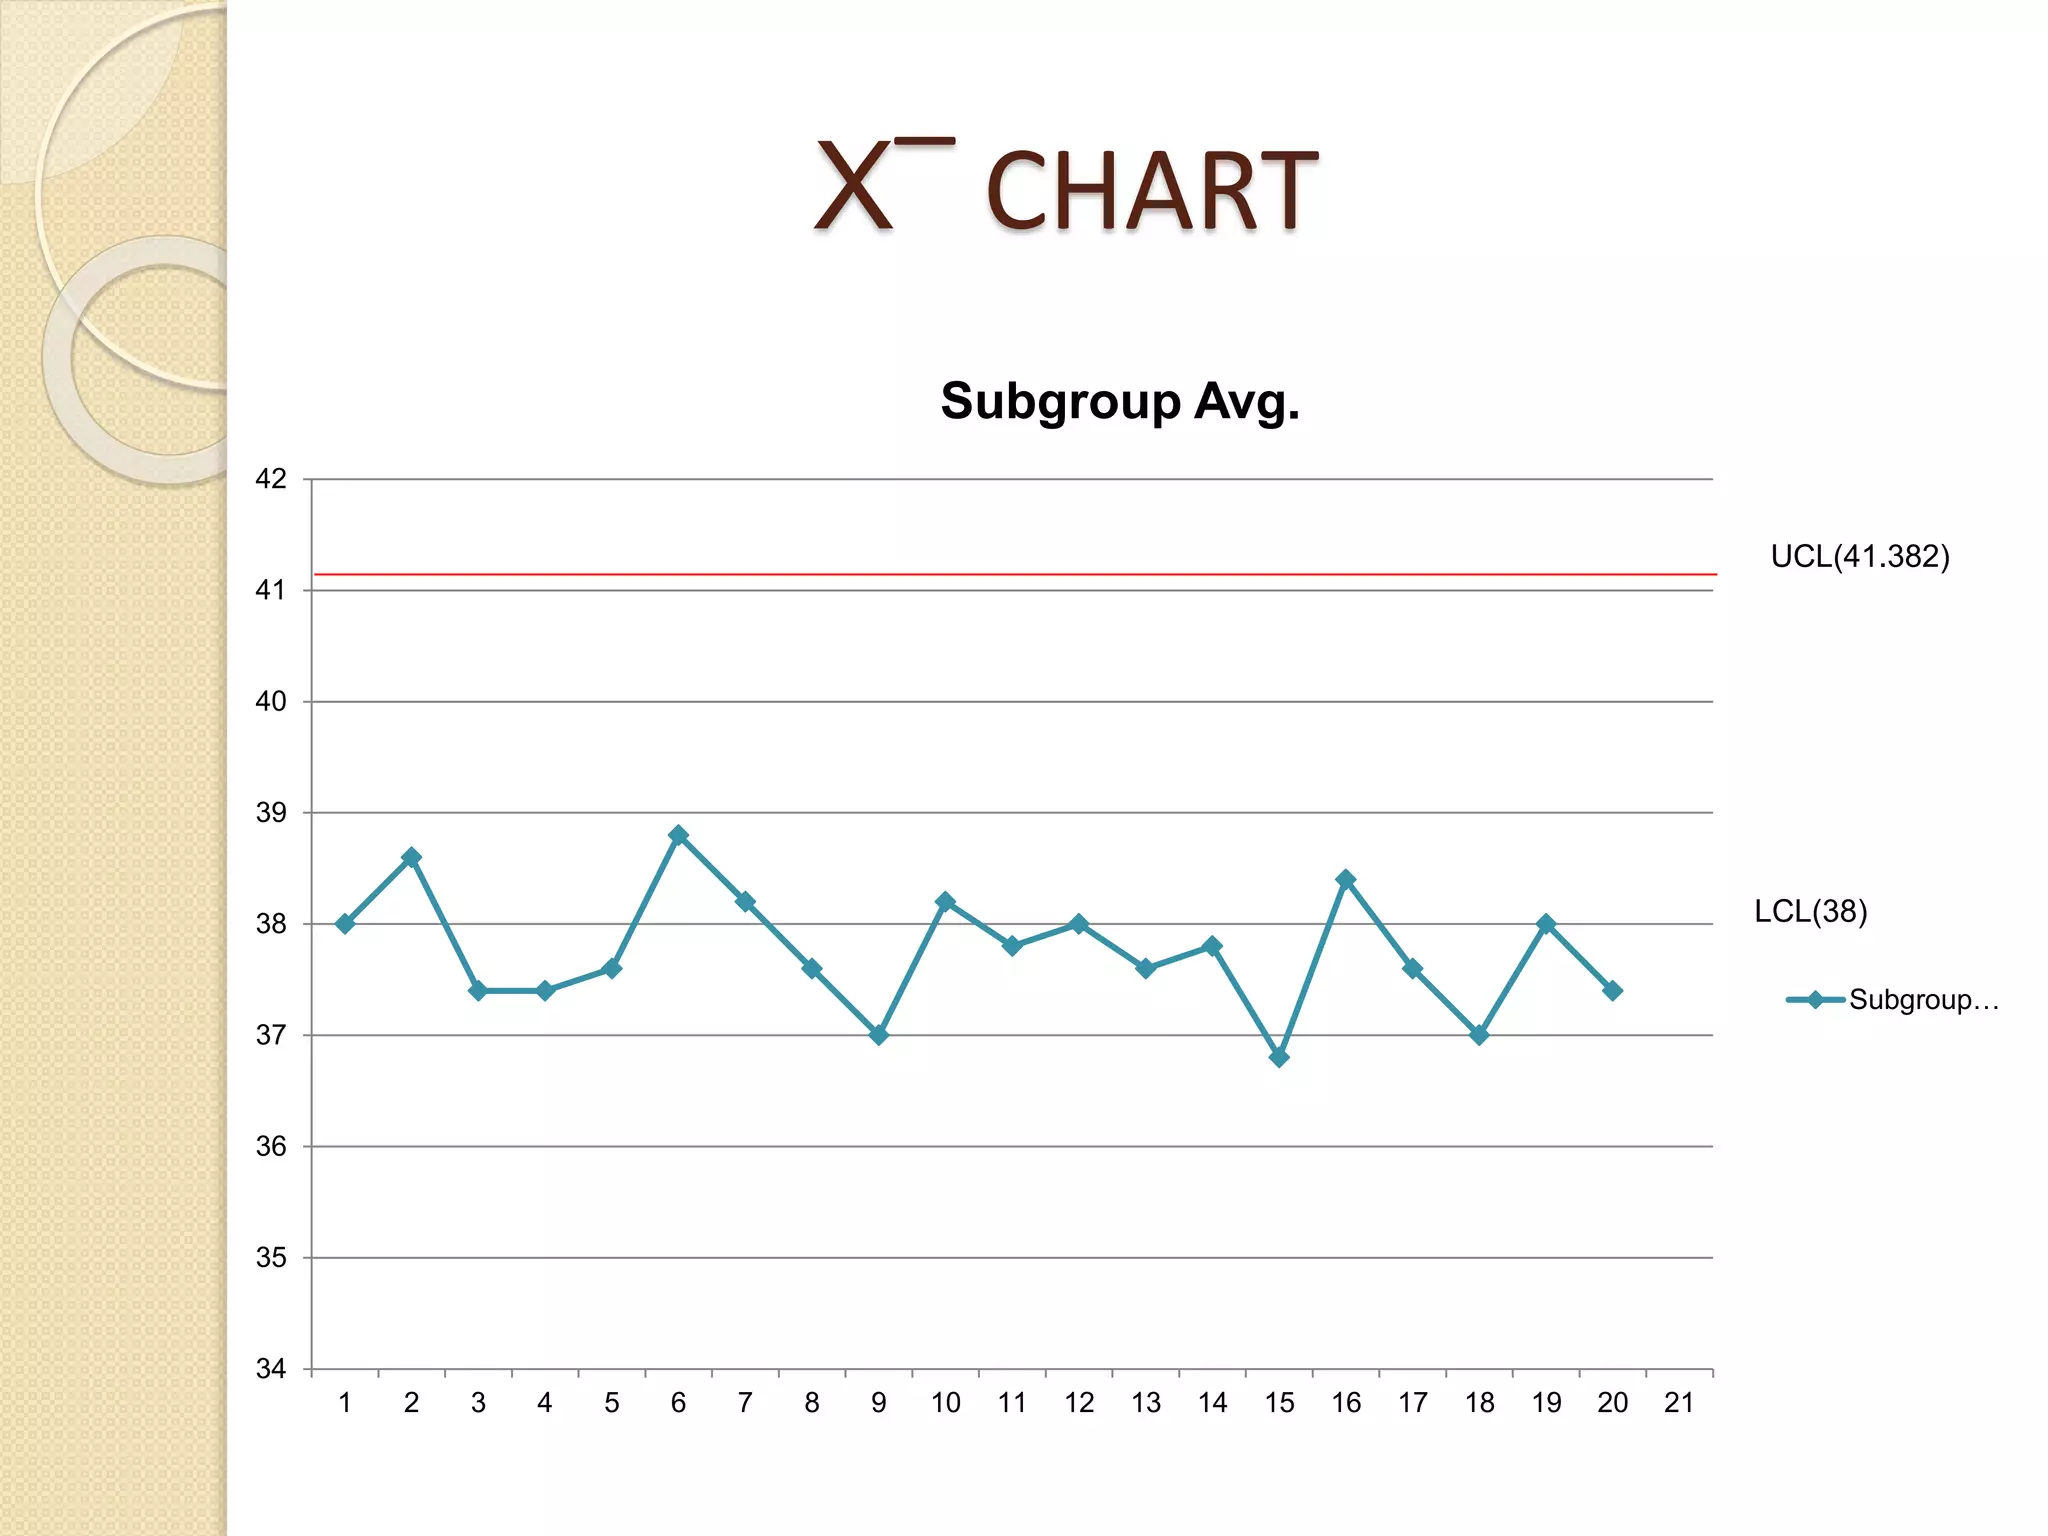
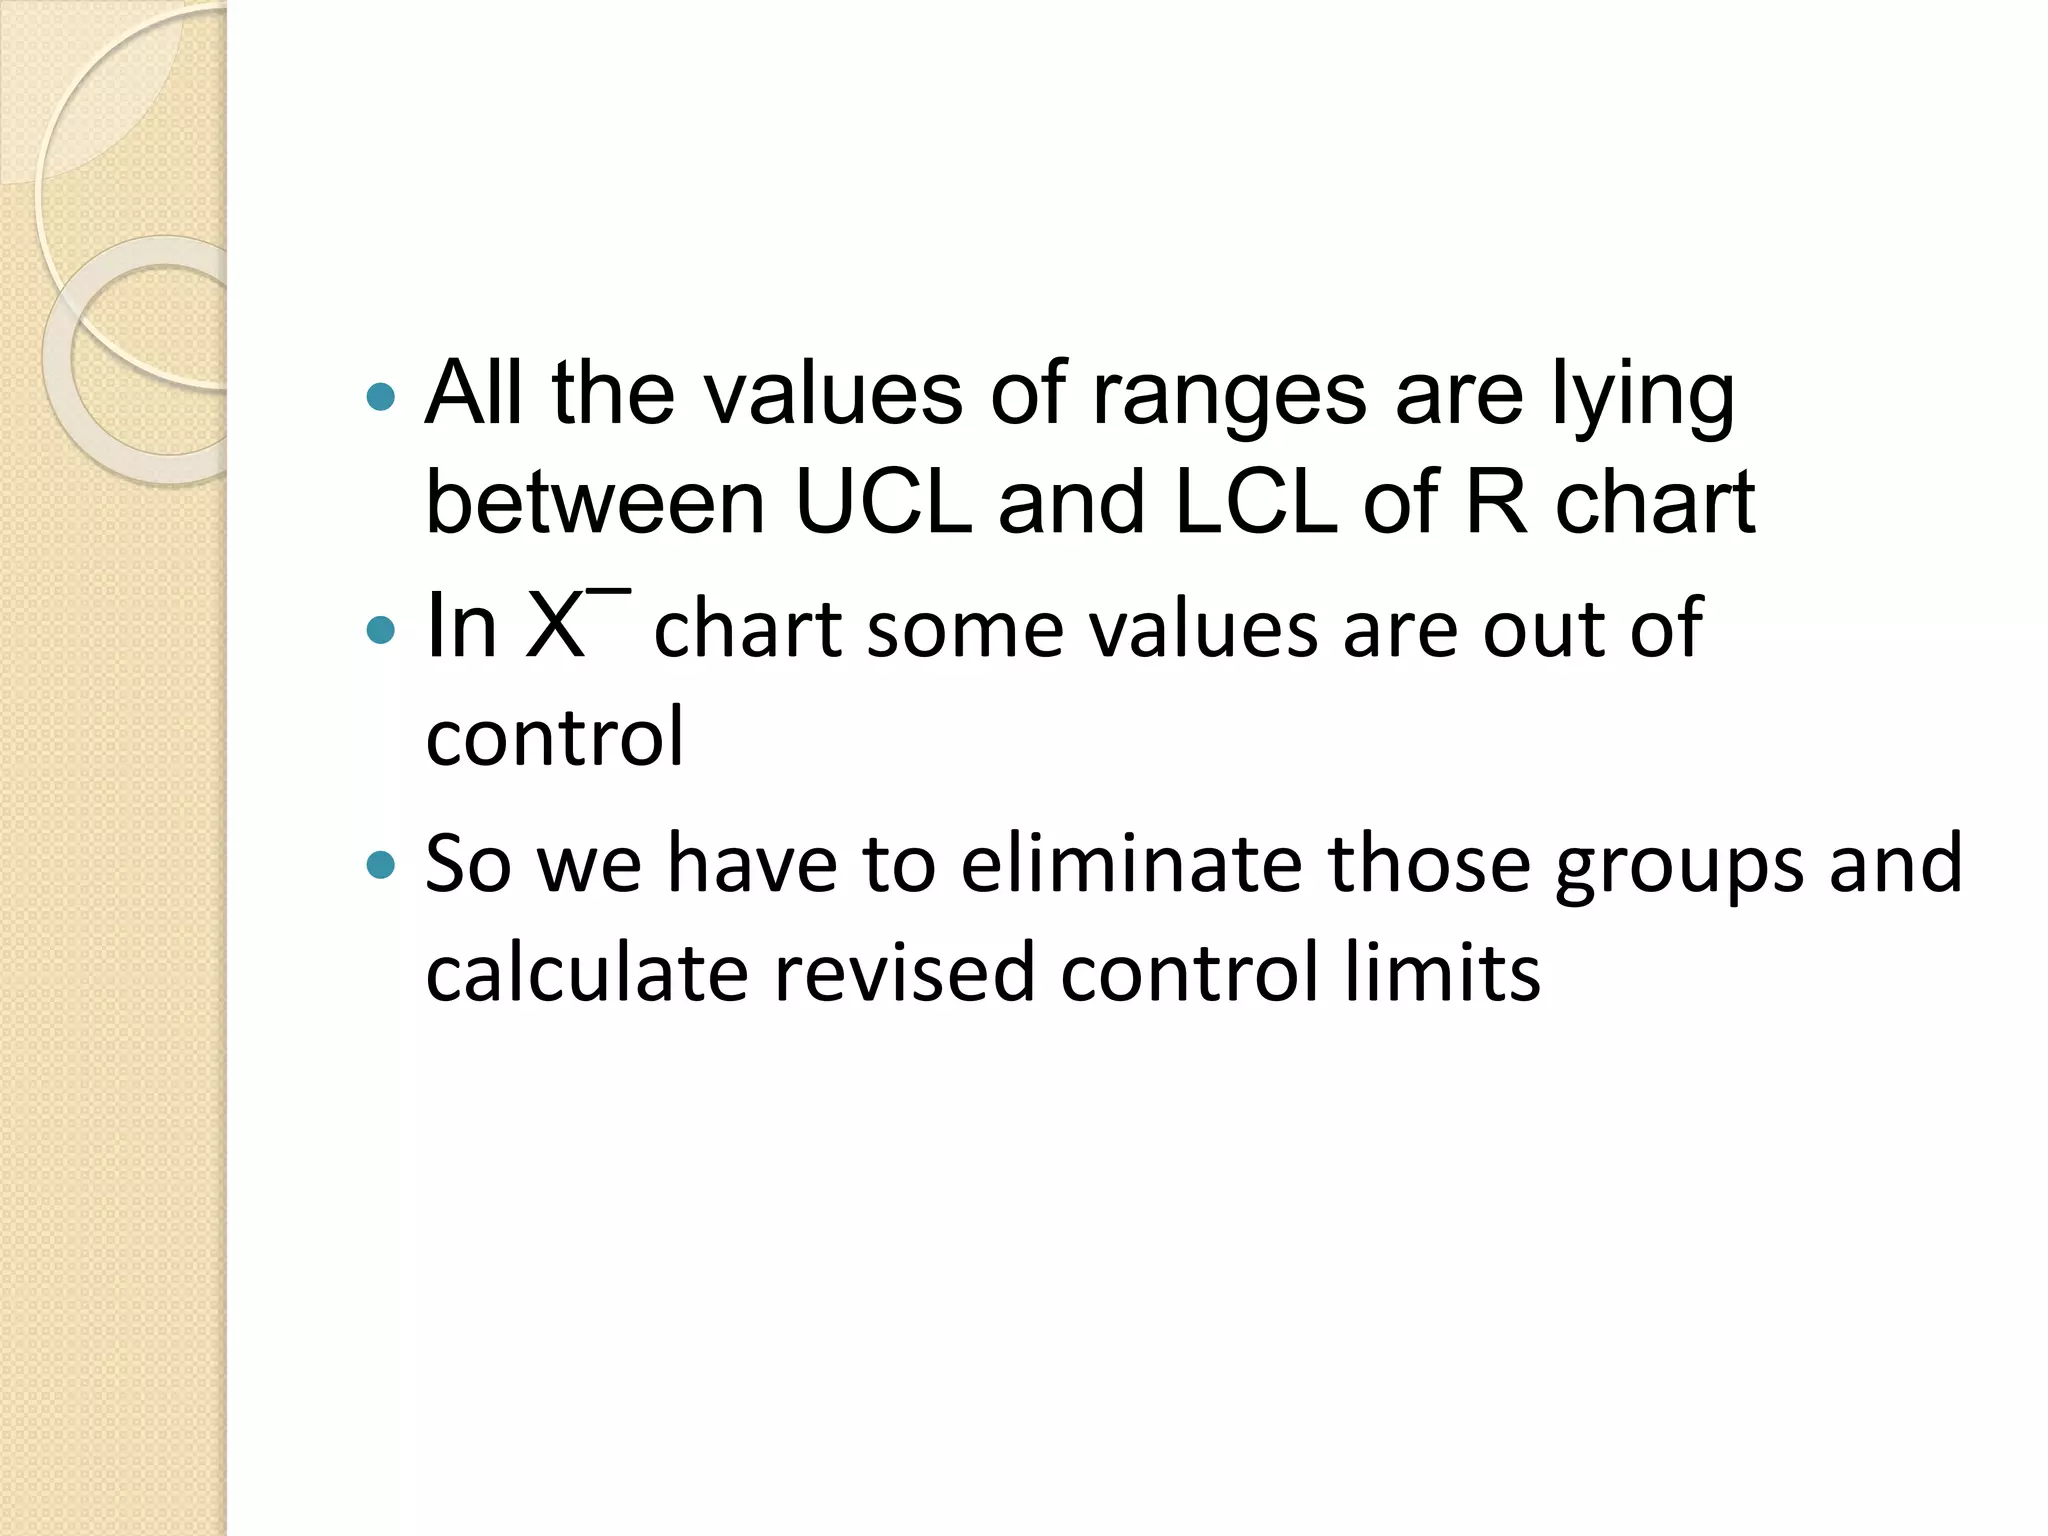
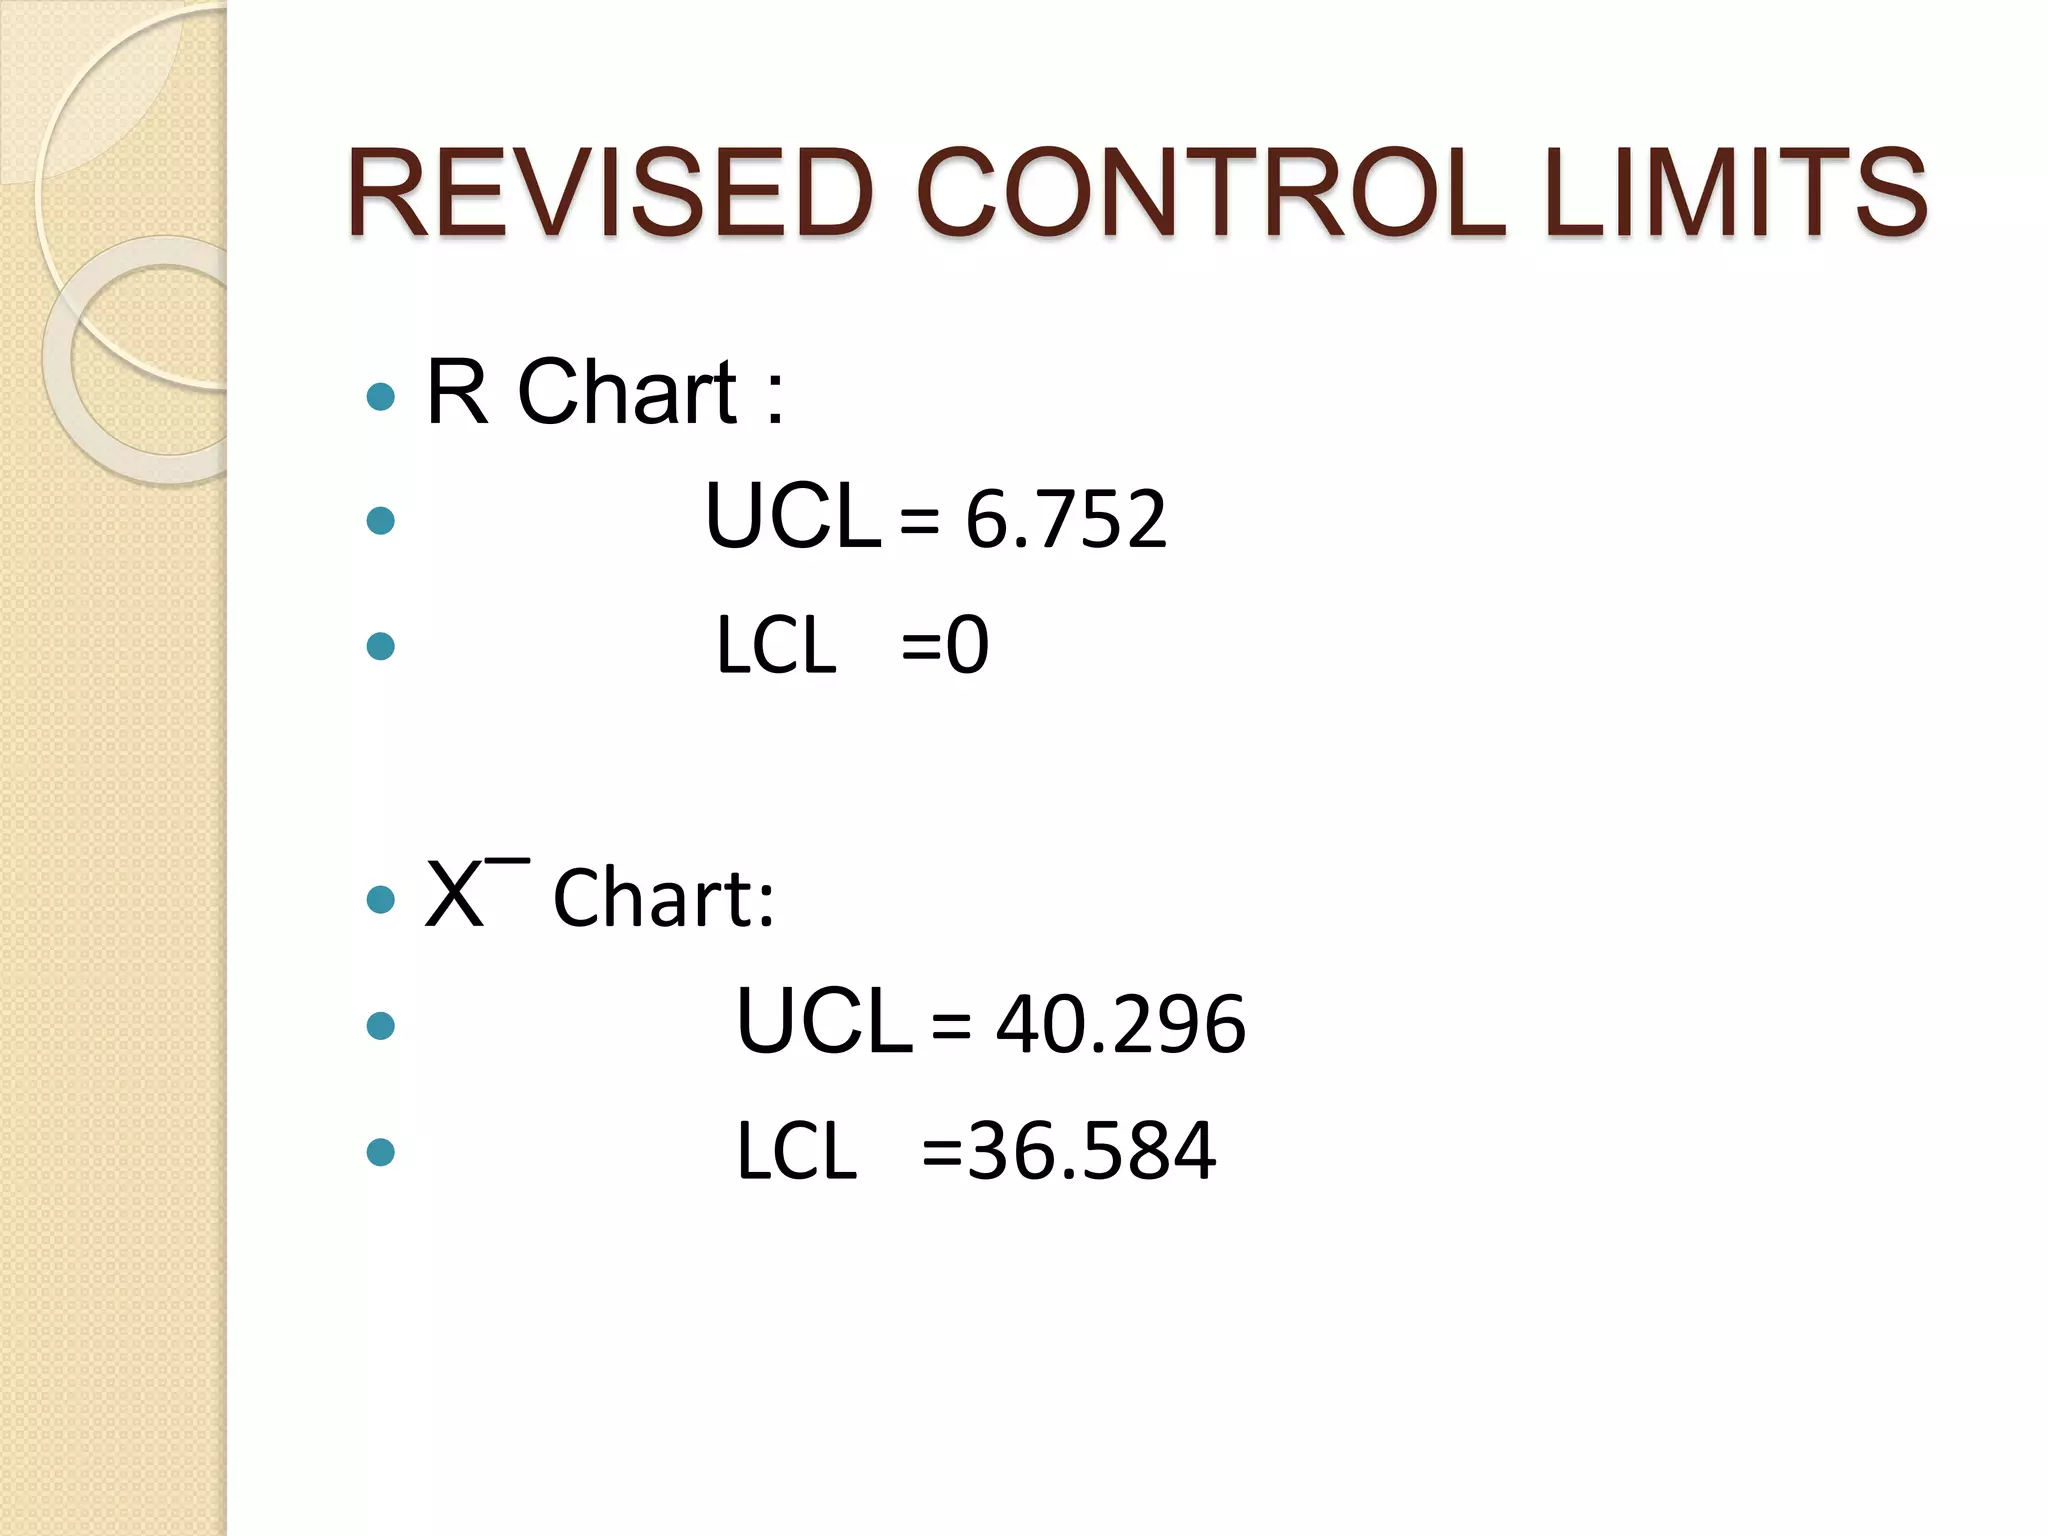
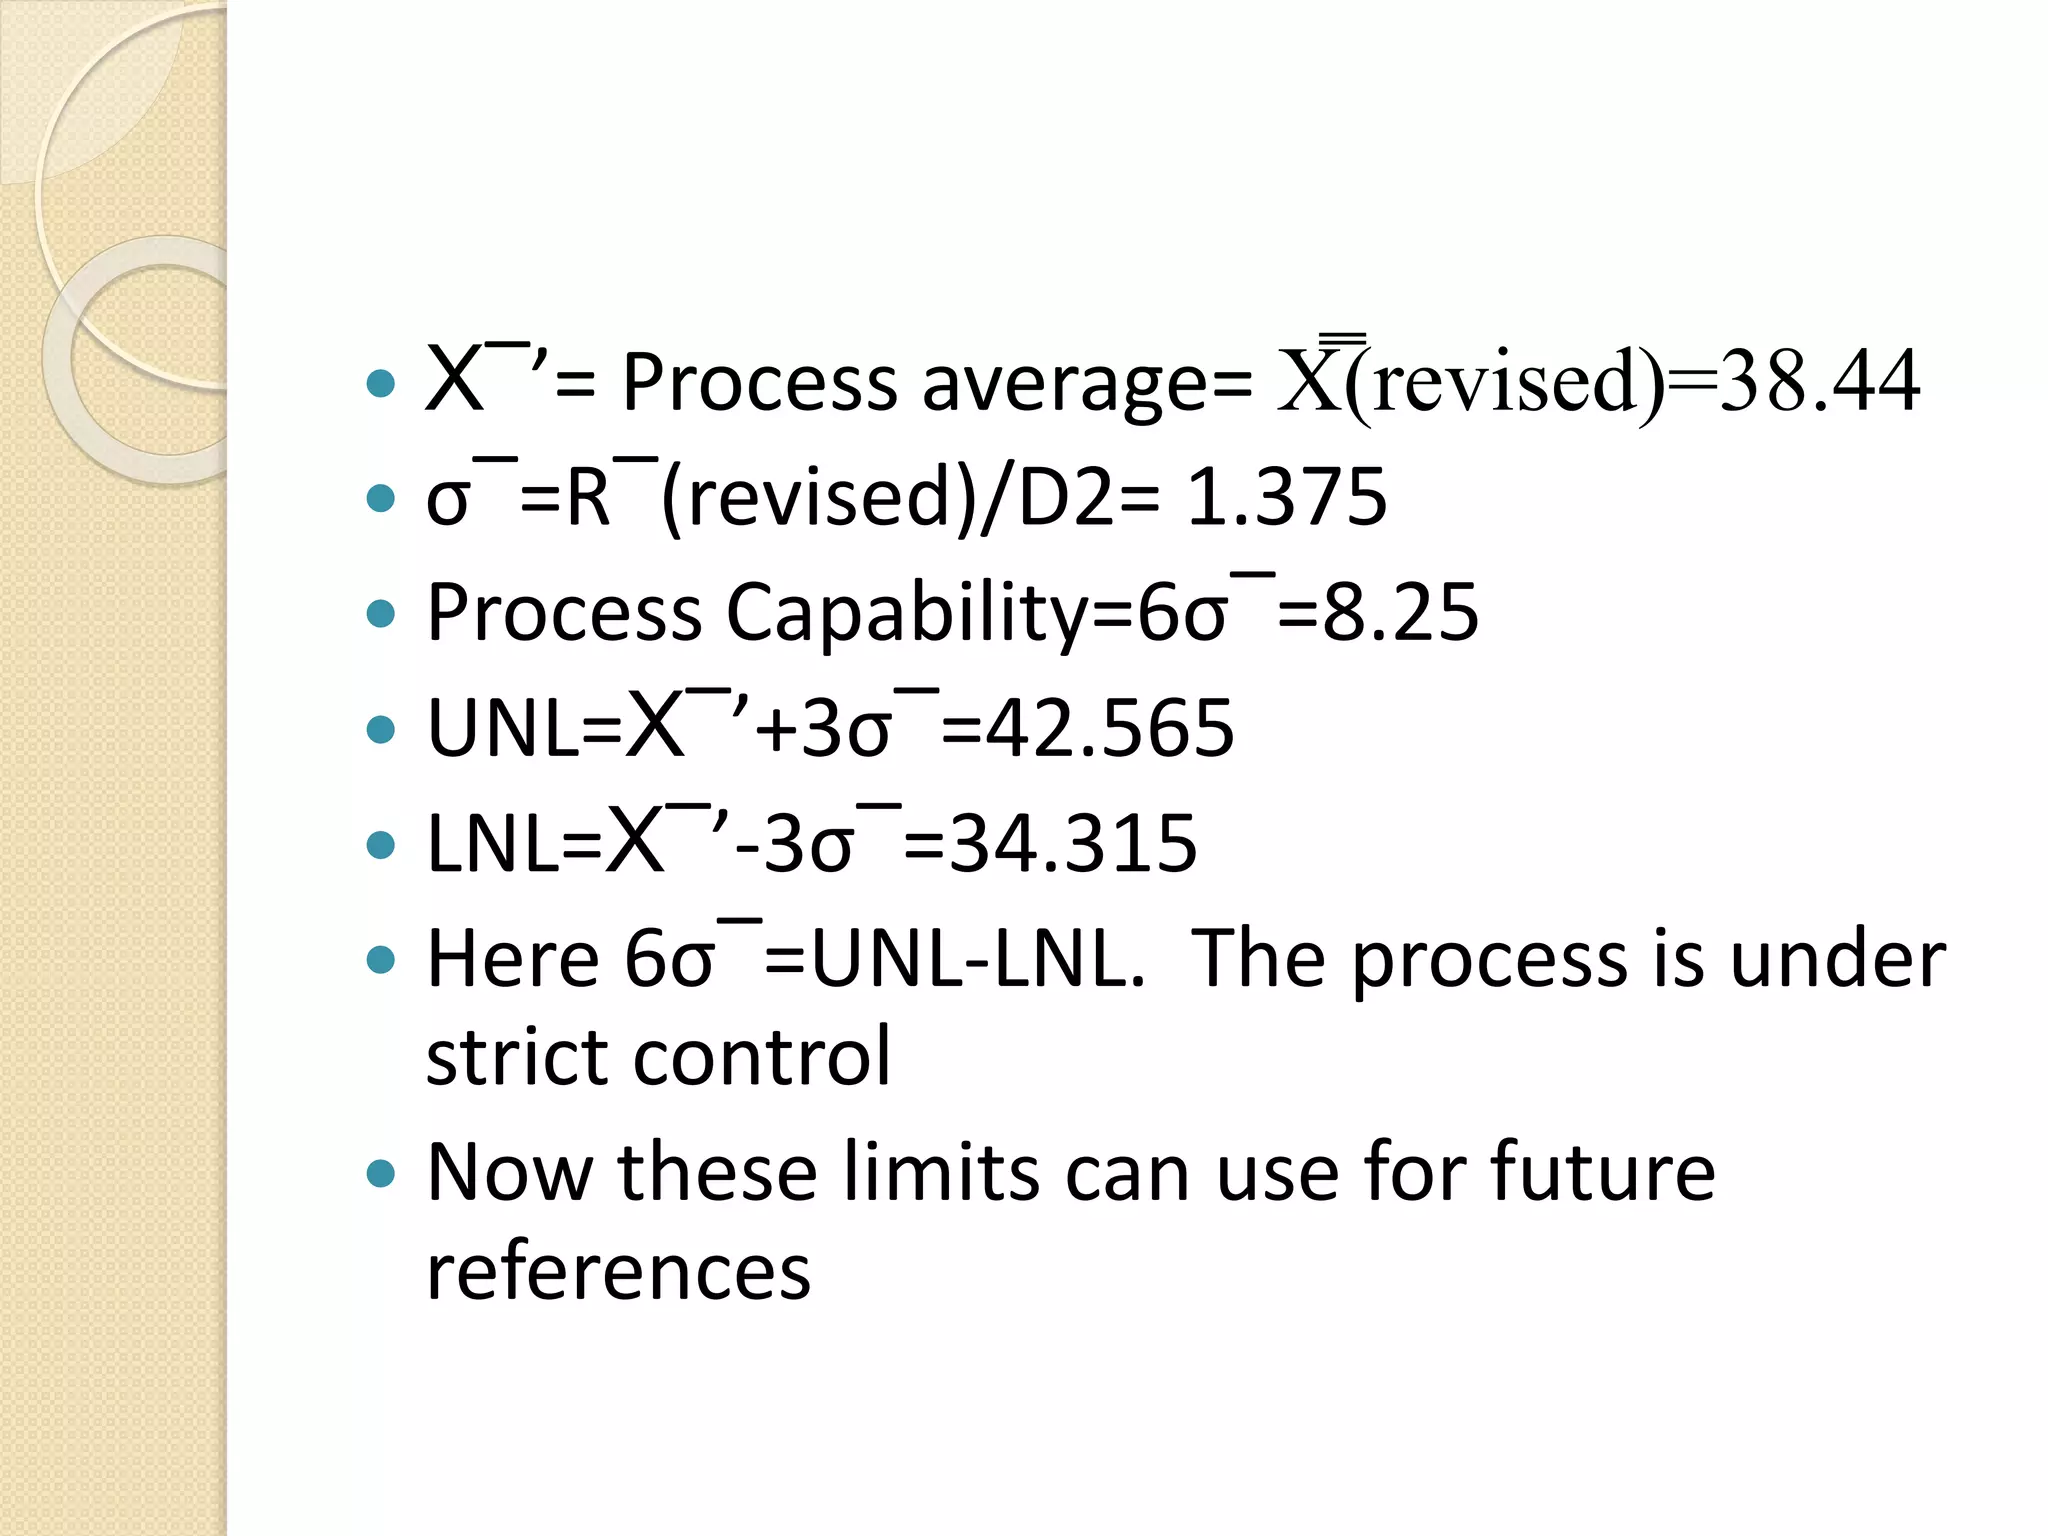

The document discusses the construction and application of x̅ and R control charts for monitoring process average and variation in quality control. It details step-by-step procedures for calculating sample averages and ranges, constructing charts, and analyzing a case study involving 100 work pieces to determine process control limits. The final findings indicate that the process is under control, with all points lying within revised control limits.


![Control Charts[1]](https://cdn.slidesharecdn.com/ss_thumbnails/controlcharts1-1226081330857138-9-thumbnail.jpg?width=640&height=640&fit=bounds)


![[Actuary] actuarial mathematics and life table statistics](https://cdn.slidesharecdn.com/ss_thumbnails/actuaryactuarialmathematicsandlife-tablestatistics-120627131254-phpapp01-thumbnail.jpg?width=640&height=640&fit=bounds)


