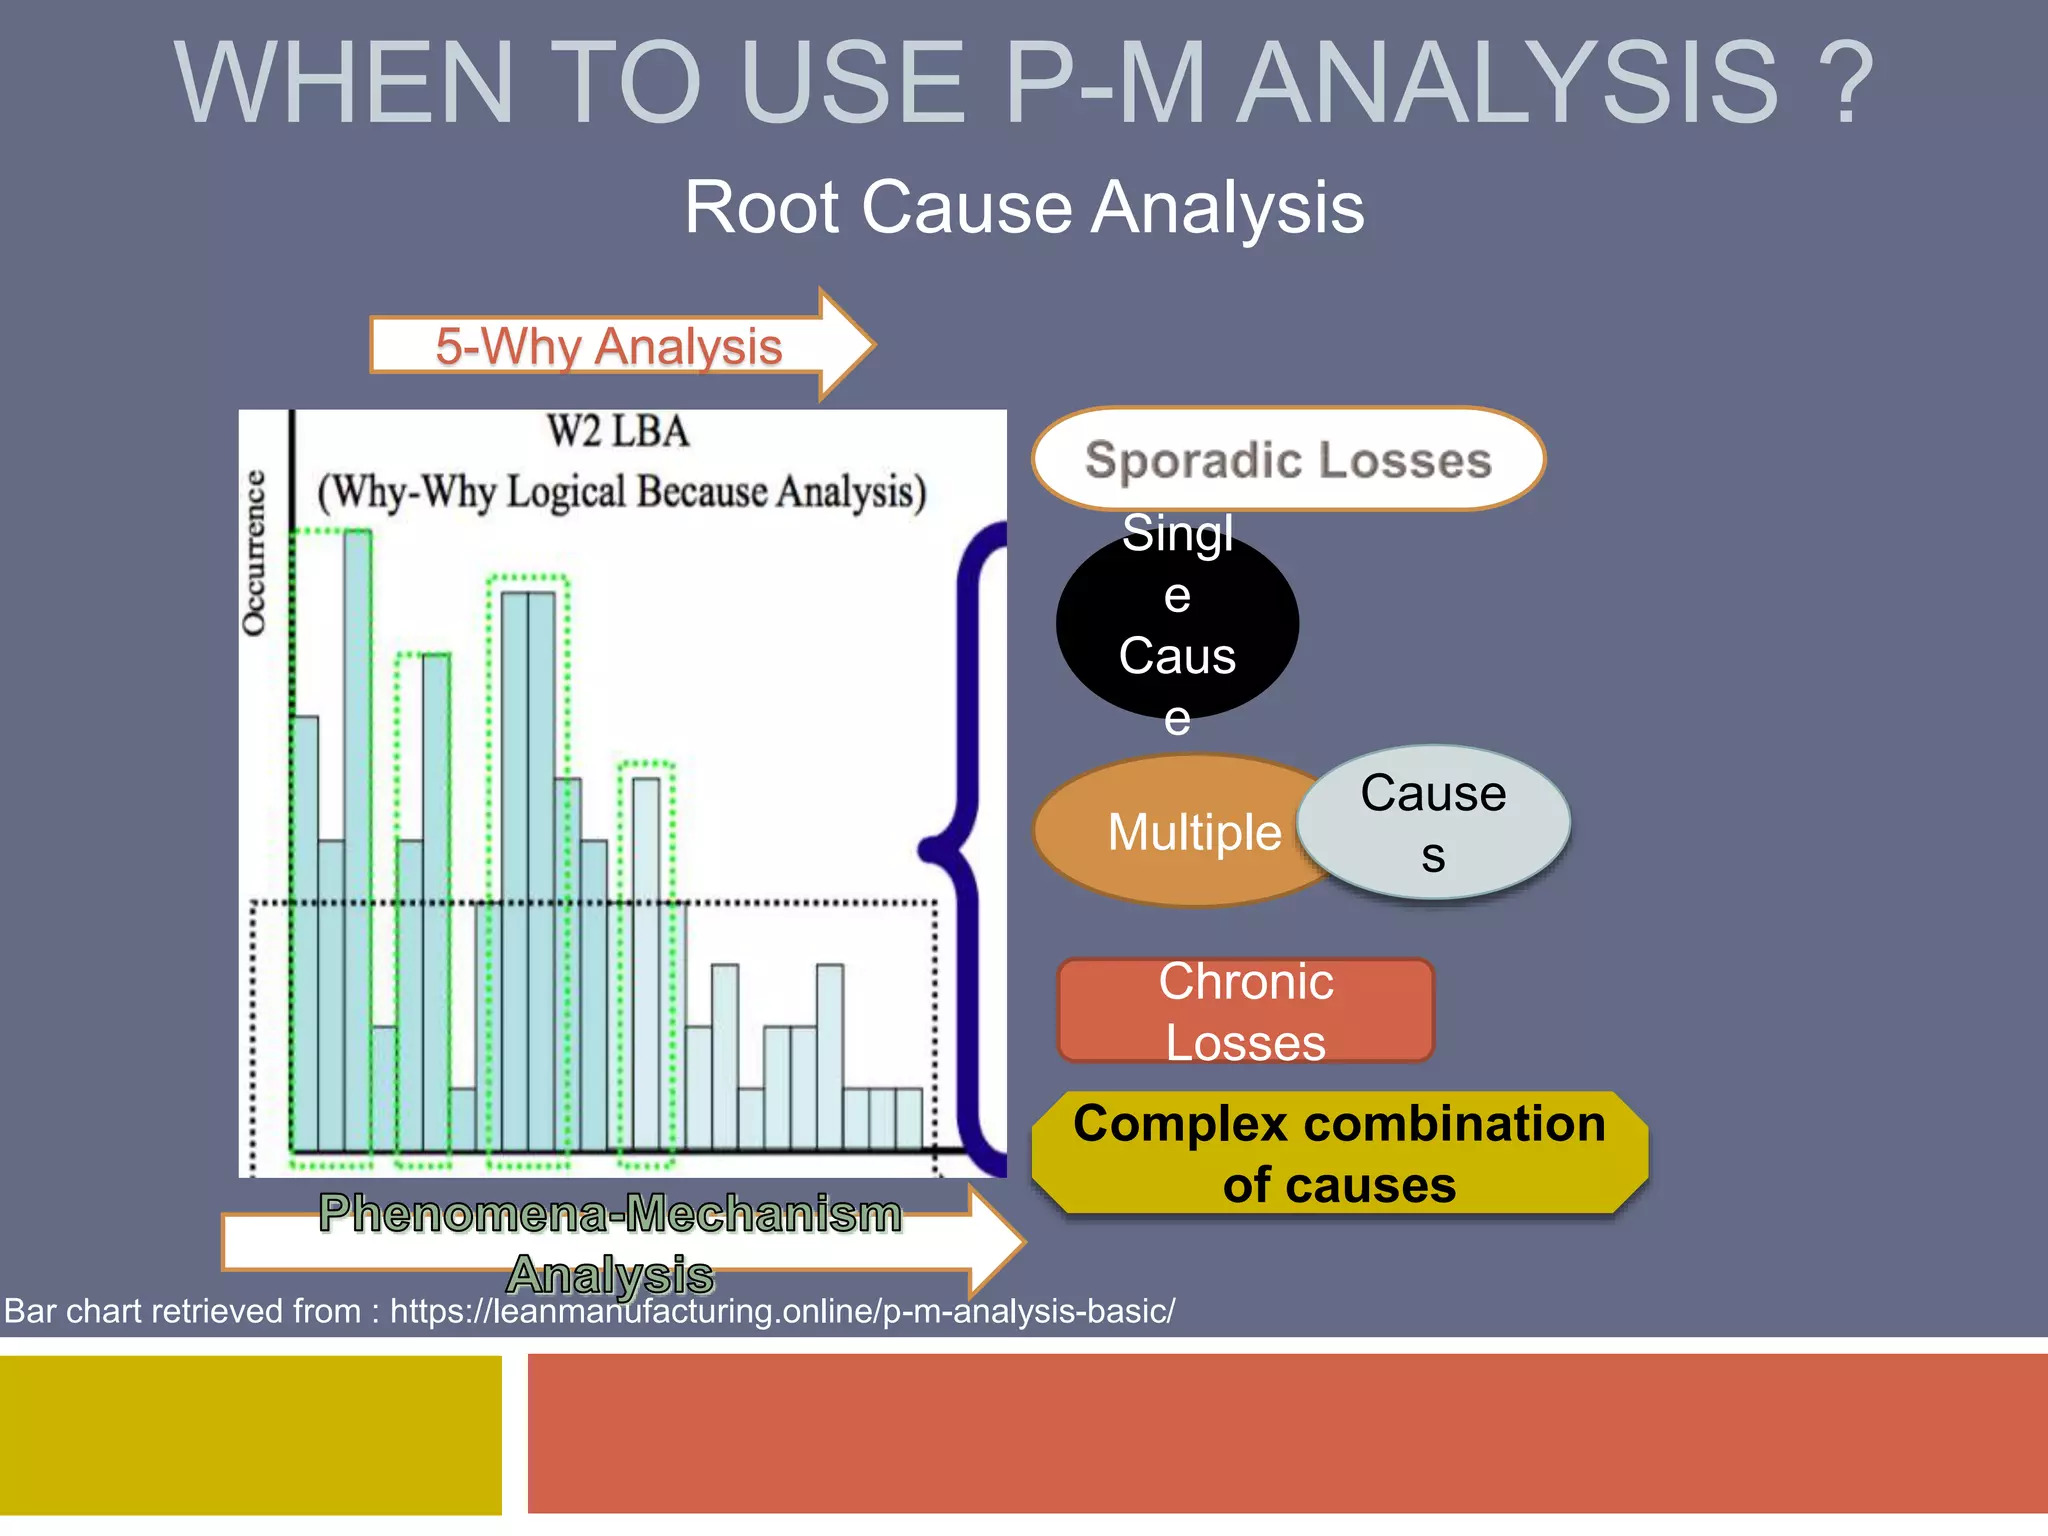
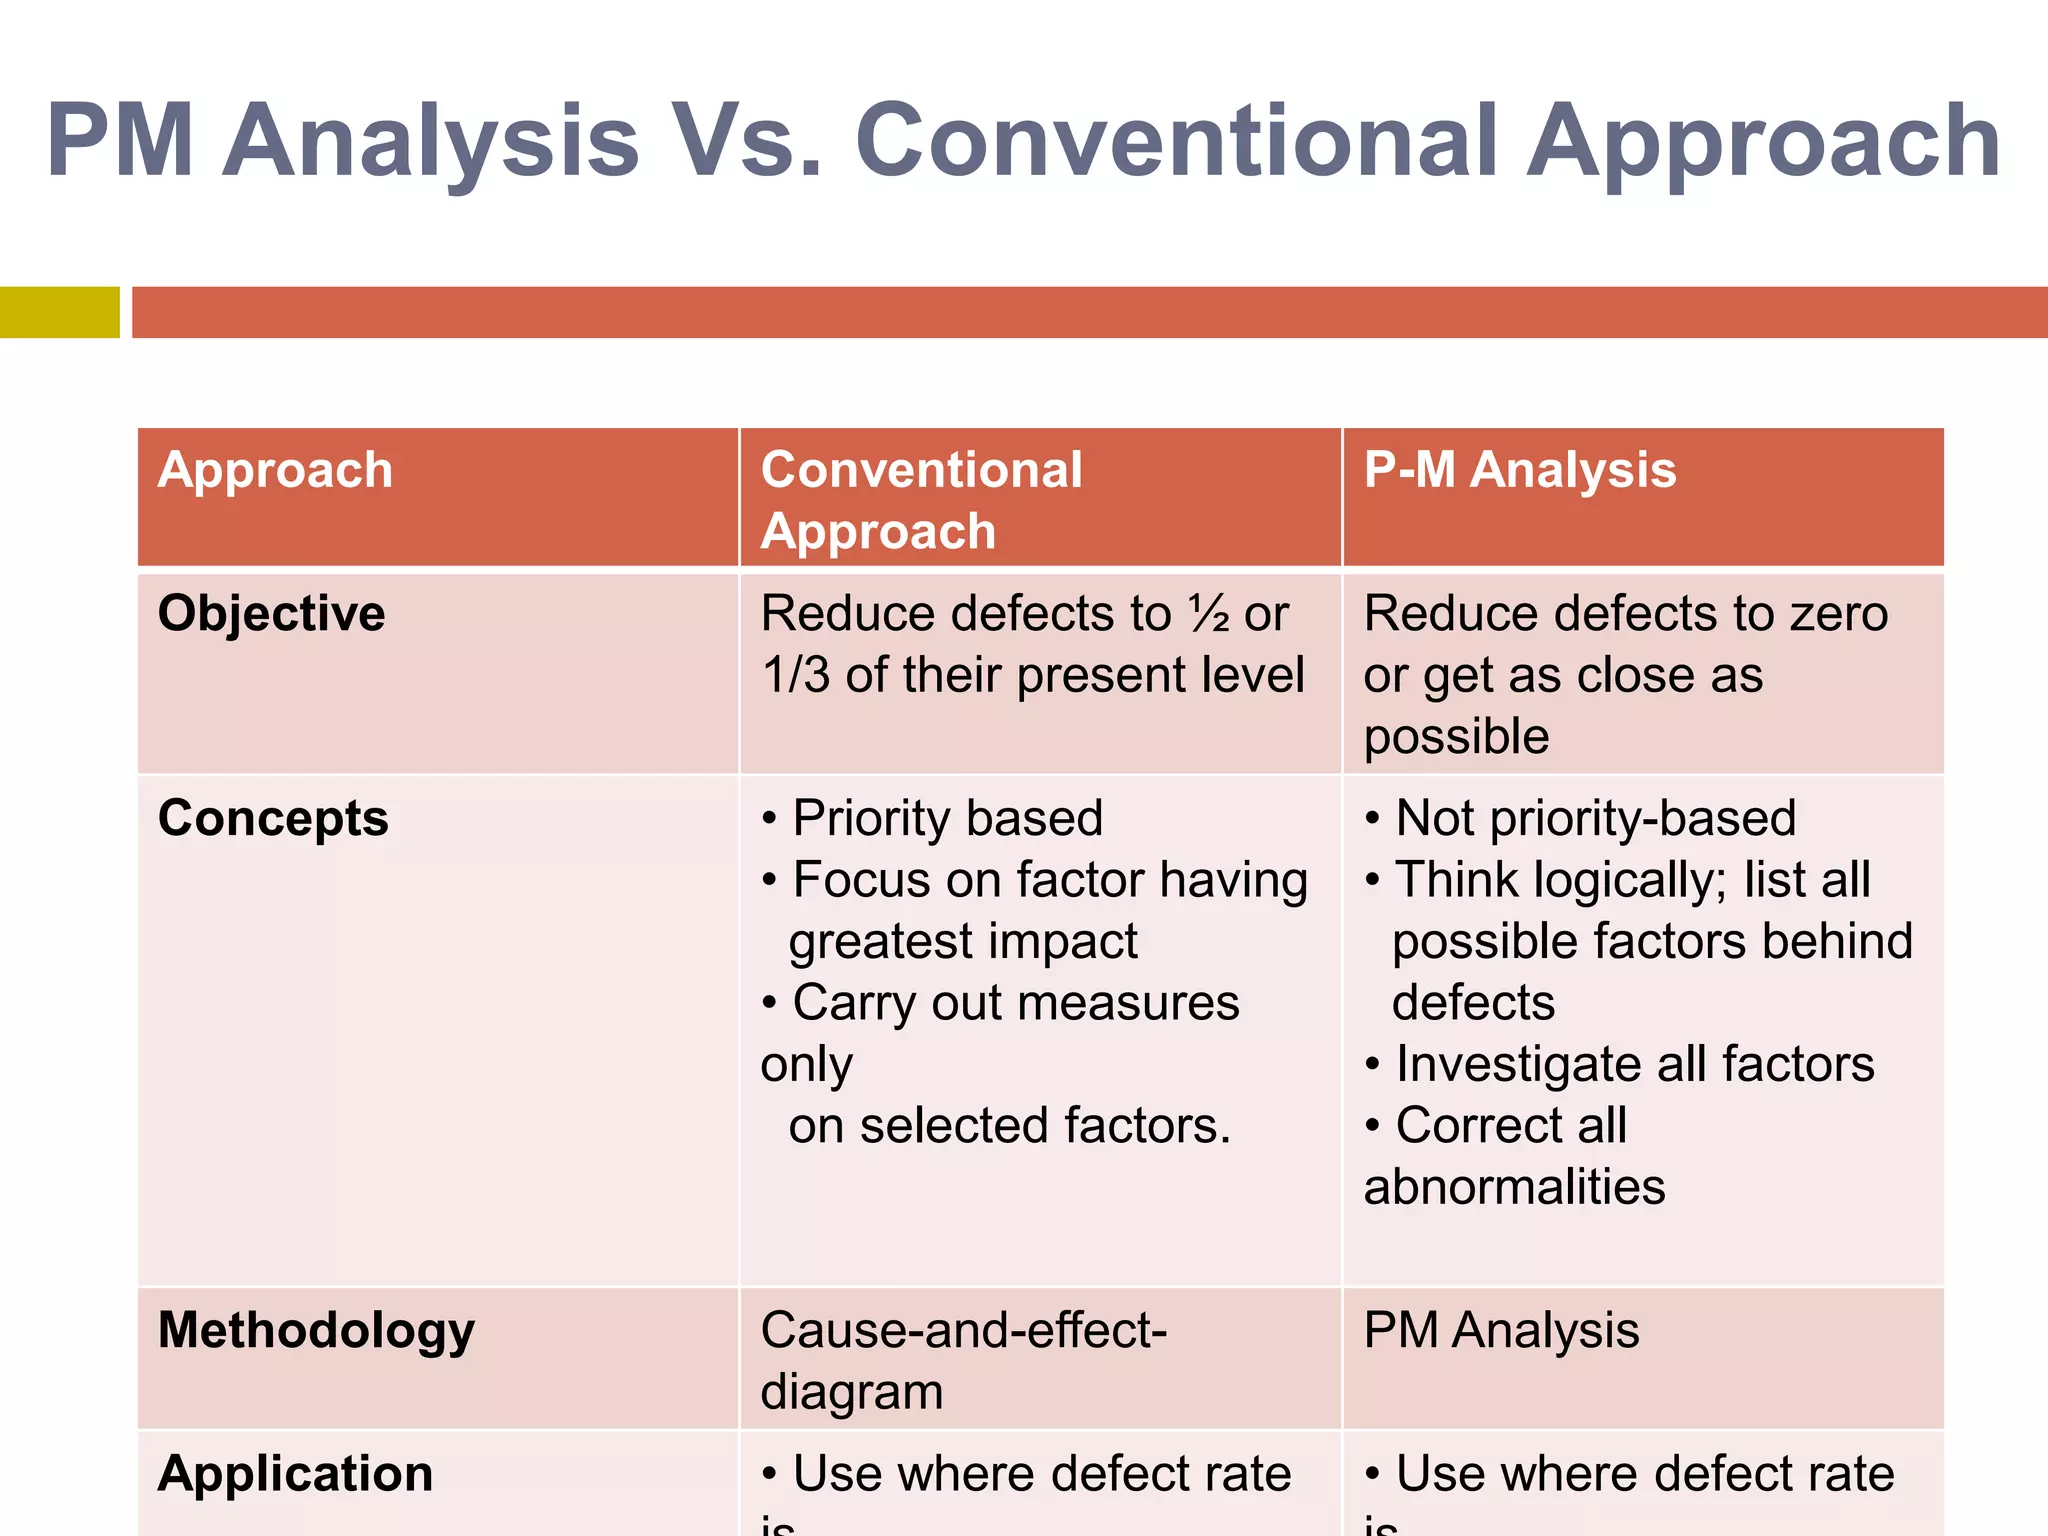
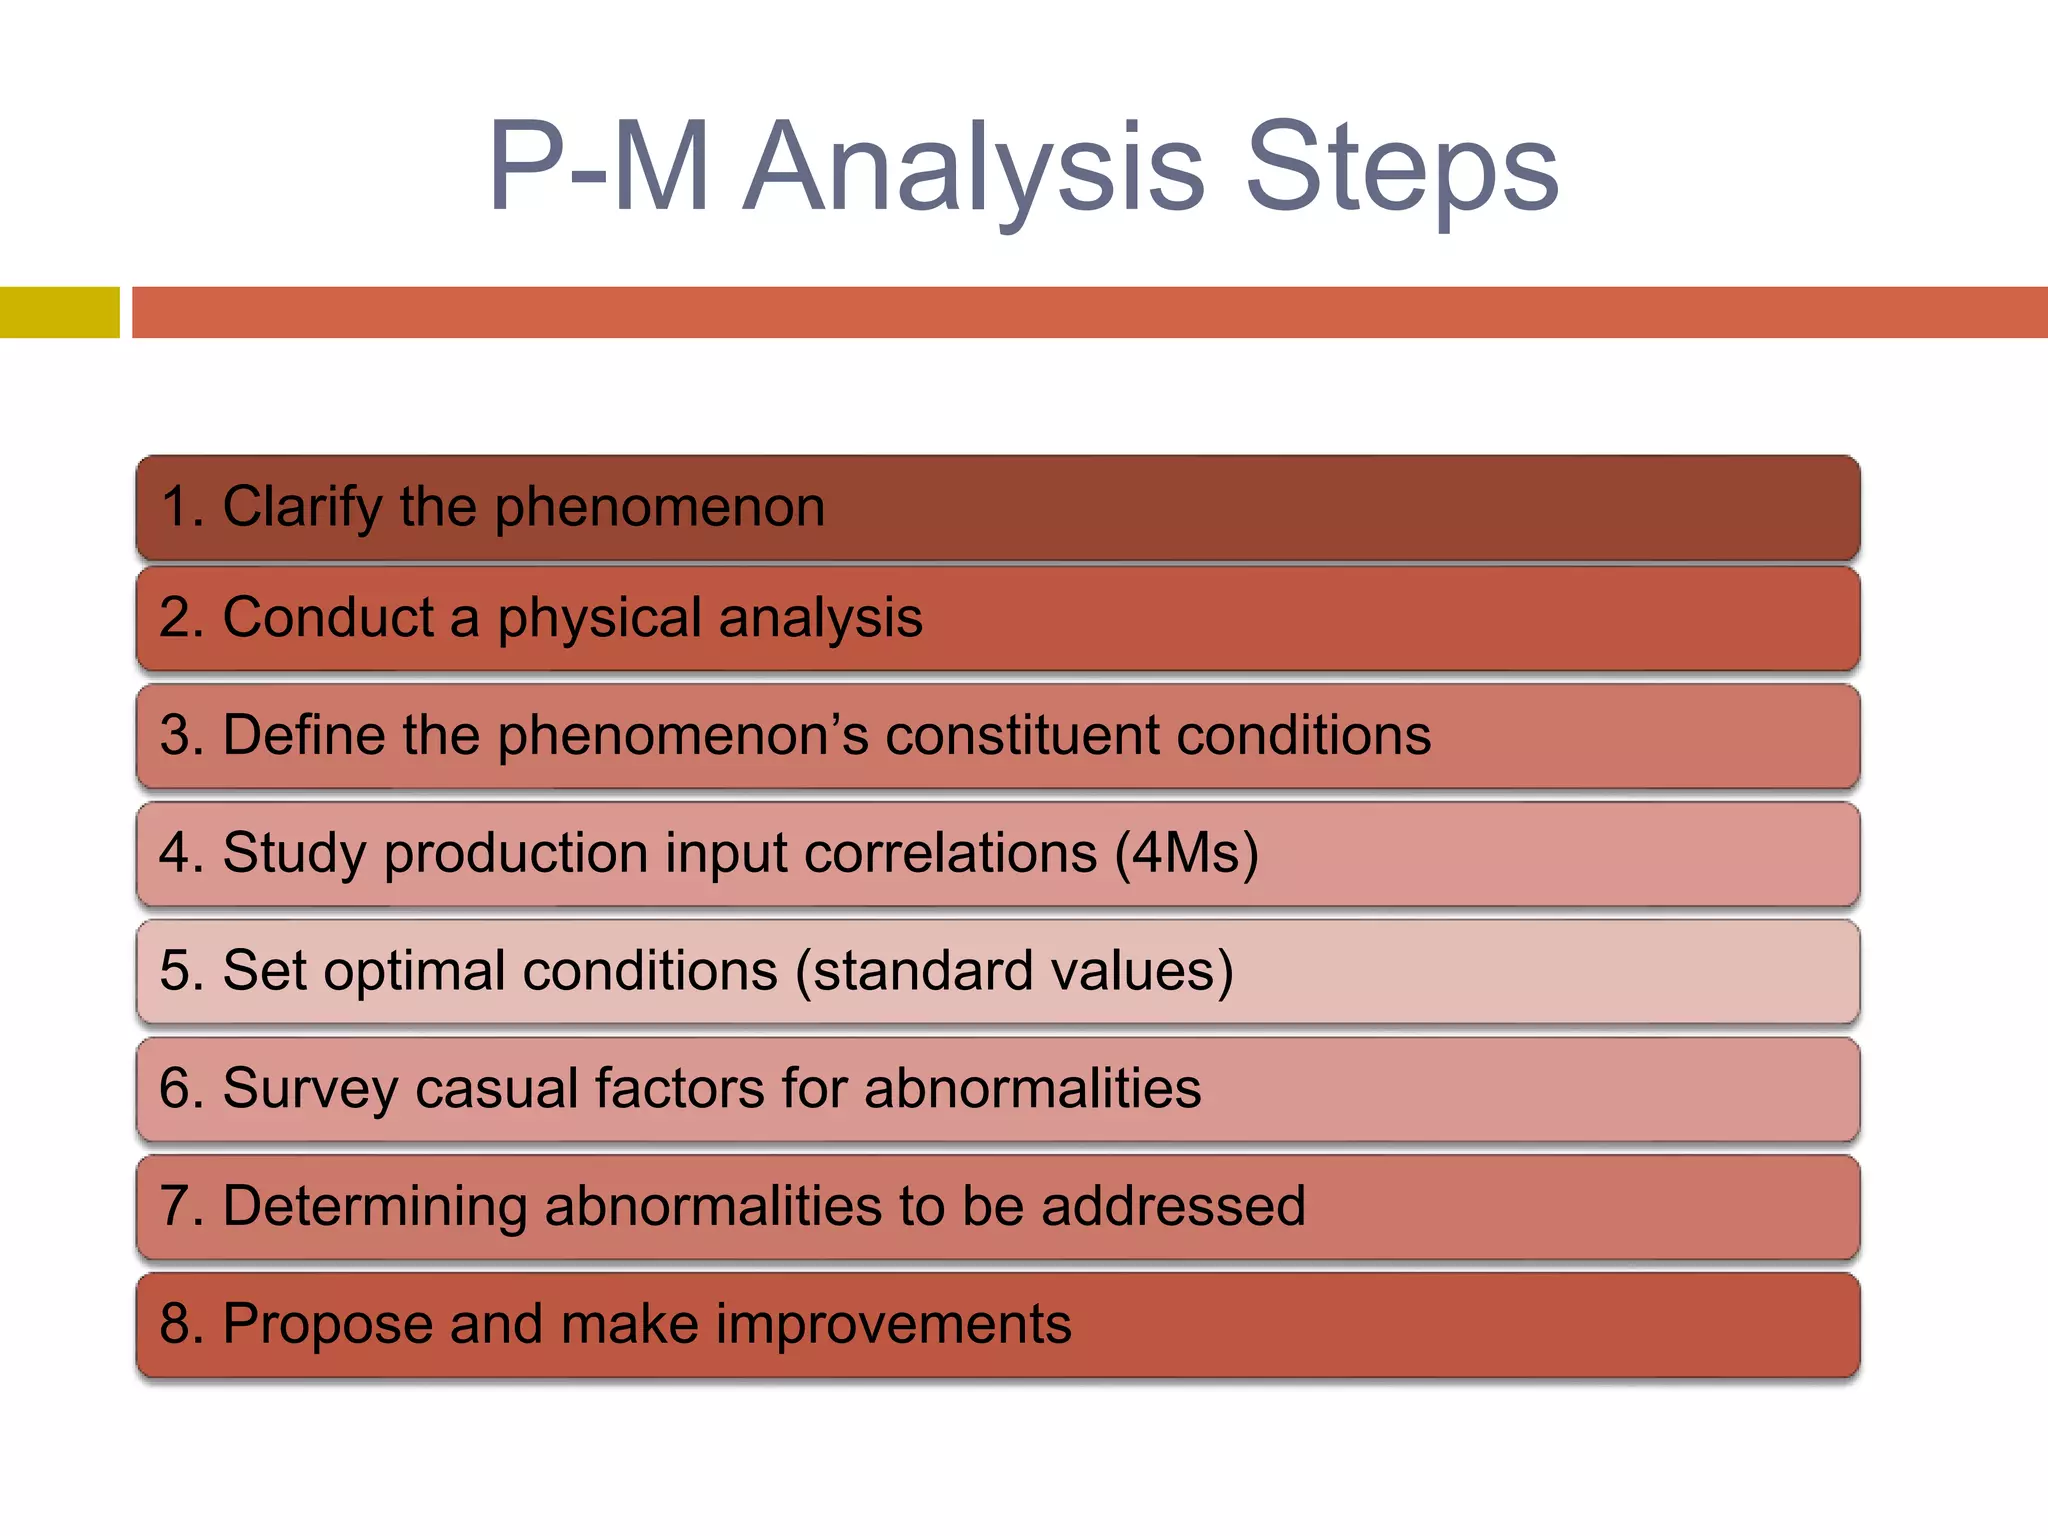
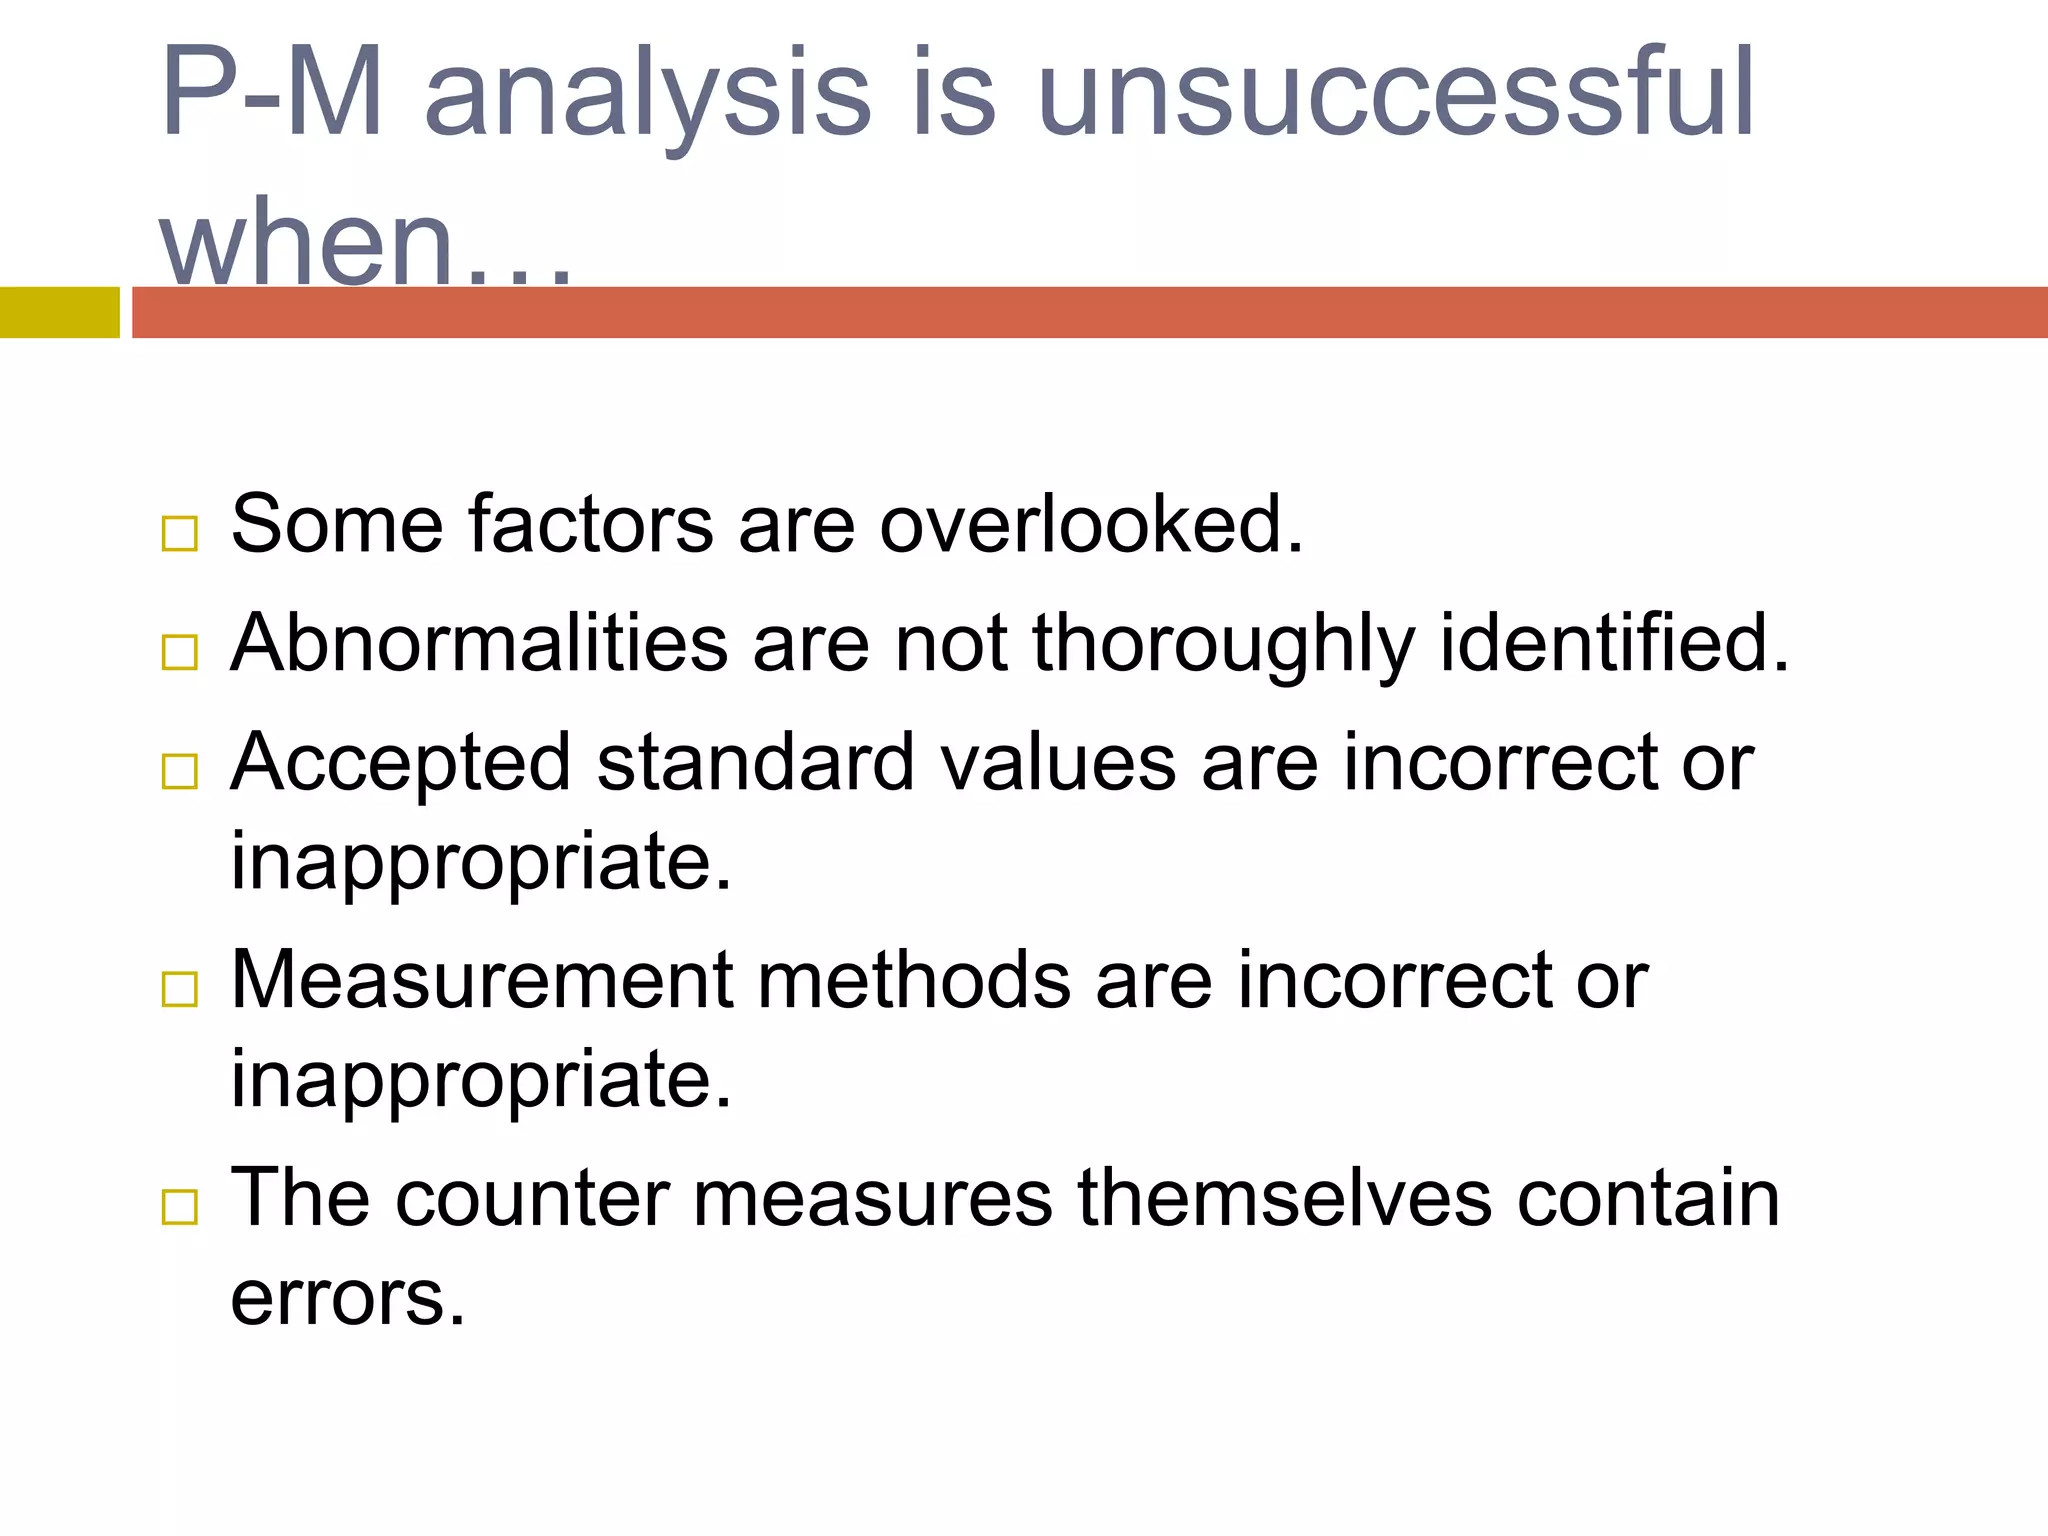
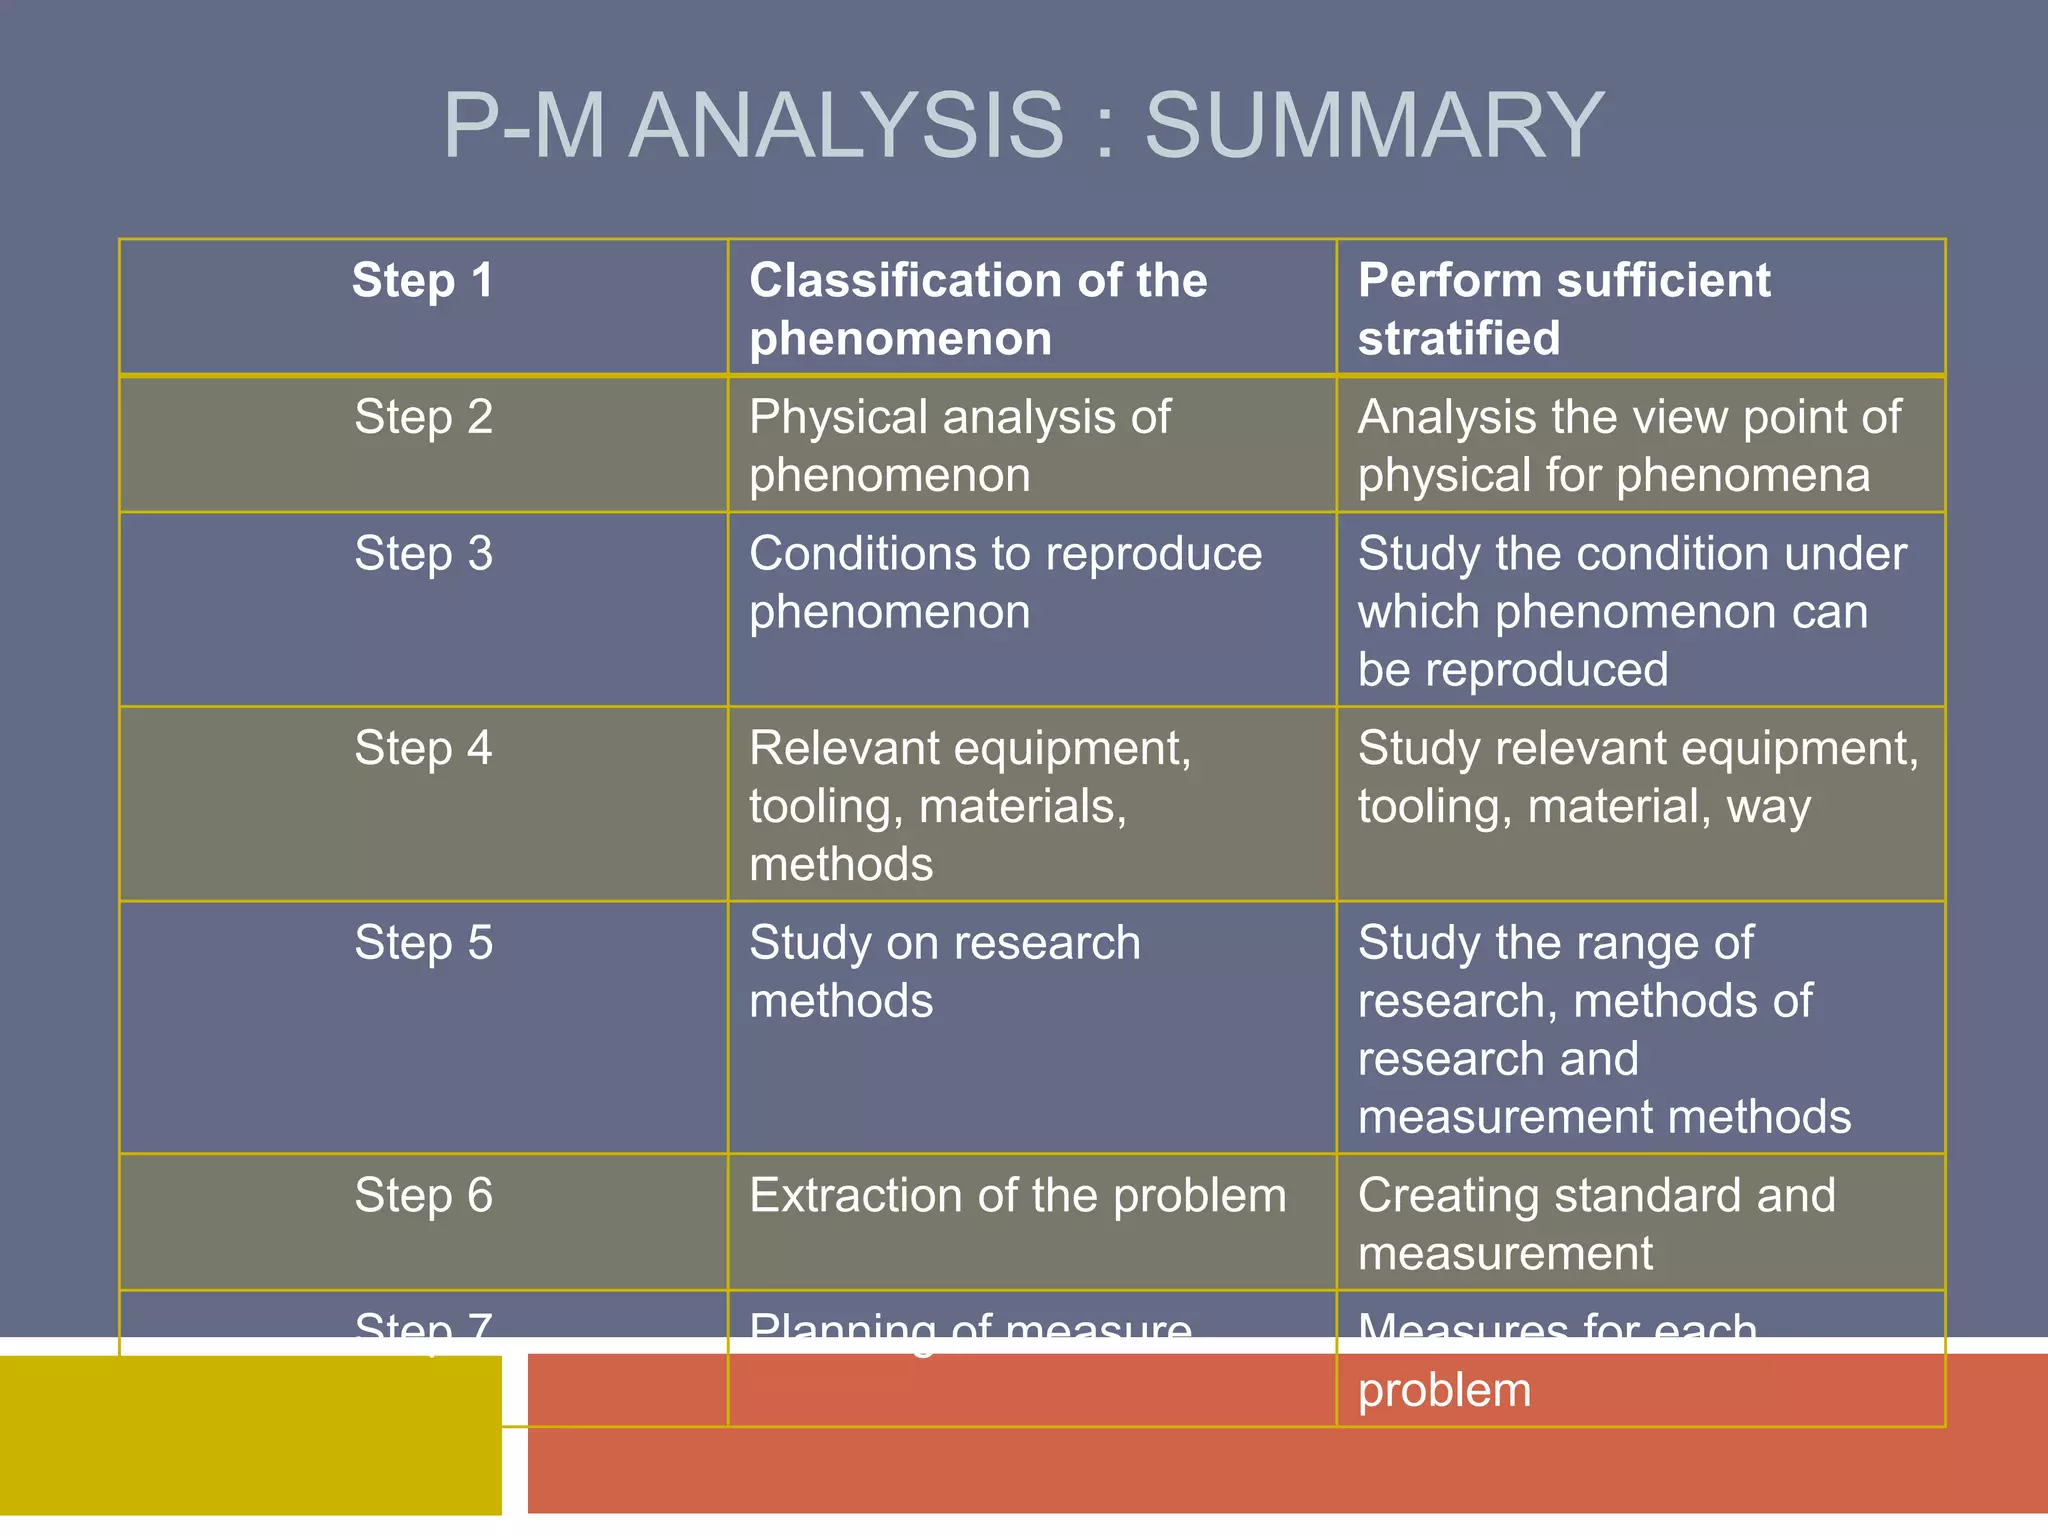
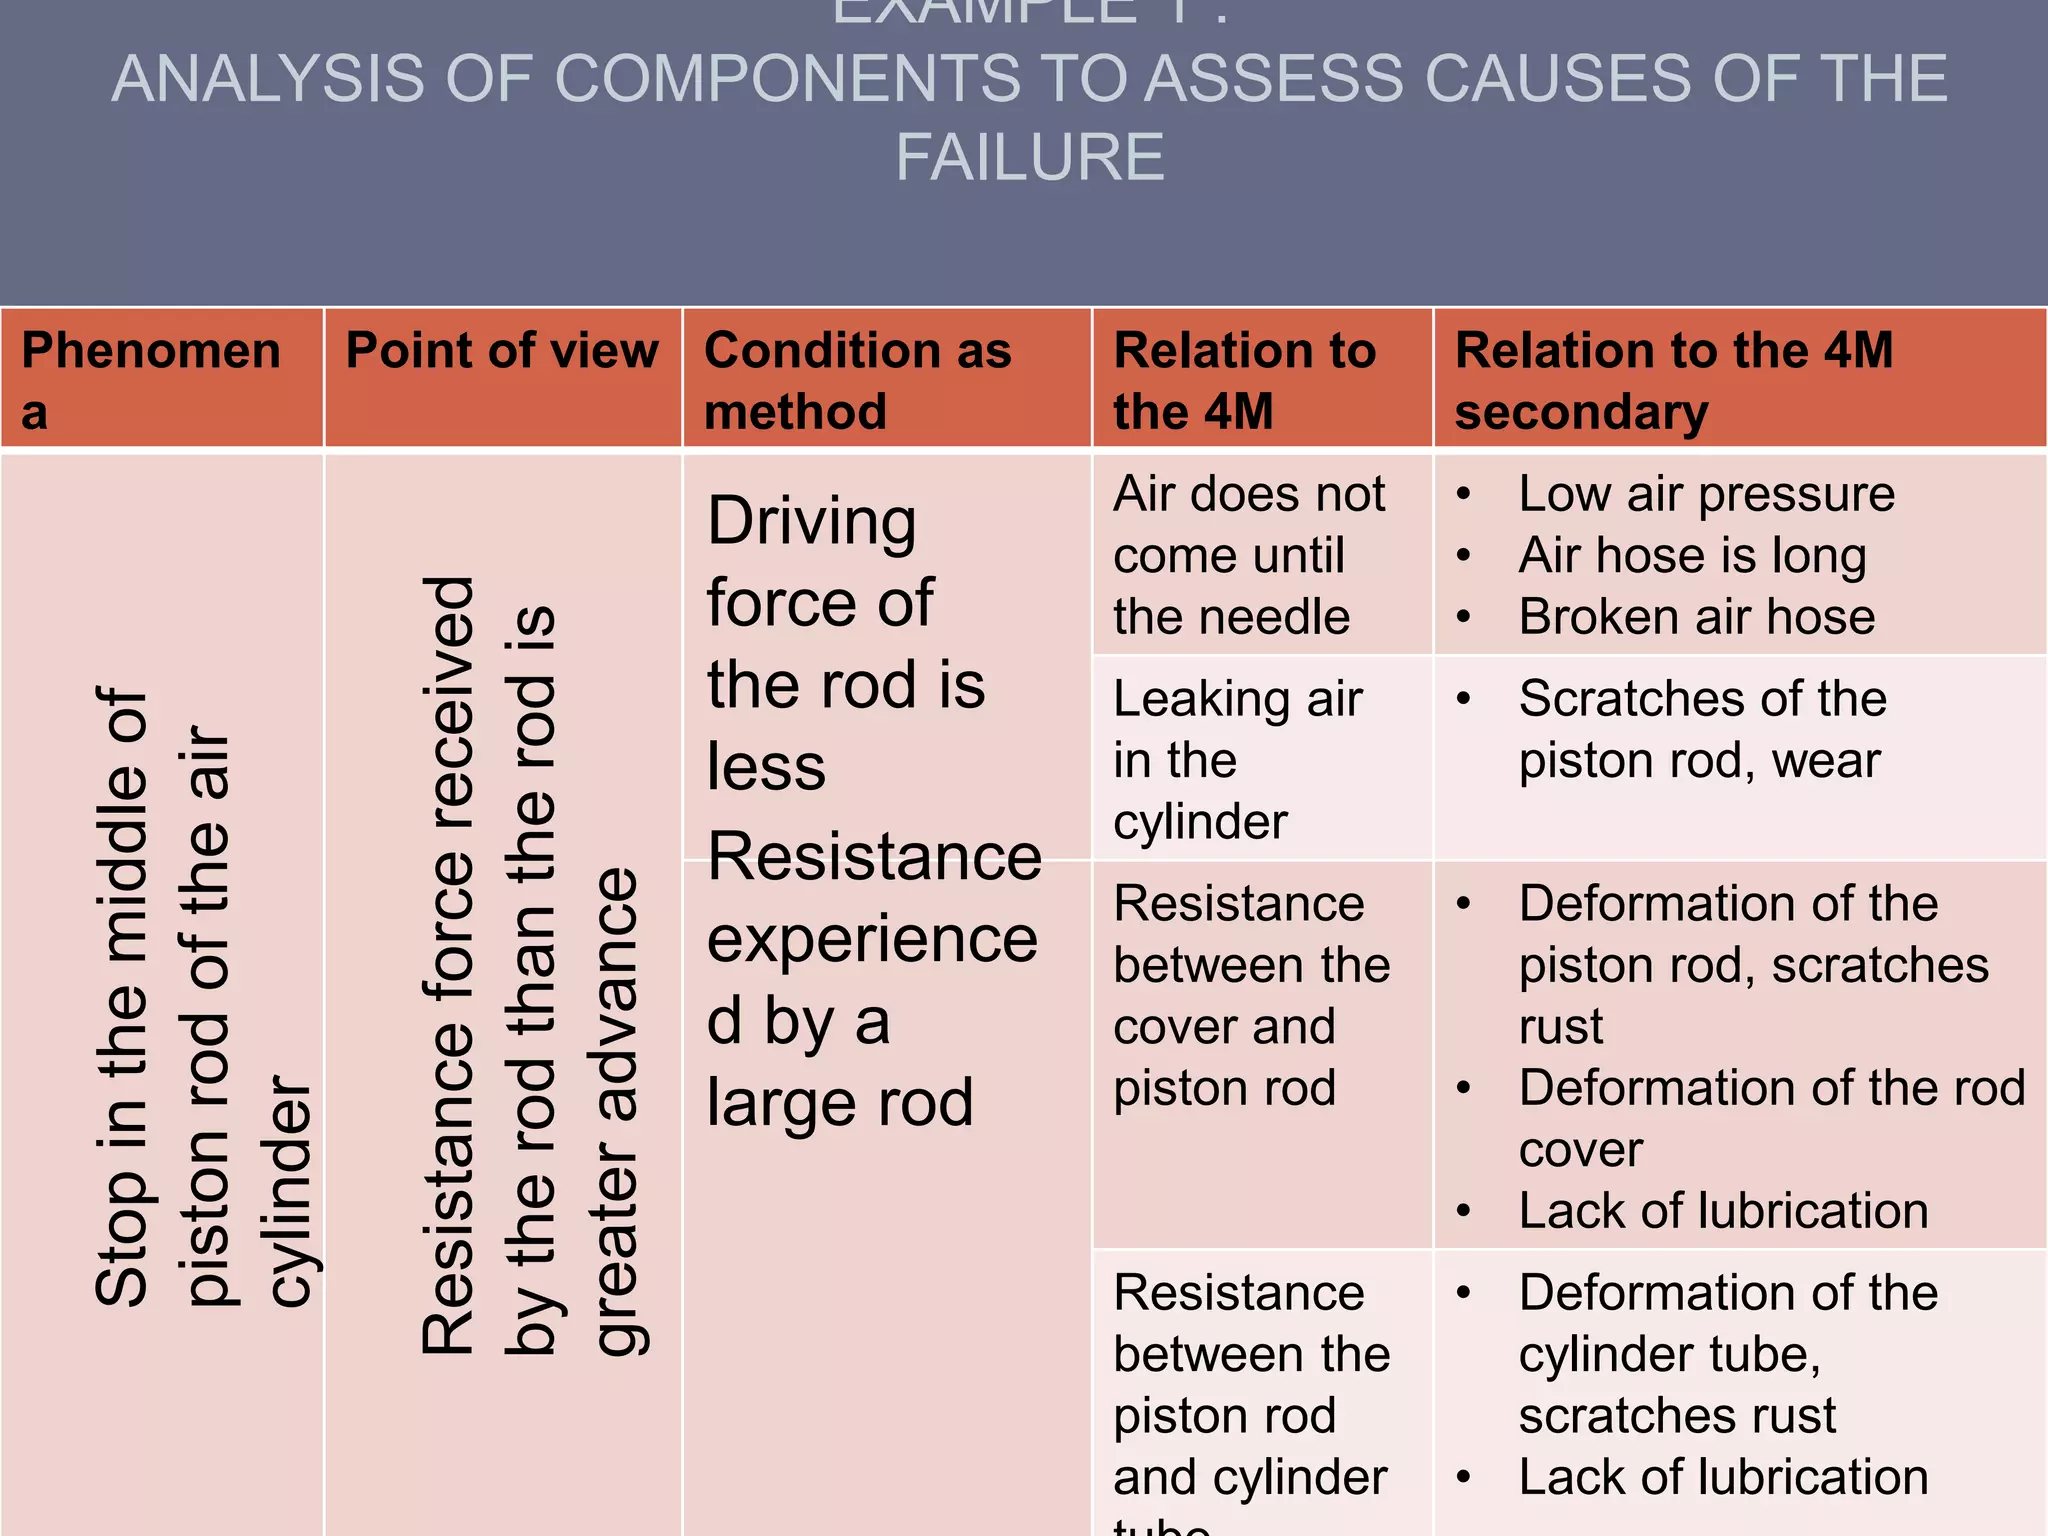
Maintenance Management
Phenomenon & Mechanism Analysis
Presented to : Mr. Amit Phogat By : Bittu
Singh
Asst. Professor Radhe
Kumar
NIFT-Gandhinagar Shubham
Singh
THE TERMITES OF PRODUCTION –
CHRONIC LOSSES
 Chronic Losses – caused by gradual
machine deterioration, but not potent
enough to critically damage machine
in a single occurrence
 Machines are run at slower pace –
avoid breakdown – continual under-
performance
 Becomes the “Cost of doing Business”
– part of the status quo
 Japanese TPM texts – Chronic losses
always account for higher percent
than sporadic losses
Image retrieved from : https://leanmanufacturing.online/losses-costs-
efficiency/
Combination
of factors :
Chronic
Losses
Cause
Cause
Cause
Cause
P-M ANALYSIS : INTRODUCTION
 Developed by Kunio Shiroshe of Japan Institute of Plant Maintenance
 Physically analyses chronic losses according to inherent principles and
natural laws that govern them
 Clarifies the mechanics of their occurrence, and conditions that must be
controlled to prevent them
 Refined variation of Fishbone diagram
 Sequence : Physically analyse chronic problems, Define conditions
underlying abnormal phenomena, Identify factors contributing to
phenomena
Phenomena –
Deviations from
normal to
abnormal state
Physical –
Analysis to
understand the
principles
behind an
abnormal event
P Understand
mechanics of the
problem of abnormal
phenomena – How
they are produced;
Understand the
mechanism of the
equipmentsUnderstand the
relations between
the abnormal
event & the 4
production inputs
(4 M’s) – Machine,
Man, Material,
Method
M
WHEN TO USE P-M ANALYSIS ?
Root Cause Analysis
5-Why Analysis
Singl
e
Caus
e
Multiple
Cause
s
Chronic
Losses
Complex combination
of causes
Bar chart retrieved from : https://leanmanufacturing.online/p-m-analysis-basic/
PM Analysis Vs. Conventional Approach
Approach Conventional
Approach
P-M Analysis
Objective Reduce defects to ½ or
1/3 of their present level
Reduce defects to zero
or get as close as
possible
Concepts • Priority based
• Focus on factor having
greatest impact
• Carry out measures
only
on selected factors.
• Not priority-based
• Think logically; list all
possible factors behind
defects
• Investigate all factors
• Correct all
abnormalities
Methodology Cause-and-effect-
diagram
PM Analysis
Application • Use where defect rate • Use where defect rate
P-M Analysis Steps
1. Clarify the phenomenon
2. Conduct a physical analysis
3. Define the phenomenon’s constituent conditions
4. Study production input correlations (4Ms)
5. Set optimal conditions (standard values)
6. Survey casual factors for abnormalities
7. Determining abnormalities to be addressed
8. Propose and make improvements
1. Clarify the phenomenon
 ‘Phenomenon’ means an occurrence or fact that
can be observed.
 In P-M analysis “clarifying the phenomenon”
means using our observation skills to grasp facts
and illuminate underlying concepts.
 Carefully define and categorize the abnormal
occurrence.
 Without this, P-M analysis may end up missing
the mark.
2. Conduct a physical analysis
 Physical analysis is a logical investigation of
phenomena such as defects or breakdowns that
explains how the phenomena occur in terms
physical principles and quantities.
 Physical analysis explains properly stratified
phenomena from a physical point of view.
 Determines the phenomenon in physical term,
e.g., how the parts or process conditions change
in relation to each other to produce the defect or
failure.
3. Identify constituent conditions
 Identify all the conditions that will consistently produce the
phenomenon.
 It is to review all the conditions that consistently give rise to
the problem.
 These are constituent conditions either necessary or
sufficient for the physical phenomenon analyzed in the
previous step to occur.
 Any constituent condition fall into one of the four categories of
production inputs:
(1) Machine
(2) Man
(3) Material
(4) Methods
4. Study 4Ms for causal factors
 Look for potential cause-and-effect relations between the
constituent conditions and equipment, materials, work
methods, and human factors.
 The constituent condition becomes the “effect,” and review
4M elements for potential “cause”.
 4Ms are further divided into primary 4Ms and secondary
4Ms.
Phenomenon Constituent
Conditions
Primary 4Ms Secondary 4Ms
1. A car engine will not
start.
1. Gasoline is not
supplied to the
engine.
1-1. the fuel system is
without gasoline.
1-1-1. The gasket
between the gas tank
and the fuel line is
worn.
1-1-2. The gas tank is
empty.
2. Electrical power is
not supplied to the
engine.
2-1. The battery is
without power.
2-1-1. A battery cable
is loose.
2-1-2. the battery is
dead
5. Establish optimal conditions(standard
values)
 Review the equipment’s current precision
levels to determine where new or revised
standards are deficient.
 Seek out and identify all abnormalities within
the factors.
6. Survey causal factors and
abnormalities
 Determine the most reliable, efficient ways to measure
the gap between the condition of causal factors
identified in step 3 and 4 and their ideas value
confirmed in step 5.
 Determine the most efficient way to physical survey all
the factors at the machine location.
 Conduct the survey, measuring targeted values and
comparing them to optimal standards to determine
which factors contain abnormalities and thus are
actual causes of defect phenomenon.
7. Determine abnormalities to be
addressed
 Review survey results and list all abnormalities to
be addressed.
 Key to identifying abnormalities:
1. Thoroughly investigate all factors.
2. Compare normal conditions against current
standards.
3. Think in term of optimal conditions, not just
necessary conditions.
4. Understand the causal factors behind each
condition classified as abnormal.
8. Propose and make
improvements
 Final P-M analysis step.
 Team propose and make any corrections and
improvements required for each abnormality,
then plan and institute appropriate preventive
measures.
 Preventive maintenance procedures to
maintain optimal condition.
P-M analysis is unsuccessful
when…
 Some factors are overlooked.
 Abnormalities are not thoroughly identified.
 Accepted standard values are incorrect or
inappropriate.
 Measurement methods are incorrect or
inappropriate.
 The counter measures themselves contain
errors.
P-M ANALYSIS : SUMMARY
Step 1 Classification of the
phenomenon
Perform sufficient
stratified
Step 2 Physical analysis of
phenomenon
Analysis the view point of
physical for phenomena
Step 3 Conditions to reproduce
phenomenon
Study the condition under
which phenomenon can
be reproduced
Step 4 Relevant equipment,
tooling, materials,
methods
Study relevant equipment,
tooling, material, way
Step 5 Study on research
methods
Study the range of
research, methods of
research and
measurement methods
Step 6 Extraction of the problem Creating standard and
measurement
Step 7 Planning of measure Measures for each
problem
EXAMPLE 1 :
ANALYSIS OF COMPONENTS TO ASSESS CAUSES OF THE
FAILURE
Phenomen
a
Point of view Condition as
method
Relation to
the 4M
Relation to the 4M
secondary
Air does not
come until
the needle
• Low air pressure
• Air hose is long
• Broken air hose
Leaking air
in the
cylinder
• Scratches of the
piston rod, wear
Resistance
between the
cover and
piston rod
• Deformation of the
piston rod, scratches
rust
• Deformation of the rod
cover
• Lack of lubrication
Resistance
between the
piston rod
and cylinder
• Deformation of the
cylinder tube,
scratches rust
• Lack of lubrication
Stopinthemiddleof
pistonrodoftheair
cylinder
Resistanceforcereceived
bytherodthantherodis
greateradvance
Driving
force of
the rod is
less
Resistance
experience
d by a
large rod
EXAMPLE 2 : P-M ANALYSIS TABLE
Turbine shaft Occurrence and
frequency
By theory and by
drawing to analyse
the phenomena
Machine No. Failure occurs and
sometimes non-
standard for large
ellipse in the
process
Changing the
distance b/w the
centre of the
grinding wheel and
the work piece
NC cylindrical
grinder
Established
conditions
Relevance of the
methods and
materials, equipment
and tooling
Secon
d
investi
gation
Item
(drawing)
Second
item
(part
Position
changes
the
centre of
the
Loose
measure
ment
during
clampin
N
G
N
G
-1 wear
n/d clamp
1-1-2 wear
cam
….
….
1-1-5
NG
NG
NG
NG
OK
Exchang
e
Exchang
e
Exchang
e
Exchang
e
Ok
Ok
Ok
Ok
Measur
es
Sectio
nResult
Thefirstsurvey
items
Toleranc
e
Less0.002
mmImpac
t
Hig
h
Measured0.001mm
Survey
results
Looseness
ofthe
clamp
Judgeme
nt
Judgeme
nt
REFERENCES
 Terry Wireman Blog Series. Chronic vs. Sporadic Failure. Retrieved
from : SAP Partner - VestaPartners.com
 Kunio S., Kaneda M. & Kimura Y. P-M Analysis : An Advanced Step
In TPM Implementation. What is P-M Analysis? Page 18. CRC
Press. Retrieved from : Google Books
 Willmott P. & McCarthy D. TPM : A Route to World Class
Manufacturing. P-M Analysis. Page 104. Newnes Publishers.
Retrieved from : Google Books
 P-M Analysis Basics. Retrieved from : LeanManufacturing.online
 Arai K. TPM for the Lean Factory. Phenomenon, Mechanisms &
Causes. Page 3-33. Routledge Publishers. Retrieved from : Google
Books
 Monma H. PM Analysis. 4 March, 2015. Retrieved from : Japanese
Gemba Kaizen Web
Thank You!

Phenomenon & Mechanism Analysis

  • 1.
    Maintenance Management Phenomenon &Mechanism Analysis Presented to : Mr. Amit Phogat By : Bittu Singh Asst. Professor Radhe Kumar NIFT-Gandhinagar Shubham Singh
  • 2.
    THE TERMITES OFPRODUCTION – CHRONIC LOSSES  Chronic Losses – caused by gradual machine deterioration, but not potent enough to critically damage machine in a single occurrence  Machines are run at slower pace – avoid breakdown – continual under- performance  Becomes the “Cost of doing Business” – part of the status quo  Japanese TPM texts – Chronic losses always account for higher percent than sporadic losses Image retrieved from : https://leanmanufacturing.online/losses-costs- efficiency/ Combination of factors : Chronic Losses Cause Cause Cause Cause
  • 3.
    P-M ANALYSIS :INTRODUCTION  Developed by Kunio Shiroshe of Japan Institute of Plant Maintenance  Physically analyses chronic losses according to inherent principles and natural laws that govern them  Clarifies the mechanics of their occurrence, and conditions that must be controlled to prevent them  Refined variation of Fishbone diagram  Sequence : Physically analyse chronic problems, Define conditions underlying abnormal phenomena, Identify factors contributing to phenomena Phenomena – Deviations from normal to abnormal state Physical – Analysis to understand the principles behind an abnormal event P Understand mechanics of the problem of abnormal phenomena – How they are produced; Understand the mechanism of the equipmentsUnderstand the relations between the abnormal event & the 4 production inputs (4 M’s) – Machine, Man, Material, Method M
  • 4.
    WHEN TO USEP-M ANALYSIS ? Root Cause Analysis 5-Why Analysis Singl e Caus e Multiple Cause s Chronic Losses Complex combination of causes Bar chart retrieved from : https://leanmanufacturing.online/p-m-analysis-basic/
  • 5.
    PM Analysis Vs.Conventional Approach Approach Conventional Approach P-M Analysis Objective Reduce defects to ½ or 1/3 of their present level Reduce defects to zero or get as close as possible Concepts • Priority based • Focus on factor having greatest impact • Carry out measures only on selected factors. • Not priority-based • Think logically; list all possible factors behind defects • Investigate all factors • Correct all abnormalities Methodology Cause-and-effect- diagram PM Analysis Application • Use where defect rate • Use where defect rate
  • 6.
    P-M Analysis Steps 1.Clarify the phenomenon 2. Conduct a physical analysis 3. Define the phenomenon’s constituent conditions 4. Study production input correlations (4Ms) 5. Set optimal conditions (standard values) 6. Survey casual factors for abnormalities 7. Determining abnormalities to be addressed 8. Propose and make improvements
  • 7.
    1. Clarify thephenomenon  ‘Phenomenon’ means an occurrence or fact that can be observed.  In P-M analysis “clarifying the phenomenon” means using our observation skills to grasp facts and illuminate underlying concepts.  Carefully define and categorize the abnormal occurrence.  Without this, P-M analysis may end up missing the mark.
  • 8.
    2. Conduct aphysical analysis  Physical analysis is a logical investigation of phenomena such as defects or breakdowns that explains how the phenomena occur in terms physical principles and quantities.  Physical analysis explains properly stratified phenomena from a physical point of view.  Determines the phenomenon in physical term, e.g., how the parts or process conditions change in relation to each other to produce the defect or failure.
  • 9.
    3. Identify constituentconditions  Identify all the conditions that will consistently produce the phenomenon.  It is to review all the conditions that consistently give rise to the problem.  These are constituent conditions either necessary or sufficient for the physical phenomenon analyzed in the previous step to occur.  Any constituent condition fall into one of the four categories of production inputs: (1) Machine (2) Man (3) Material (4) Methods
  • 10.
    4. Study 4Msfor causal factors  Look for potential cause-and-effect relations between the constituent conditions and equipment, materials, work methods, and human factors.  The constituent condition becomes the “effect,” and review 4M elements for potential “cause”.  4Ms are further divided into primary 4Ms and secondary 4Ms. Phenomenon Constituent Conditions Primary 4Ms Secondary 4Ms 1. A car engine will not start. 1. Gasoline is not supplied to the engine. 1-1. the fuel system is without gasoline. 1-1-1. The gasket between the gas tank and the fuel line is worn. 1-1-2. The gas tank is empty. 2. Electrical power is not supplied to the engine. 2-1. The battery is without power. 2-1-1. A battery cable is loose. 2-1-2. the battery is dead
  • 11.
    5. Establish optimalconditions(standard values)  Review the equipment’s current precision levels to determine where new or revised standards are deficient.  Seek out and identify all abnormalities within the factors.
  • 12.
    6. Survey causalfactors and abnormalities  Determine the most reliable, efficient ways to measure the gap between the condition of causal factors identified in step 3 and 4 and their ideas value confirmed in step 5.  Determine the most efficient way to physical survey all the factors at the machine location.  Conduct the survey, measuring targeted values and comparing them to optimal standards to determine which factors contain abnormalities and thus are actual causes of defect phenomenon.
  • 13.
    7. Determine abnormalitiesto be addressed  Review survey results and list all abnormalities to be addressed.  Key to identifying abnormalities: 1. Thoroughly investigate all factors. 2. Compare normal conditions against current standards. 3. Think in term of optimal conditions, not just necessary conditions. 4. Understand the causal factors behind each condition classified as abnormal.
  • 14.
    8. Propose andmake improvements  Final P-M analysis step.  Team propose and make any corrections and improvements required for each abnormality, then plan and institute appropriate preventive measures.  Preventive maintenance procedures to maintain optimal condition.
  • 15.
    P-M analysis isunsuccessful when…  Some factors are overlooked.  Abnormalities are not thoroughly identified.  Accepted standard values are incorrect or inappropriate.  Measurement methods are incorrect or inappropriate.  The counter measures themselves contain errors.
  • 16.
    P-M ANALYSIS :SUMMARY Step 1 Classification of the phenomenon Perform sufficient stratified Step 2 Physical analysis of phenomenon Analysis the view point of physical for phenomena Step 3 Conditions to reproduce phenomenon Study the condition under which phenomenon can be reproduced Step 4 Relevant equipment, tooling, materials, methods Study relevant equipment, tooling, material, way Step 5 Study on research methods Study the range of research, methods of research and measurement methods Step 6 Extraction of the problem Creating standard and measurement Step 7 Planning of measure Measures for each problem
  • 17.
    EXAMPLE 1 : ANALYSISOF COMPONENTS TO ASSESS CAUSES OF THE FAILURE Phenomen a Point of view Condition as method Relation to the 4M Relation to the 4M secondary Air does not come until the needle • Low air pressure • Air hose is long • Broken air hose Leaking air in the cylinder • Scratches of the piston rod, wear Resistance between the cover and piston rod • Deformation of the piston rod, scratches rust • Deformation of the rod cover • Lack of lubrication Resistance between the piston rod and cylinder • Deformation of the cylinder tube, scratches rust • Lack of lubrication Stopinthemiddleof pistonrodoftheair cylinder Resistanceforcereceived bytherodthantherodis greateradvance Driving force of the rod is less Resistance experience d by a large rod
  • 18.
    EXAMPLE 2 :P-M ANALYSIS TABLE Turbine shaft Occurrence and frequency By theory and by drawing to analyse the phenomena Machine No. Failure occurs and sometimes non- standard for large ellipse in the process Changing the distance b/w the centre of the grinding wheel and the work piece NC cylindrical grinder Established conditions Relevance of the methods and materials, equipment and tooling Secon d investi gation Item (drawing) Second item (part Position changes the centre of the Loose measure ment during clampin N G N G -1 wear n/d clamp 1-1-2 wear cam …. …. 1-1-5 NG NG NG NG OK Exchang e Exchang e Exchang e Exchang e Ok Ok Ok Ok Measur es Sectio nResult Thefirstsurvey items Toleranc e Less0.002 mmImpac t Hig h Measured0.001mm Survey results Looseness ofthe clamp Judgeme nt Judgeme nt
  • 19.
    REFERENCES  Terry WiremanBlog Series. Chronic vs. Sporadic Failure. Retrieved from : SAP Partner - VestaPartners.com  Kunio S., Kaneda M. & Kimura Y. P-M Analysis : An Advanced Step In TPM Implementation. What is P-M Analysis? Page 18. CRC Press. Retrieved from : Google Books  Willmott P. & McCarthy D. TPM : A Route to World Class Manufacturing. P-M Analysis. Page 104. Newnes Publishers. Retrieved from : Google Books  P-M Analysis Basics. Retrieved from : LeanManufacturing.online  Arai K. TPM for the Lean Factory. Phenomenon, Mechanisms & Causes. Page 3-33. Routledge Publishers. Retrieved from : Google Books  Monma H. PM Analysis. 4 March, 2015. Retrieved from : Japanese Gemba Kaizen Web
  • 20.