Download as PDF, PPTX


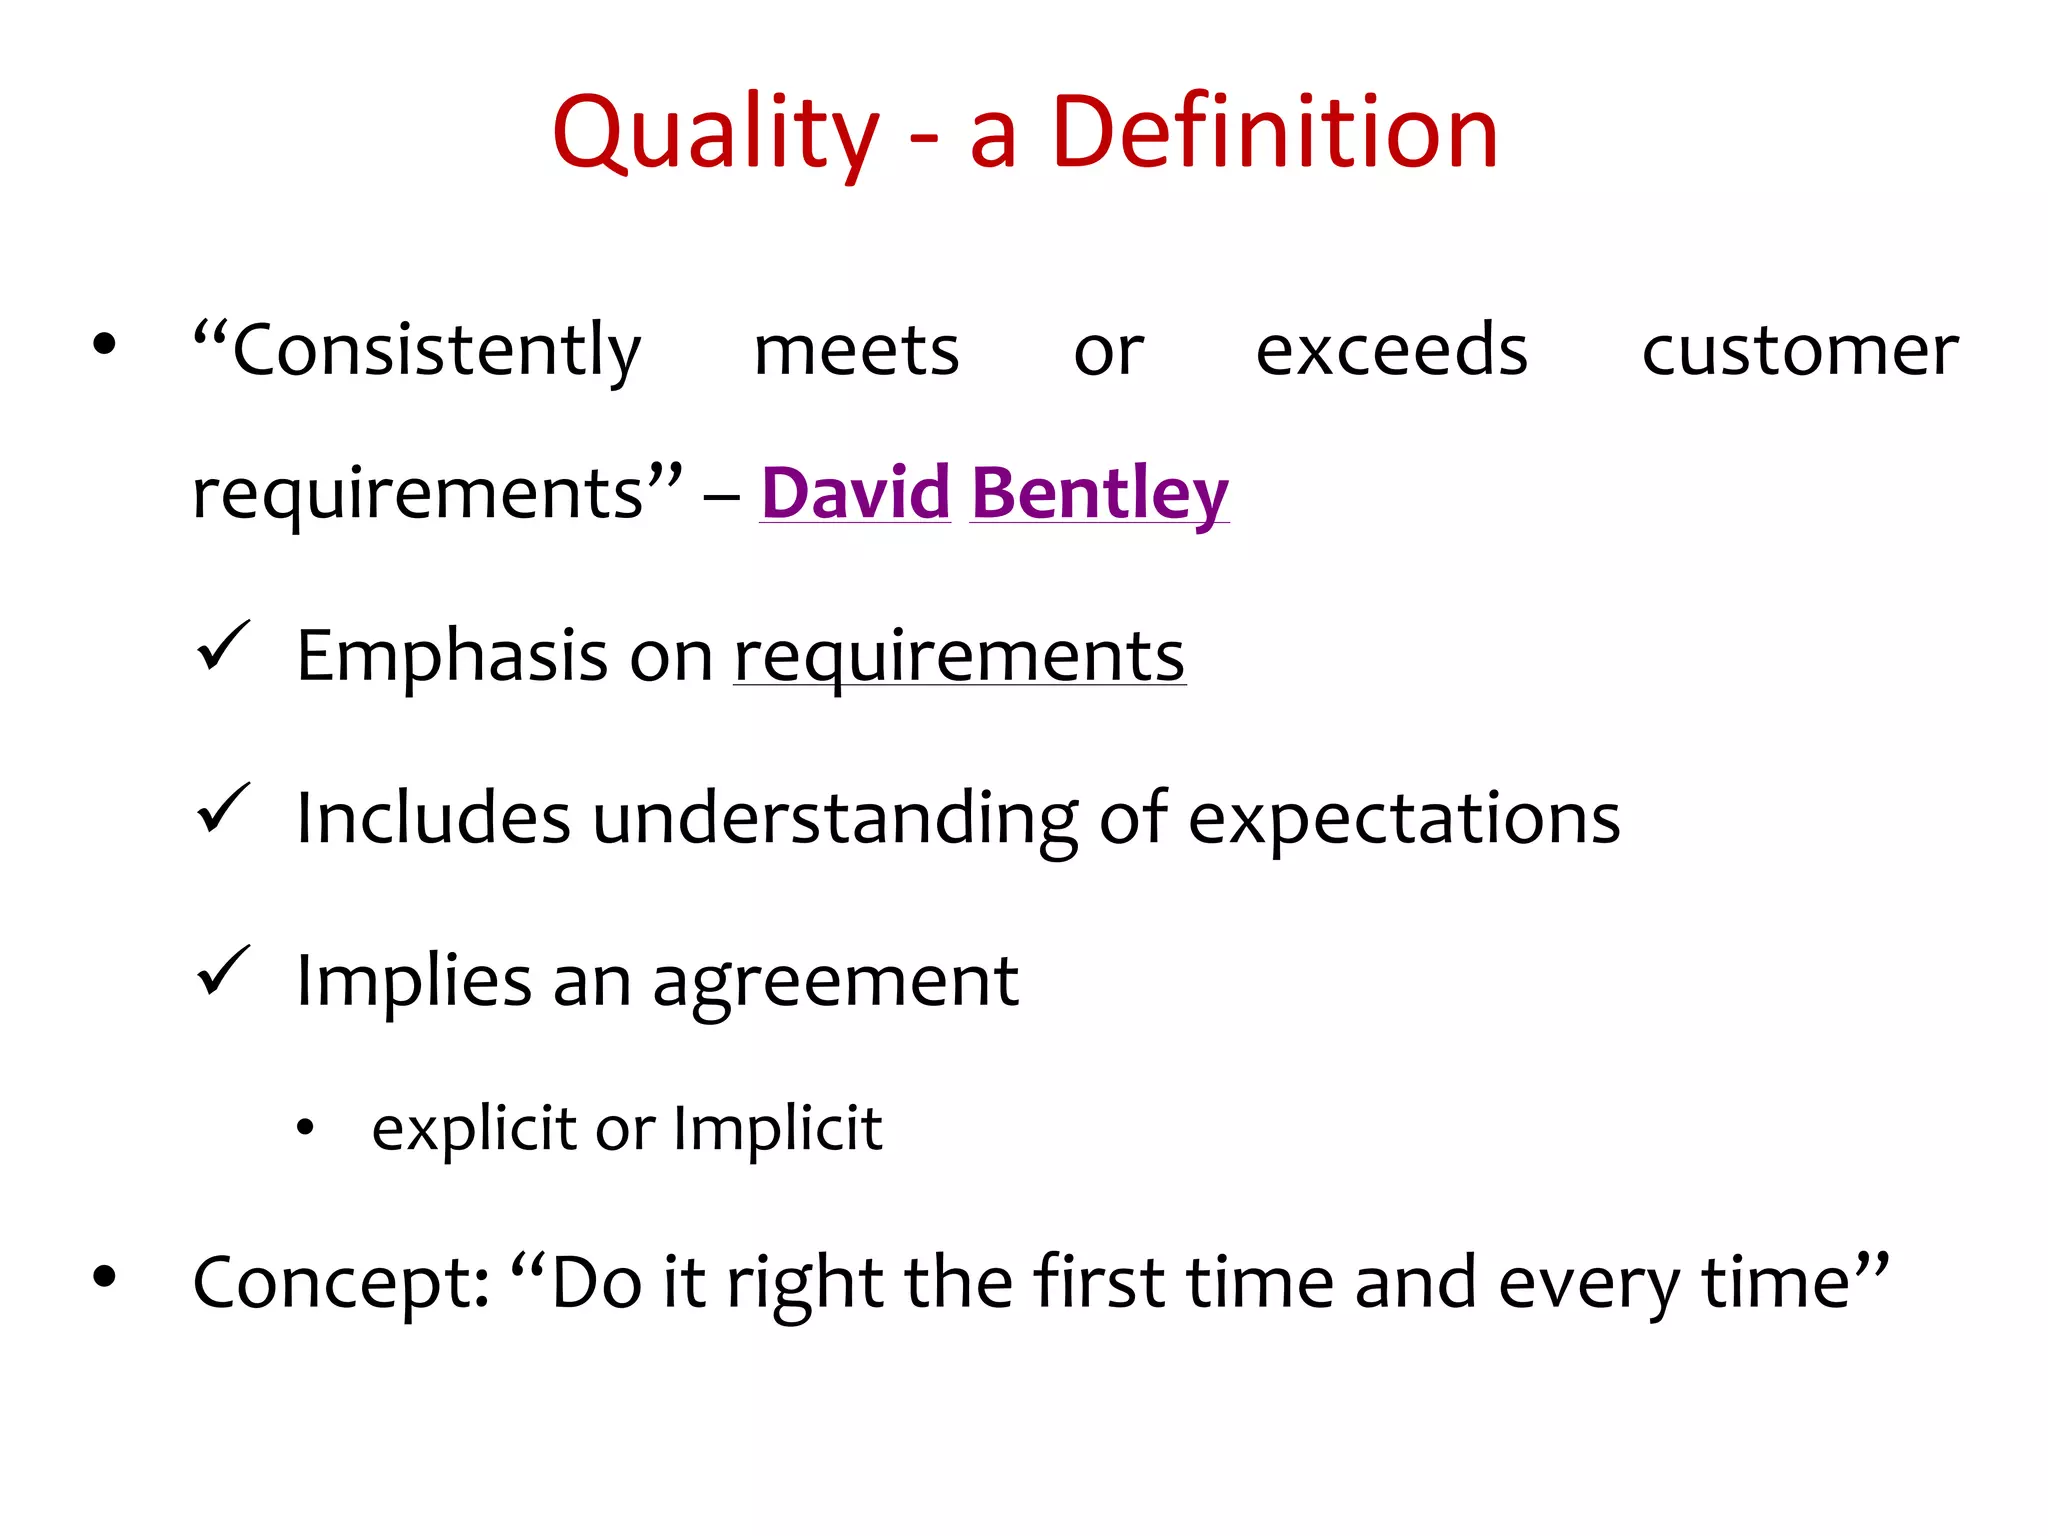
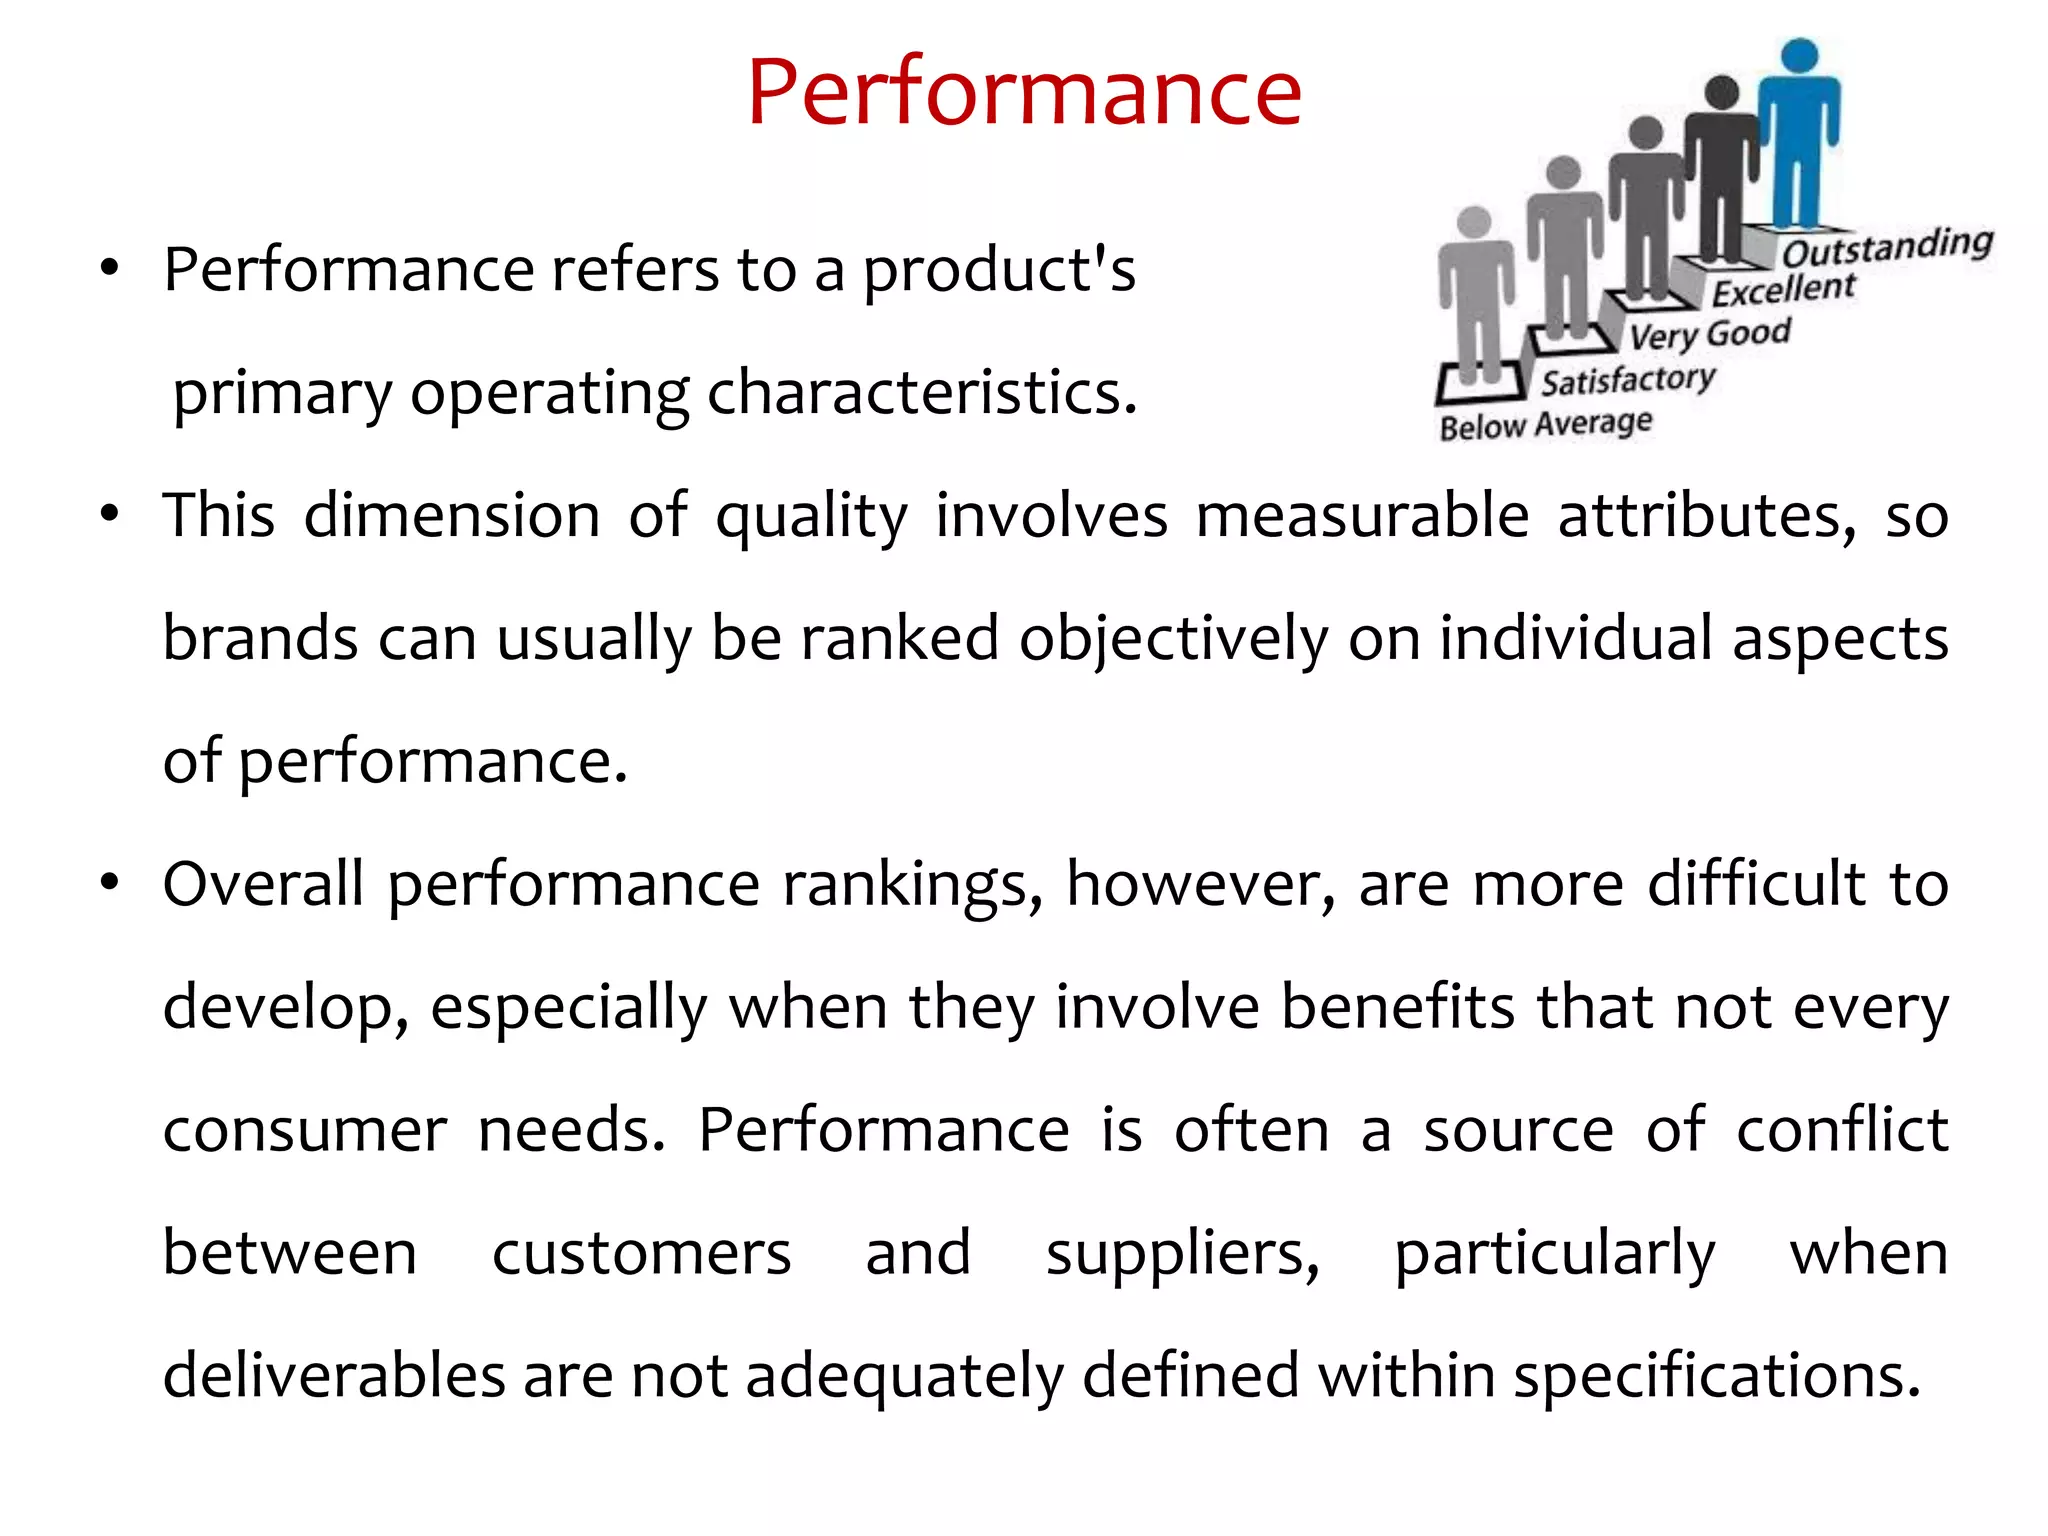


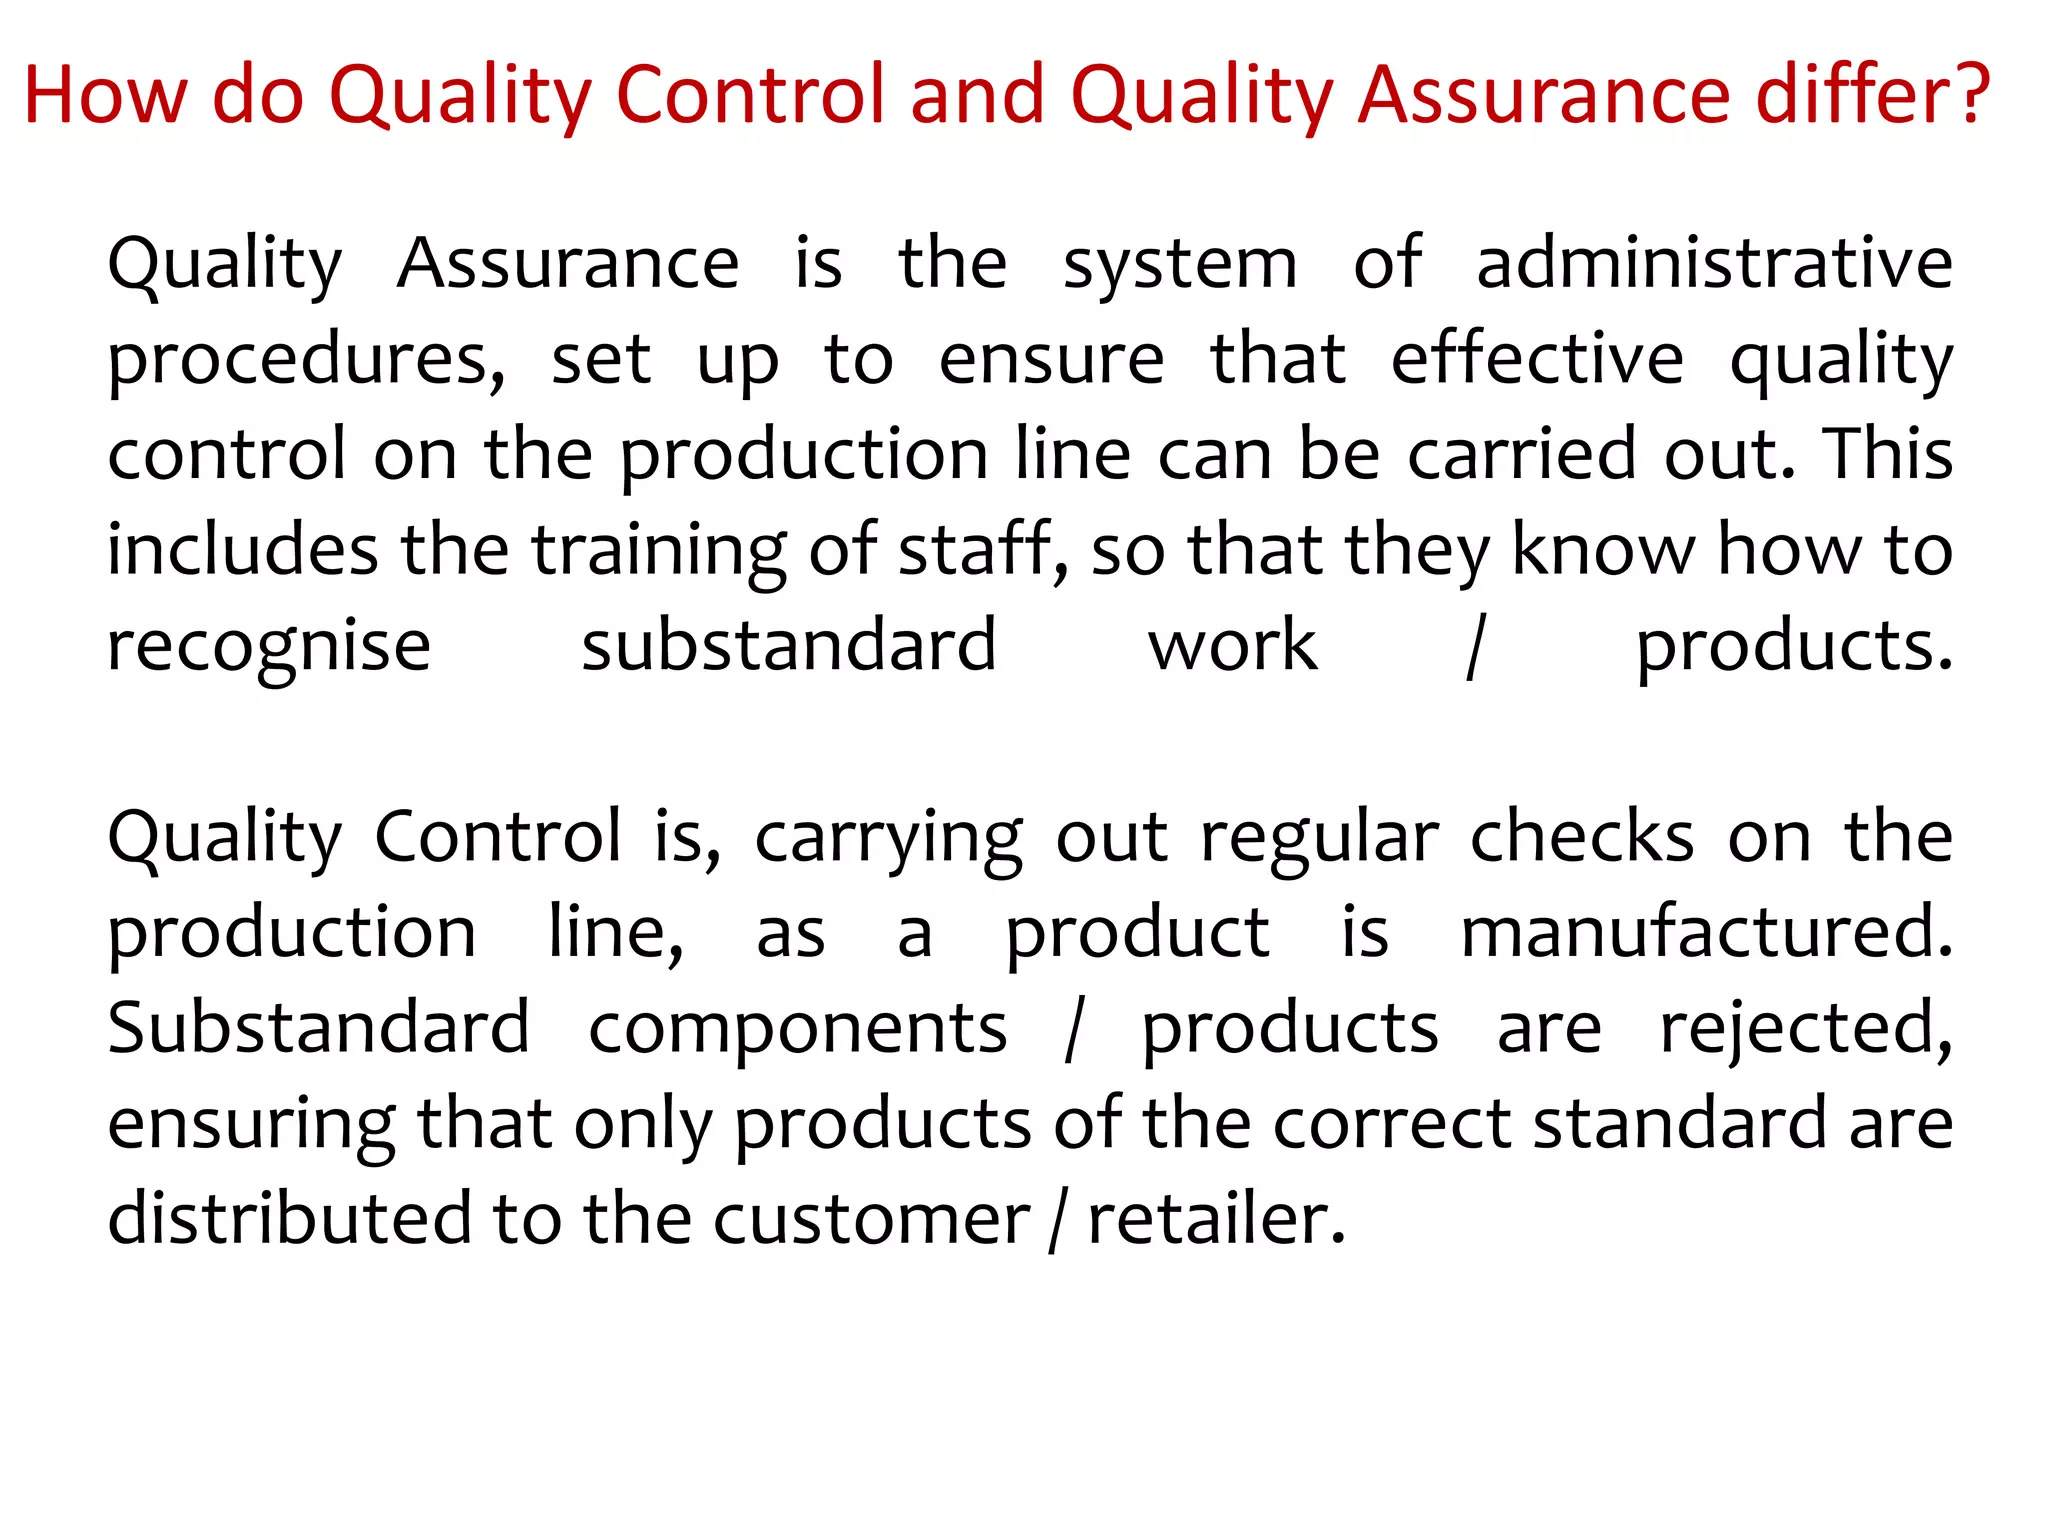


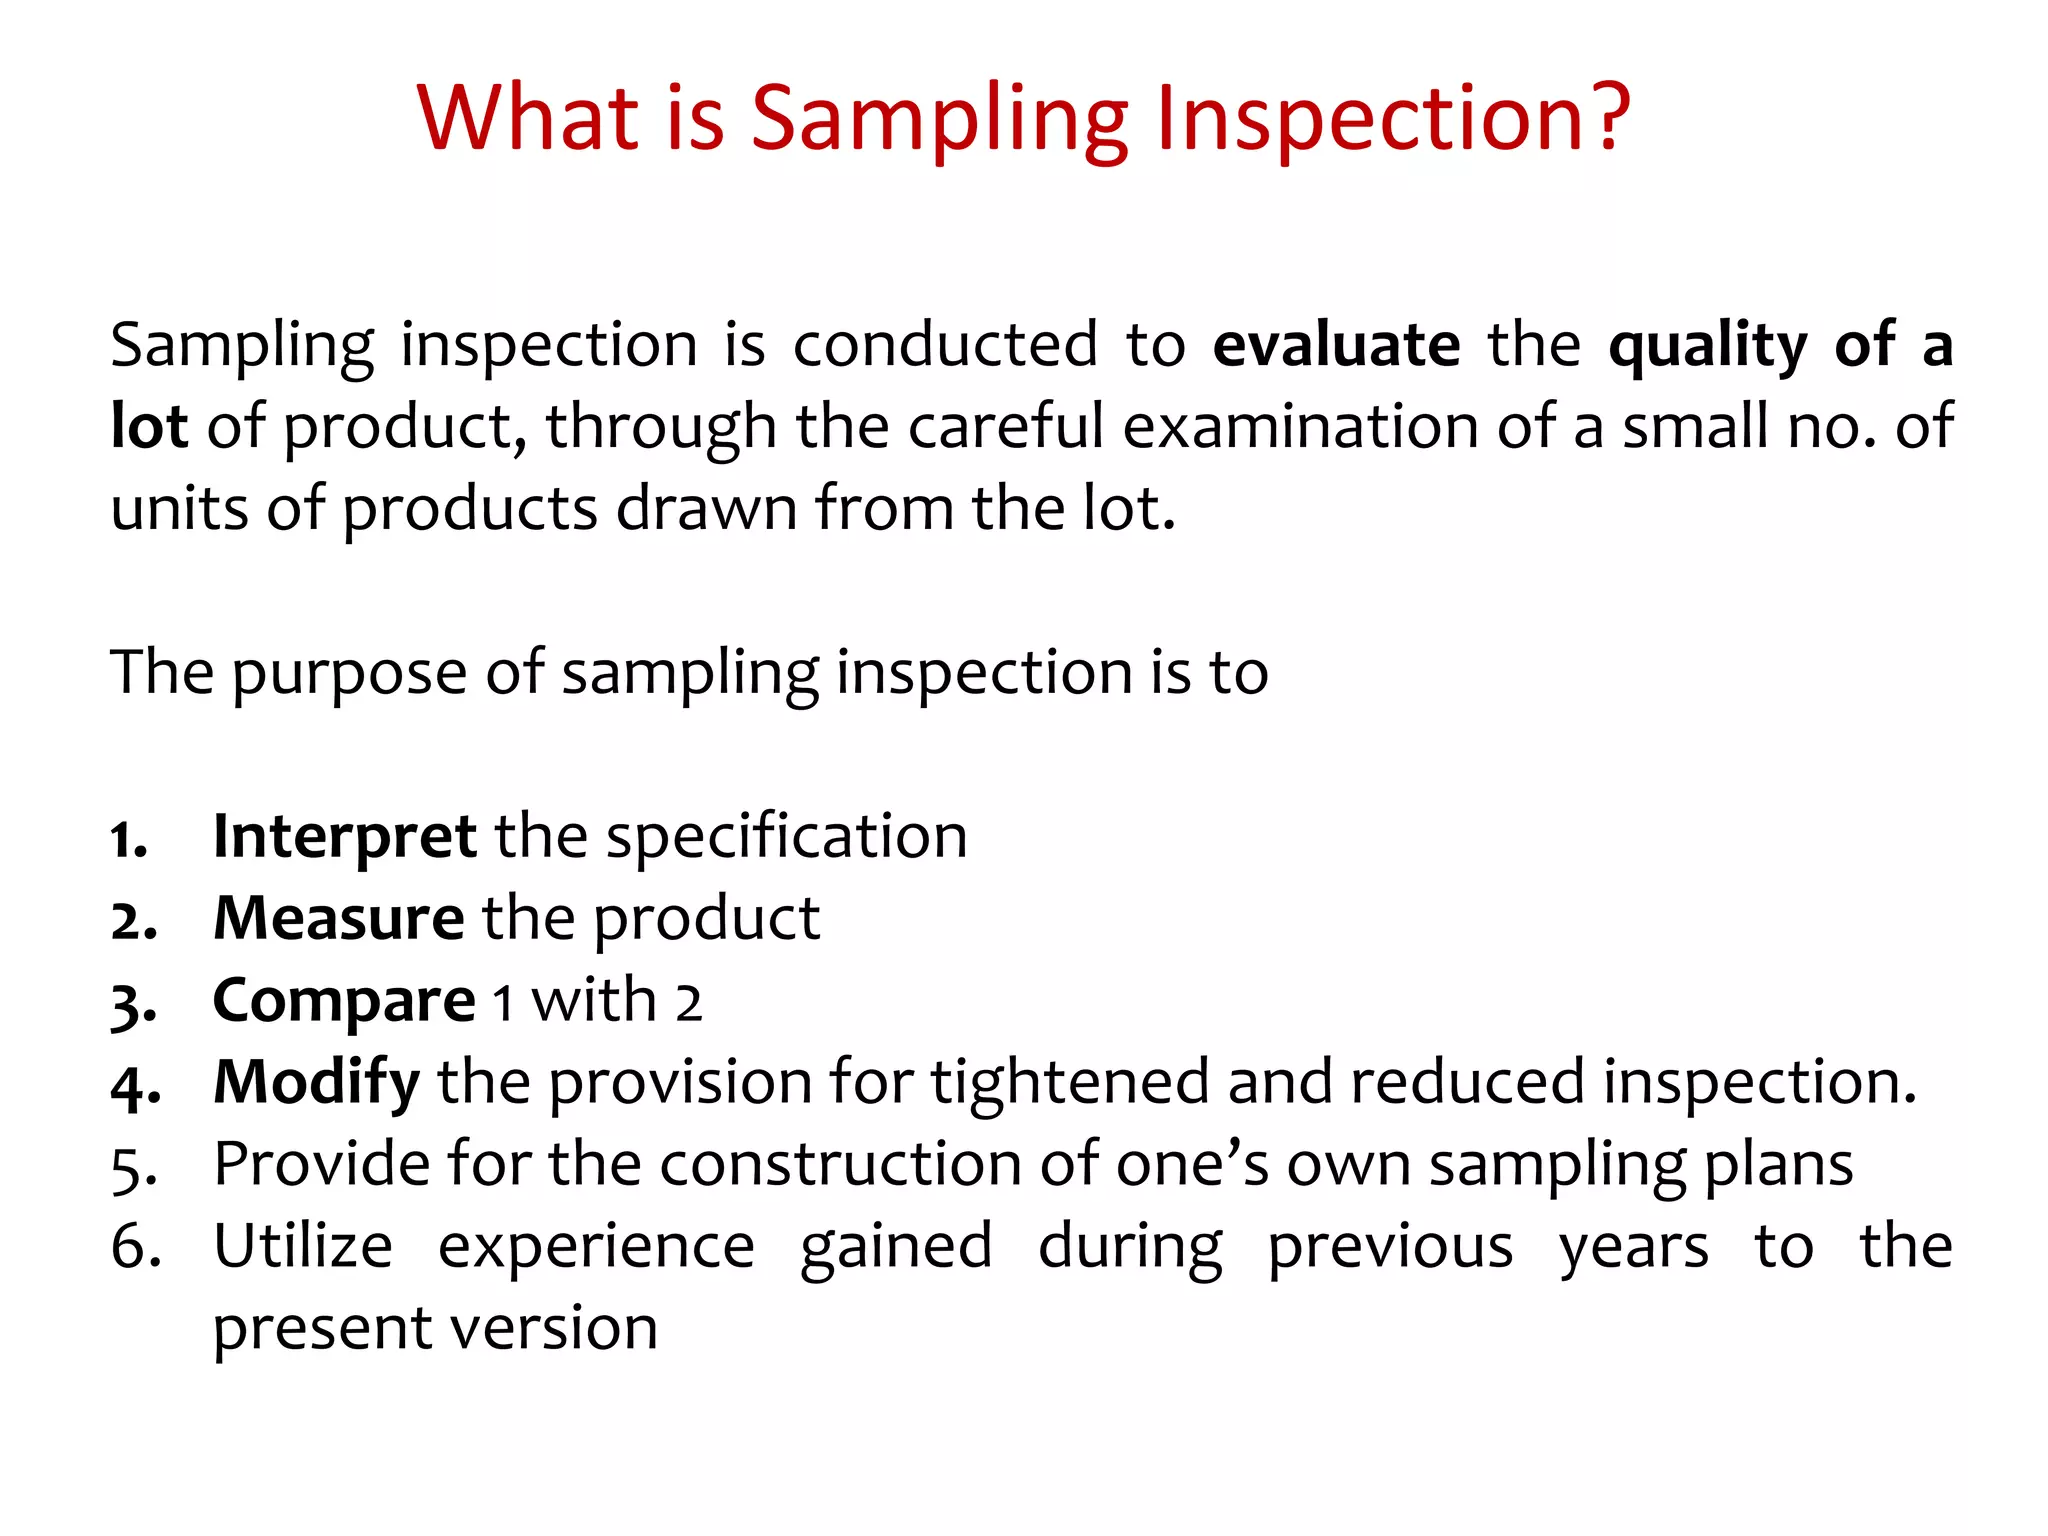

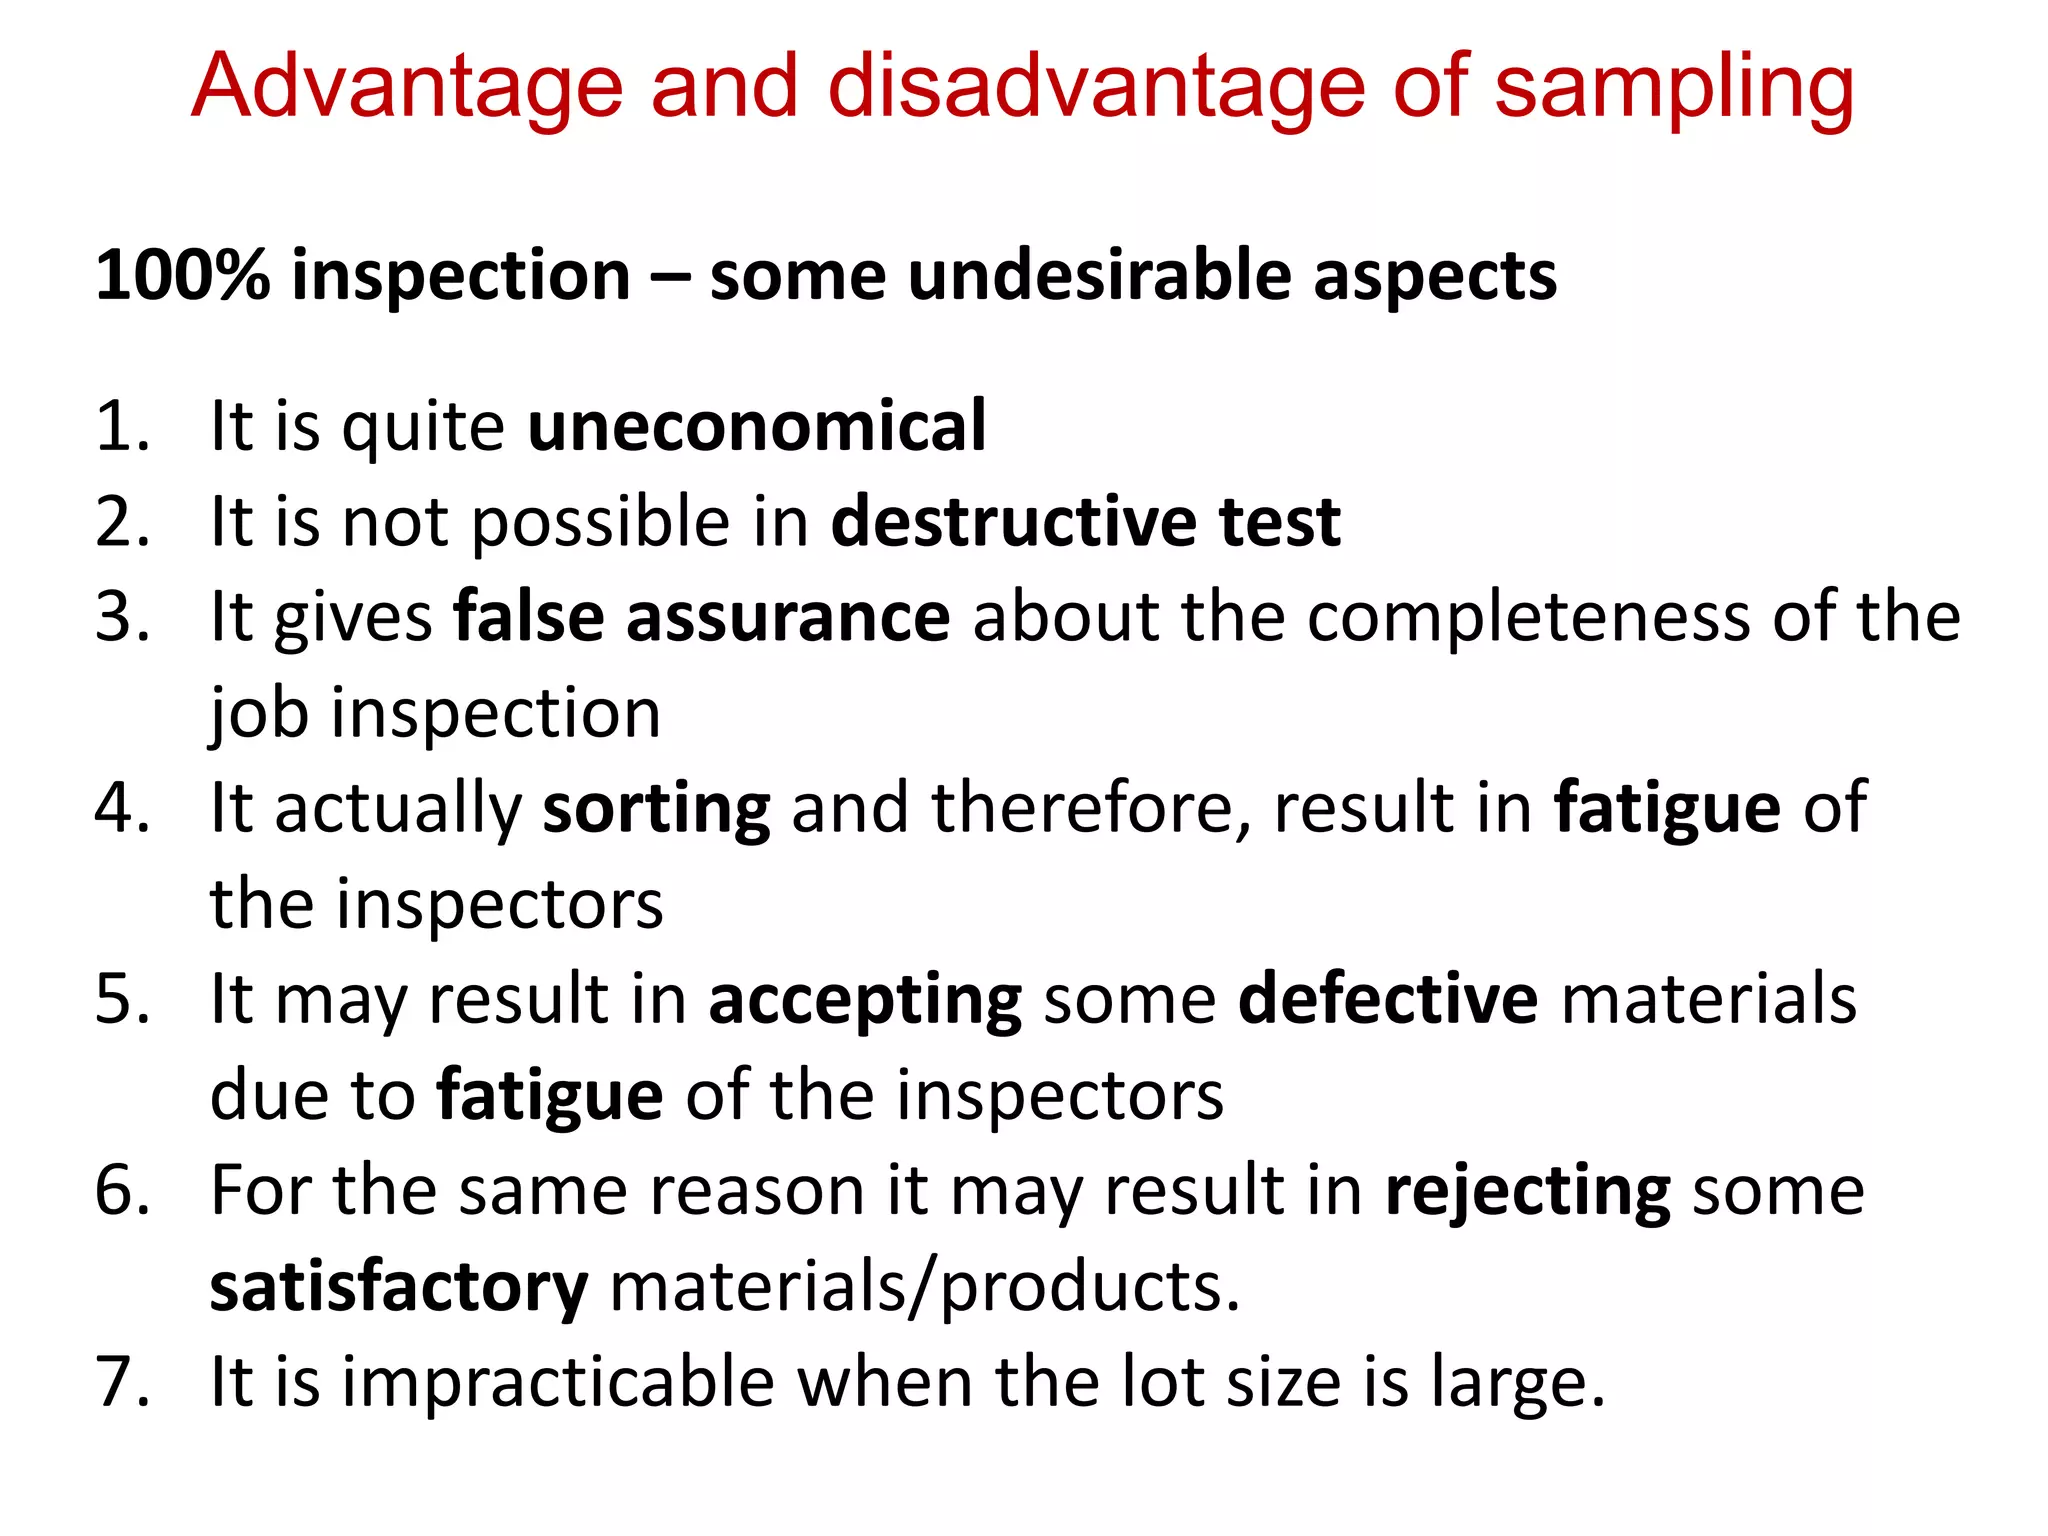


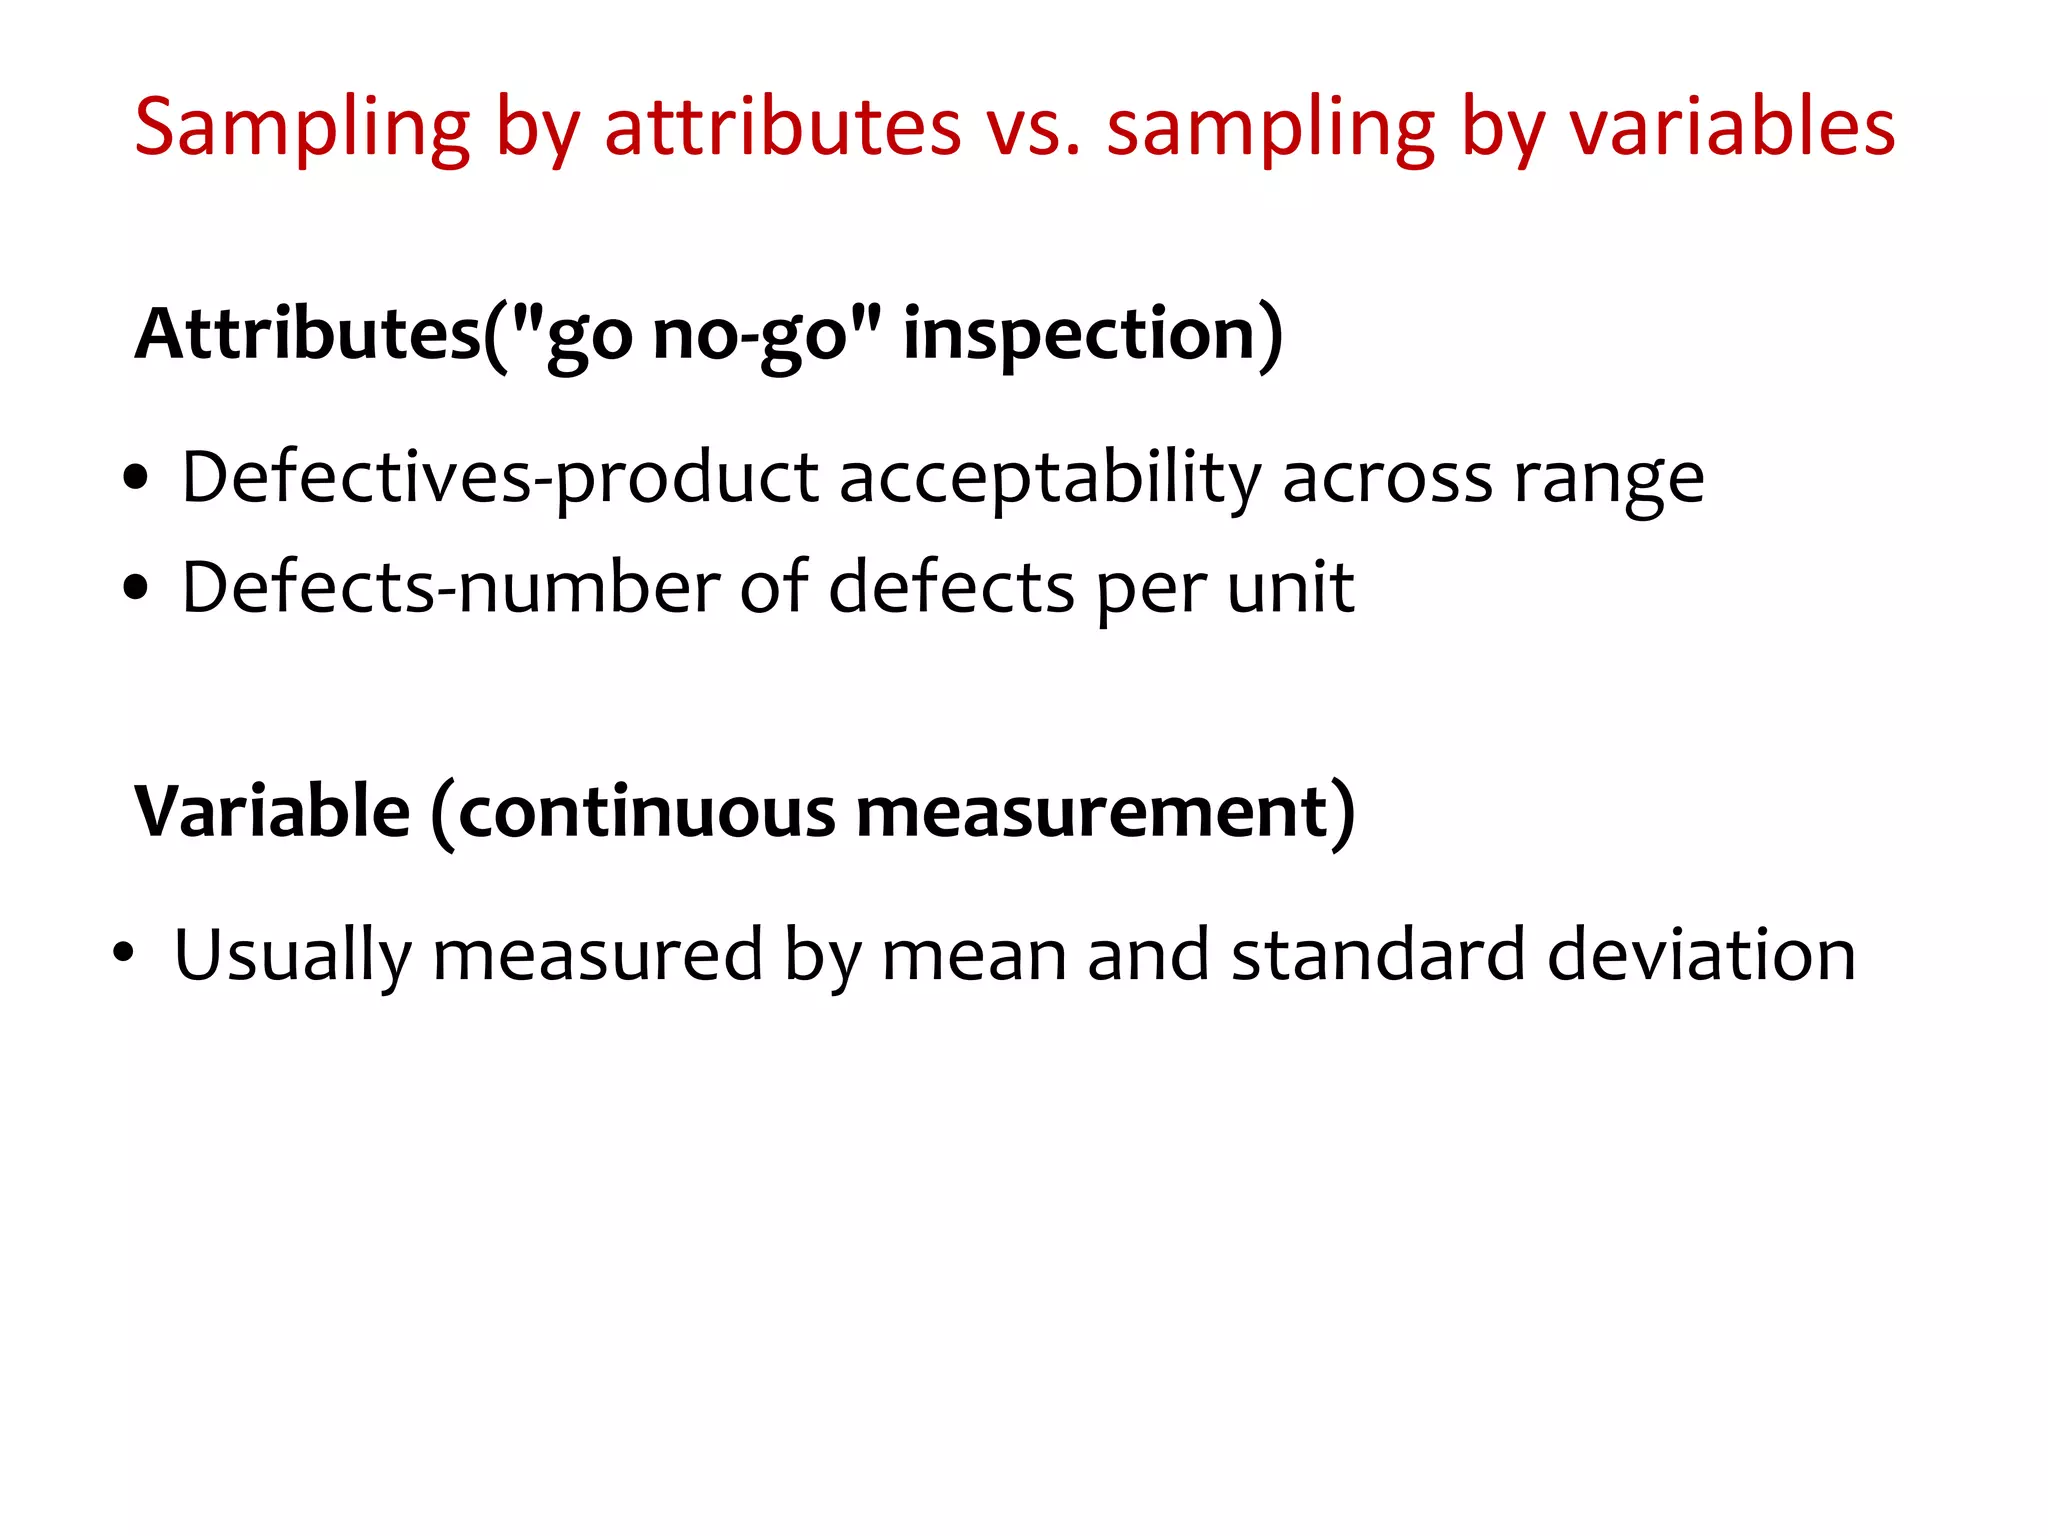


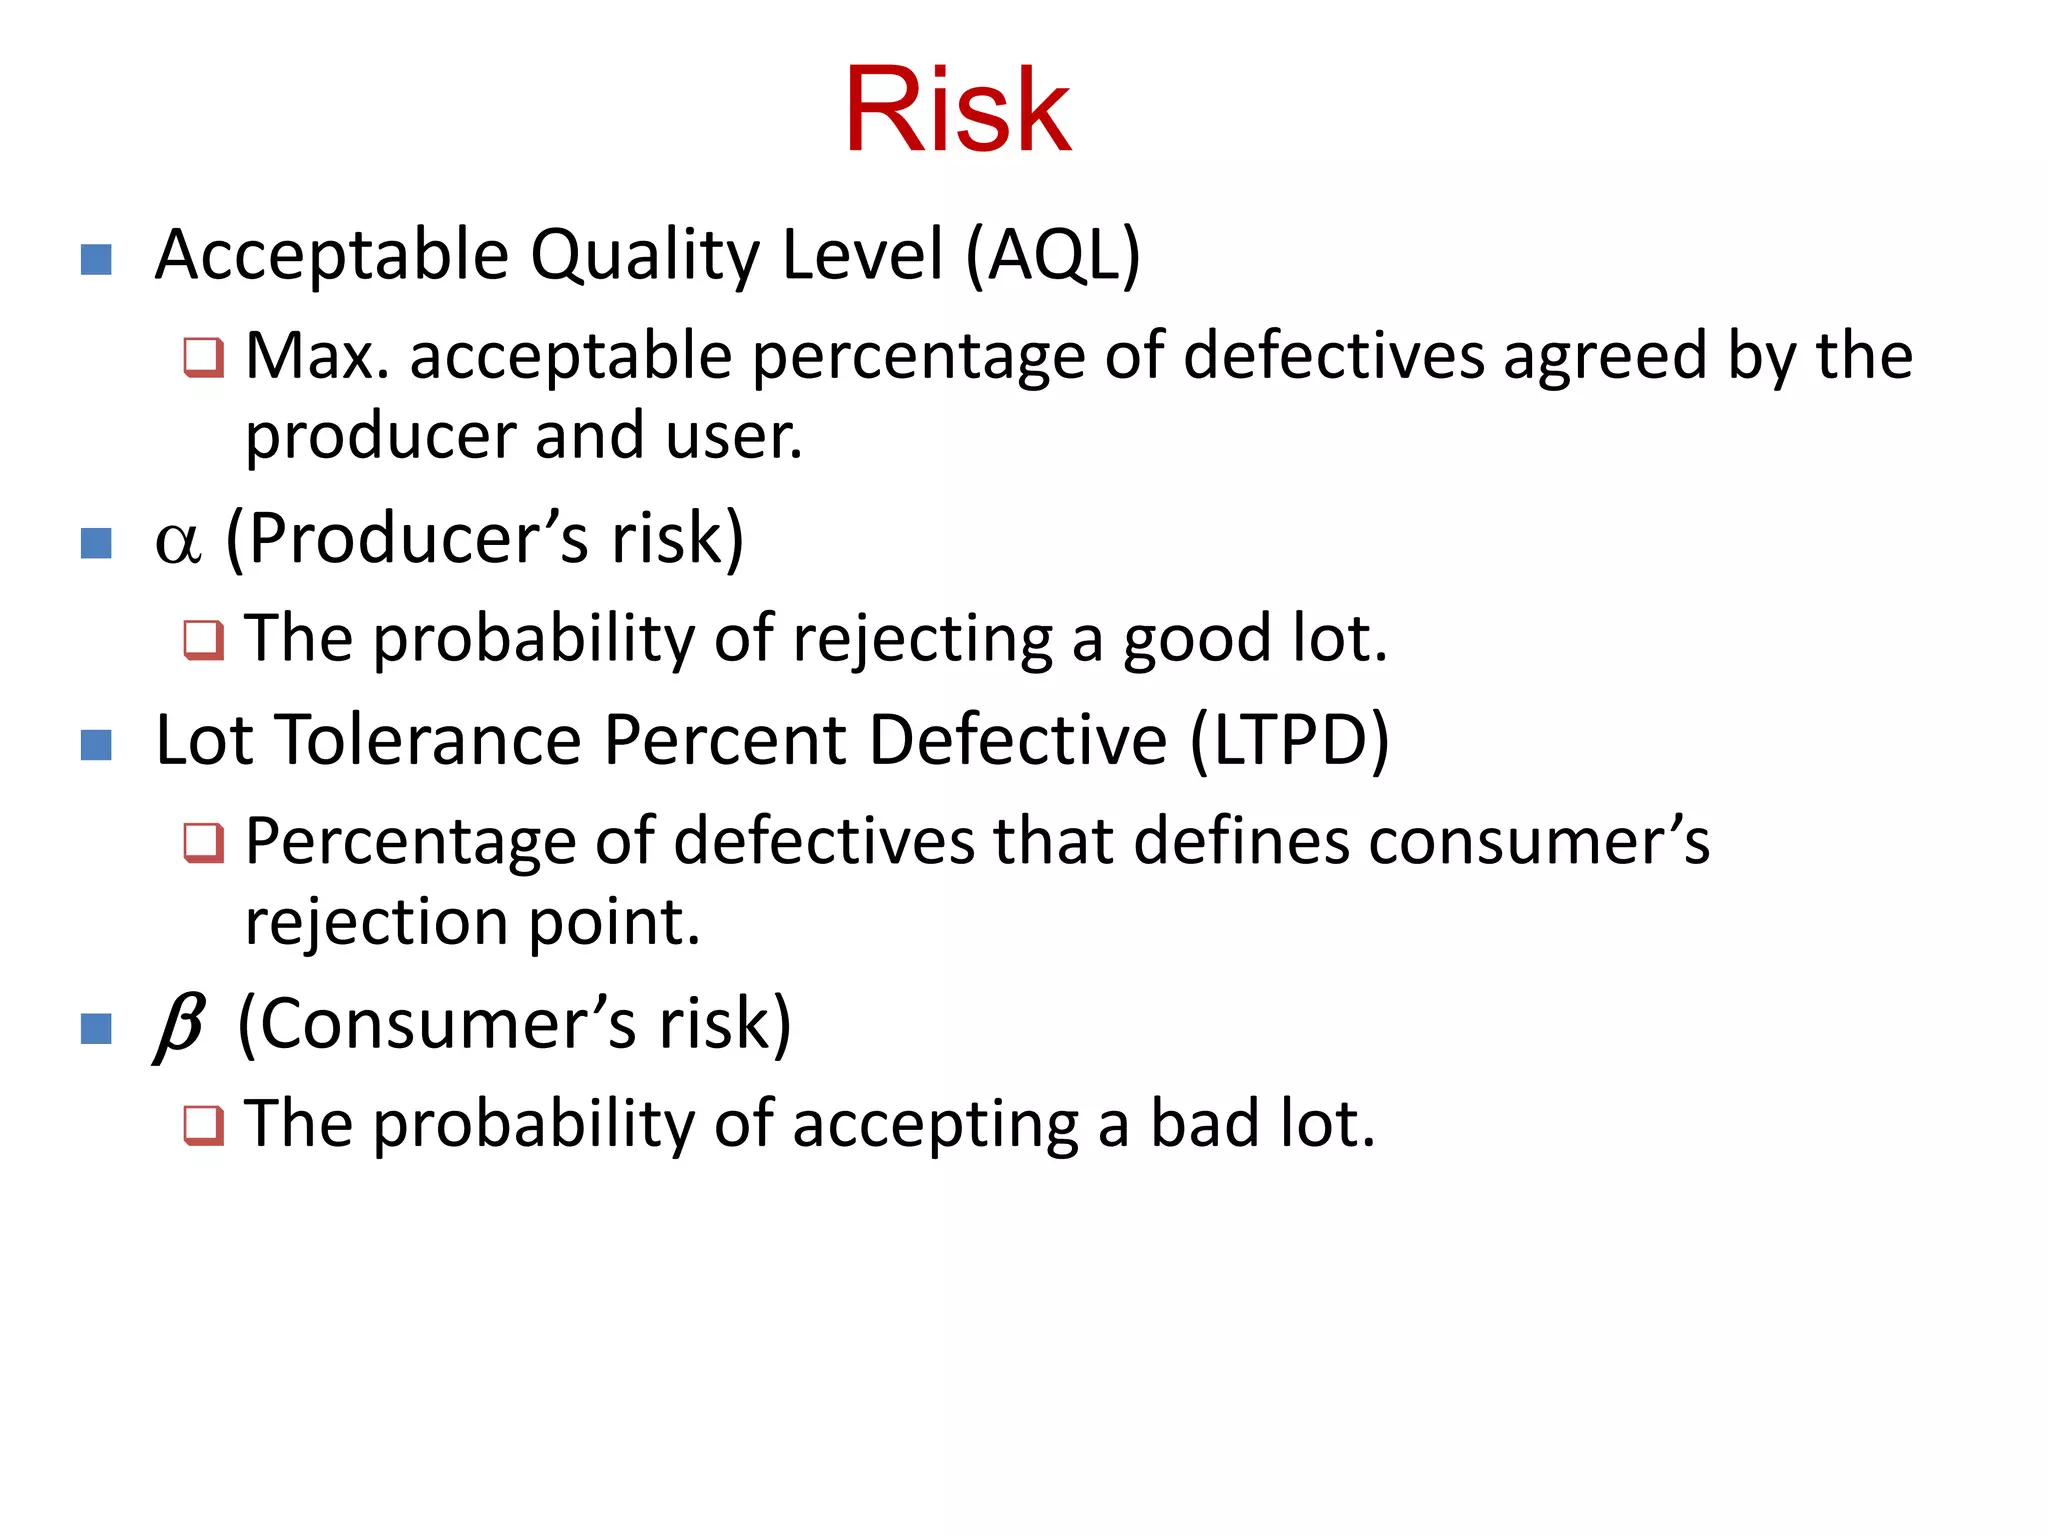
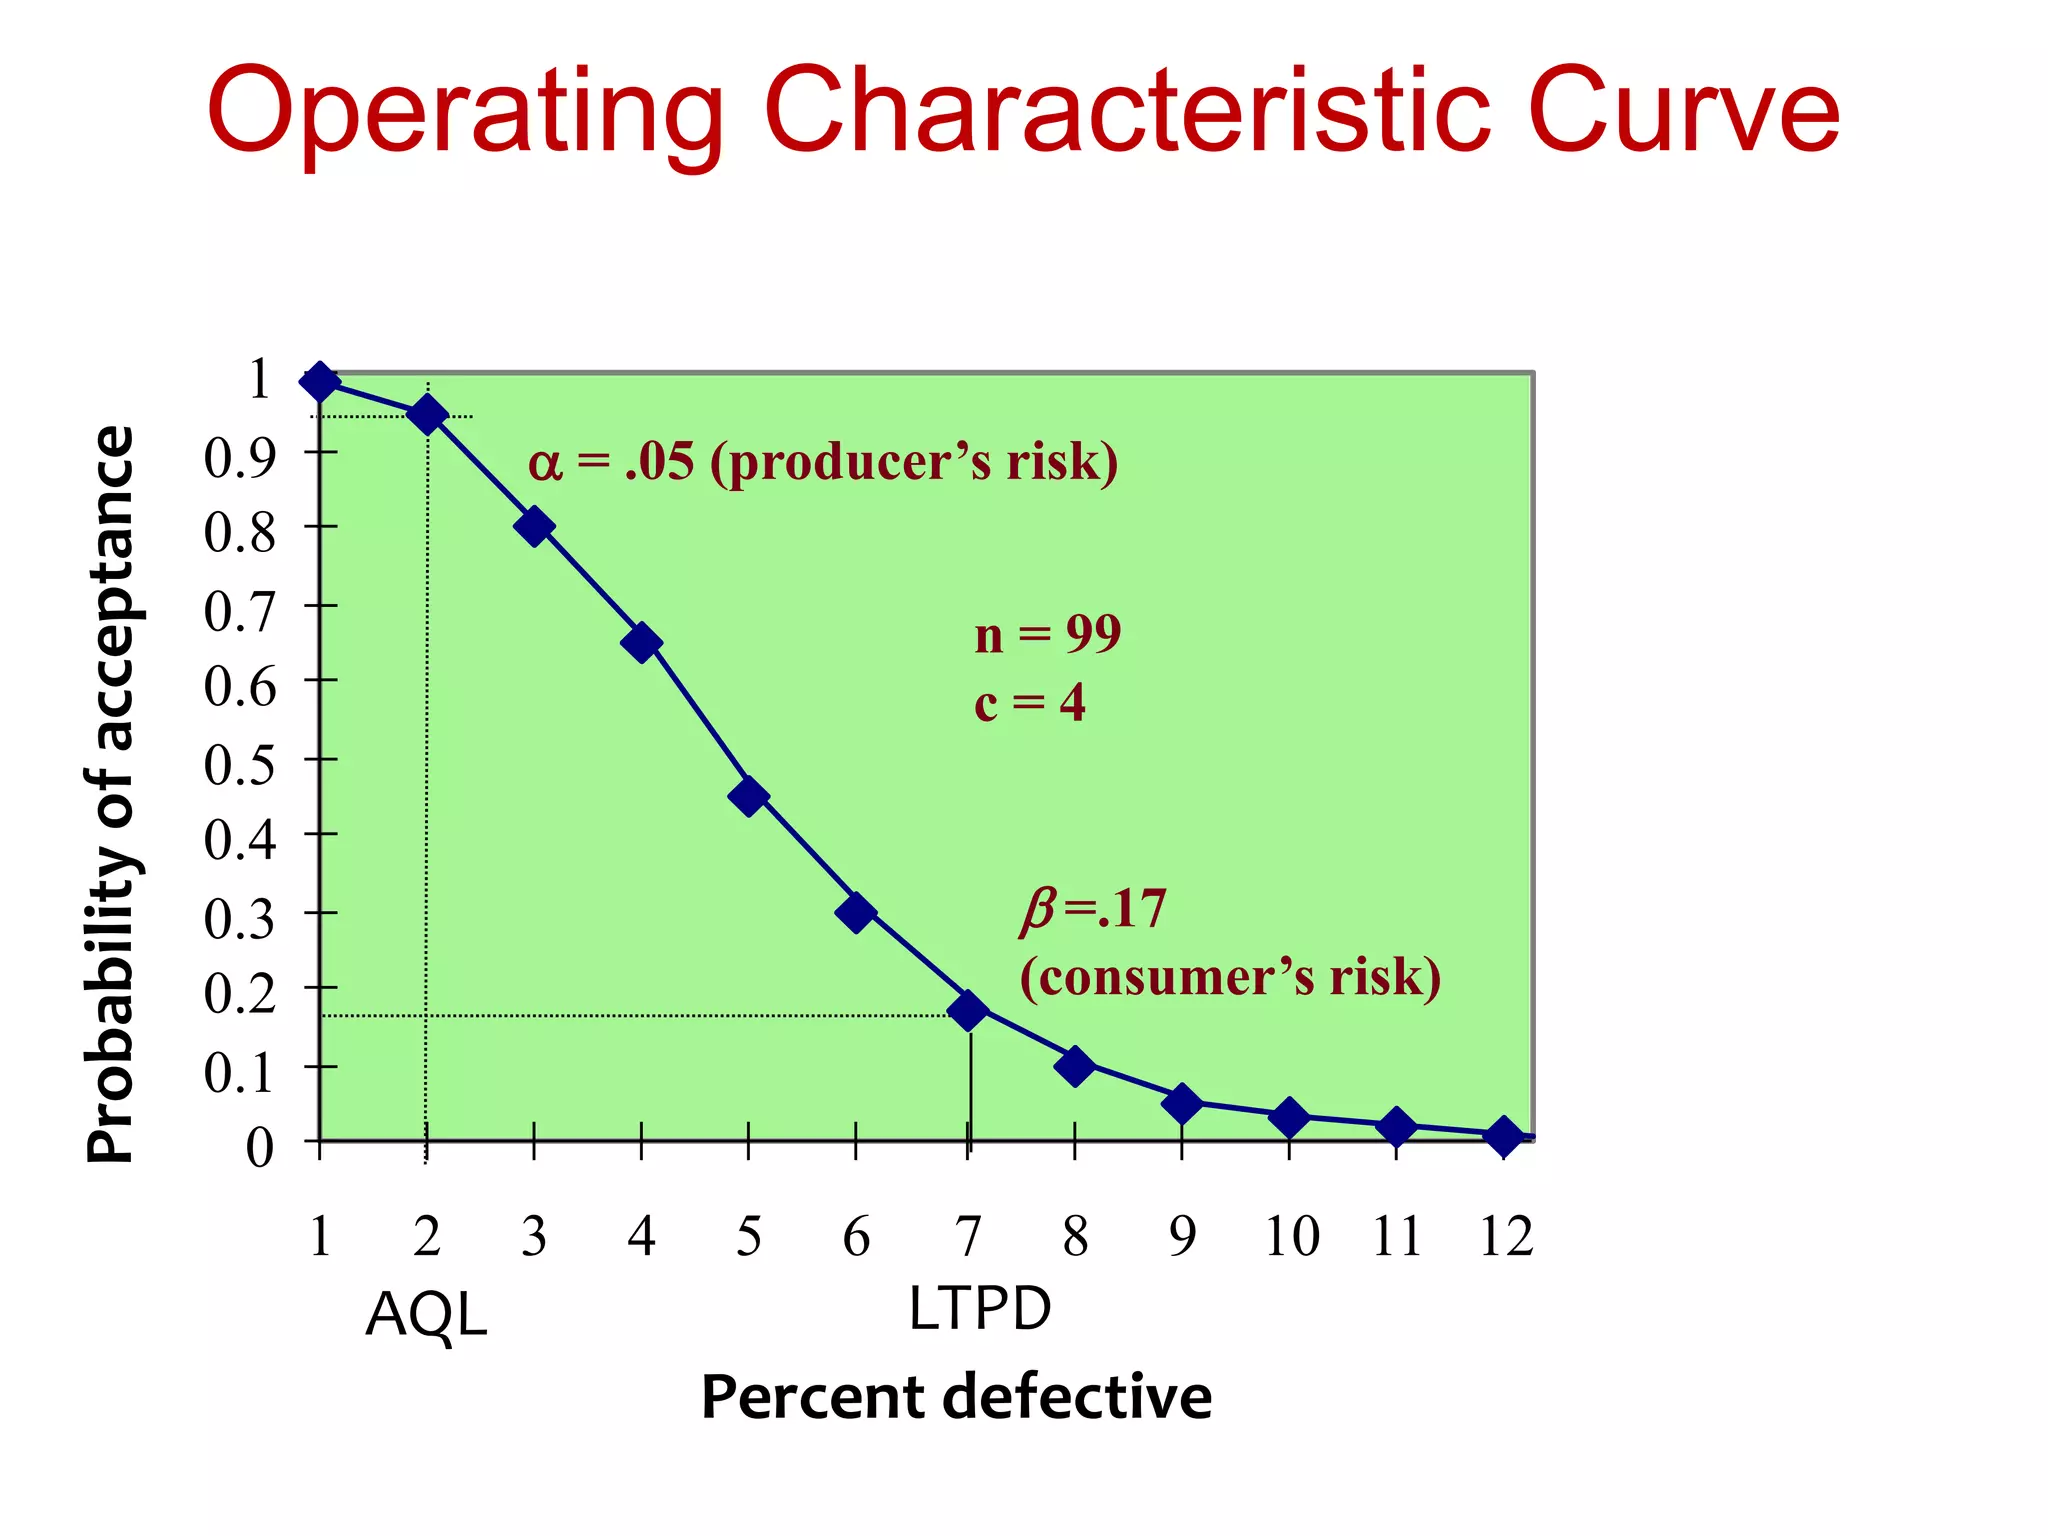
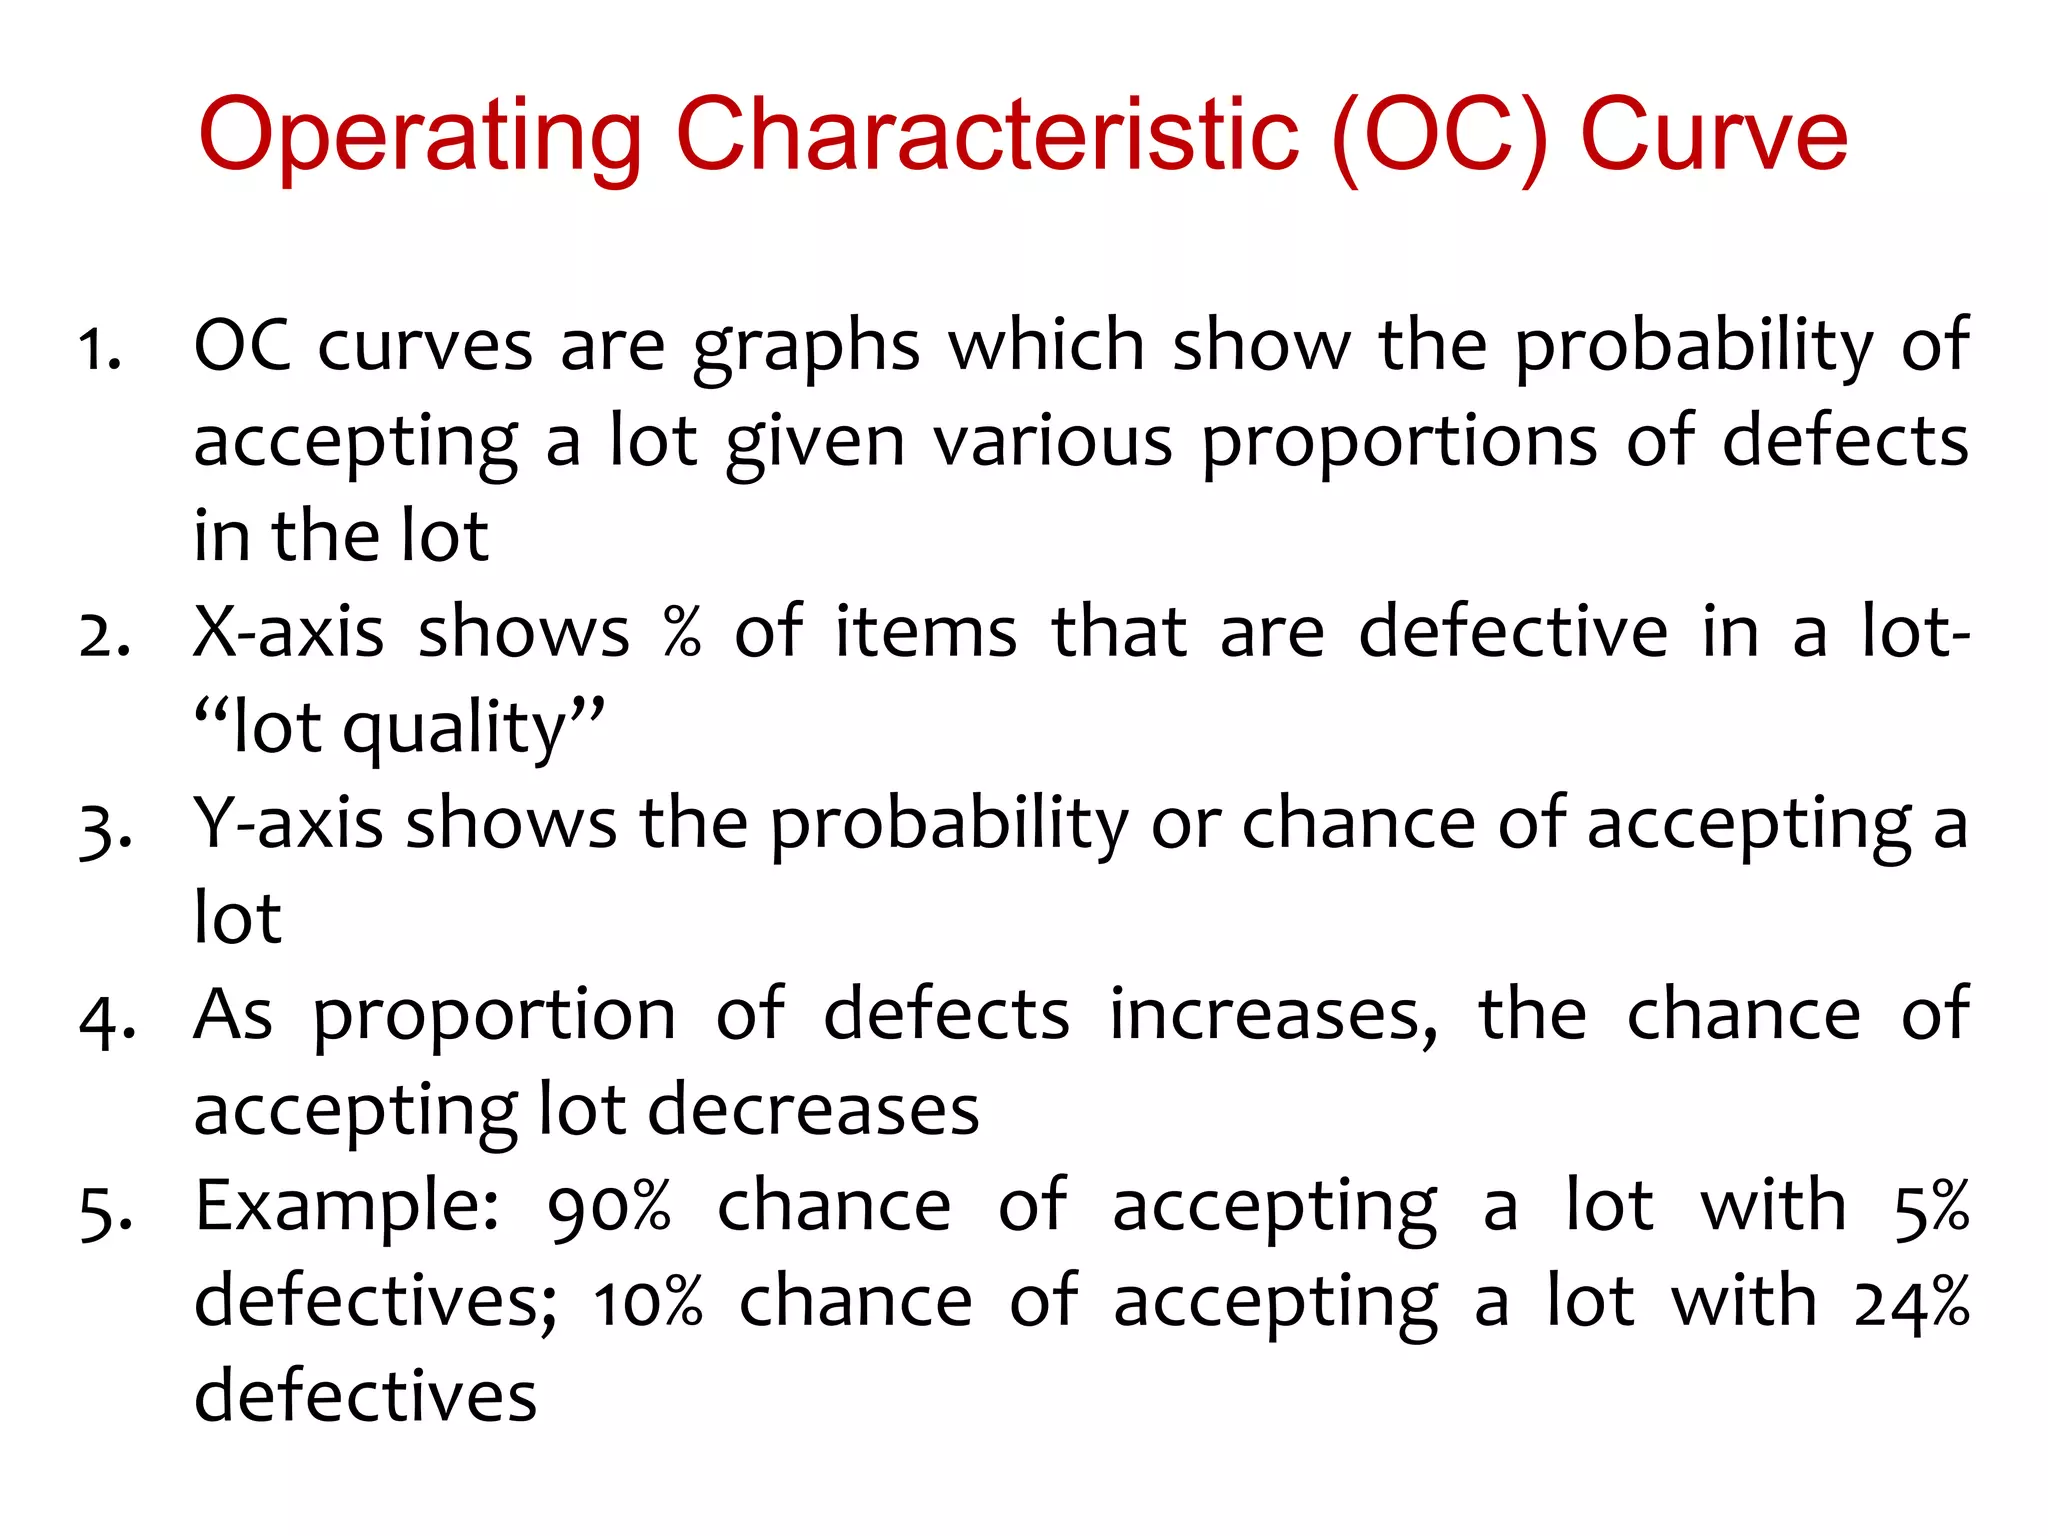


The document outlines various definitions and dimensions of quality, such as reliability, durability, performance, and aesthetics, emphasizing their importance in meeting customer expectations. It contrasts quality control and quality assurance processes, detailing the systematic approaches to monitoring product quality through inspections and administrative procedures. Additionally, the document explores statistical quality control and acceptance sampling, highlighting the concepts of defects, inspection plans, and the associated risks for both consumers and producers.