TQM control charts for variables and attributes
•
0 likes•3 views

control chart in process capability

Recommended
More Related Content
Similar to TQM control charts for variables and attributes
Similar to TQM control charts for variables and attributes (20)
More from Tamilselvan S
Recently uploaded
Recently uploaded (20)
TQM control charts for variables and attributes
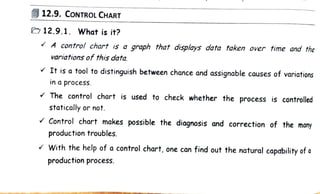
- 1. productionprocess. Wi t h t h e hel pofa control chart,one can fi n d out t h e natural cbility ofa productiontroubles. Control chart makes possible t h e diagnosis and correction of th e ma n y statically or not . The control chart is used to check whether t h e process is d in a process. V It isa t o olto distinguish between chanceand assignablecauses of s time and variations of this data. A con trol chart is a graph that displays data taken ove G12.9.1.What is it ? 12.9. CONTROL CHART
- 2. ControlCharts &Process Copability / The general form of the control chart is illustrated in Fig.12.8. Quality characteristic value The control chart is used to evaluate process stability and to decide when to adjust the process. +36 4 10 Sample values 12 14 Sample number, S G12.9.2. Types of Control Charts 16 The two basic types of control charts used are: Fig. 12.8. General form of control chart 1. Control charts for variables, and 2. Controlcharts for attributes. 18 Out-of-control 20 G12.9.3. Analysis of Patterns in Control Charts UCL 12.25 Centre line LCL Control charts for variables require a measurement of the quality characteristicof interest. Control charts for attributes require a determination of whether a part is defective or how many defects are there in the sample. The main objective of using control charts is to determine when aprocess is Out-of-controlso thatnecessaryactionsmaybe taken. V Criteria other than aplotted point falling outside the control limits are also used todetermine whether aprocess is out-of-control. Plot patterns often indicate whether the process is in control or not. Analyzing plot patterns is more difficult than plotting the control charts.
- 3. 12.28 12.10. CONTROL CHARTS FOR VARIABLES The quality characteristics which can be measured and expressed in specific units of measurements are called variables. Control charts based upon measurements of quality characteristics are called as control charts for variables. Types of variable control charts: The most commonly used variable control charts are: () X- or average-charts, () R- or range-charts, and (üi) s- or standard deviation-charts. V The X-chart is used to monitor the centering of the process to control its accuracy. The R-chart monitors the dispersion or precision of the process. V The s-chart shows the variation of the process. 12.10.1. Construction of X- and R-Charts Total QualityManagement Step 1:Select the characteristics for applying a control chart. Step2: Select the appropriate type of control chart. Step 3: Collect the data. Step 4: Choose the rational sub-group i.e., sample. Step 5:Calculate the average (X) and range (R) for each sample. For example, if asub-group contains 5 items whose dimensions (say diameter length or weight or etc.) are x, x2, X3, X and x5, then Sub-group average, X 5 and subgroup range, R Maximumvalue - Minimum value t selection of sample size: Subgroups (i.e., sample size) must be large enougn to detect points or patterns indicating alack of control when alack of controlexists. The largerthe sample size,the better the chances of detecting the pattern.
- 8. Appendix Observations inSample, n 3 4 5 6 7 9 10 11 12 13 14 15 16 17 18 19 20 21 22 23 24 A2. FACTORS FOR COMPUTING CENTRE LINE AND THREE-SIGMA CONTROL LIMITS 25 Factors for Control Limits A 2.121 1.880 1.732 1.500 1.342 1.134 1.061 1.000 1.225 0.483 0.949 0.905 0.866 0.832 0.802 0.775 0.750 0.728 0.707 0.688 0.671 0.655 0.640 0.626 K-charts 0.612 0.600 For n> 25, 1.023 0.729 0.577 0.419 0.373 0.337 0.308 0.285 0.249 0.235 0.223 0.212 0.203 0.194 0.187 0.180 0.173 0.167 0.162 0.157 0.153 Source: O ASTM. A : A3 2.659 1.954 1.628 0.266 0.886 0.9776 0.850 0.9794 0.9810 .182 1.099 1.032 1.287 0.9515 0.975 0.927 1.427 0.9400 1.0638 0.817 0.789 0.763 0.739 0.718 0.698 0.680 0.663 0.647 0.633 0.619 0.606 B4 = C4 Factors for Center Line 1/lc4 CA 0.7979 3 0.8862 0.9213 0.9594 0.9650 0.9693 0.9727 0.9754 olollL 0.9845 0.9854 0.9862 0.9869 0.9876 0.9882 0.9887 0.9892 0.9896 1.2533 3 1.1284 1.0854 0.9823 1.0180 0.9835 1.0510 1.0423 1.0363 1.0317 1.0281 1.0252 1.0229 1.0210 1.0194 1.0148 1.0140 1.0133 1.0126 1.0119 1.0114 1.0109 1.0105 3 S-Charts c4 Vn Factors for Control Limits 0.428 1.0168 0.448 and B3 1.0157 0.466 0.030 0.118 0.185 0.239 0.284 0.321 0.354 0.382 0,406 0.482 0.497 0.510 0.523 0.534 0.545 0.555 0.565 B4 3.267 2.568 2.266 2.089 1.970 1.882 1.815 1.761 1.716 1.646 1.618 1.594 1.572 1.679 0.313 1.552 1.534 1.518 1.503 1.490 1.477 1.466 1.455 1,445 1.435 Bs 0.029 0.113 0.179 B, = C4 0.232 0.276 0.346 0.374 0.399 0.421 0.440 0.458 0,475 0.490 0.504 0.516 0.528 0.539 0.549 4(n-1) 0.559 3 B6 1/dg dz 2,606 1.128 0.8865 0.853 2.276 1.693 0.5907 0.888 2.088 2.059 0.4857 0.880 1.964 2.326 0.4299 0.864 1.874 2.534 0.3946 0.848 1.806 2.704 9-3698 0.833 1.751 1.707 1.669 1.637 1.610 1.585 1.563 1.526 1.511 1.496 1.483 3.407 1.544 3.472 1.470 1.459 1.448 1.438 1.429. C4 4n-3 B 1- Factors for Center Line 1.420 2.970 3.078 3.173 3.258 3.532 3.588 3.640 0.3152 0.787 0.3069 0.778 3.336 0.2998 0.770 0.2935 0.763 0.2880 3.689 3.735 3.778 3.819 3.858 3.895 3.931 0.3512 3 0.3367 0.3249 0.797 0.2831 0.2787 0.2747 0.2711 0.2677 0.2647 02618 02592 02567 0.820 02544 0.808 c4V2 (n- 1) 0.756 0.750 0.744 0.739 0.734 0.729 0.724 0.720 0.716 0.712 0.708 R-Charts Factors for Control Limits DË 0.204 0.388 0.547 0.687 0.811 0.922 1.025 1.118 1.203 1.282 1.356 1.424 1.487 1.549 1.605 1.659 1.710 1.759 1.806 B = 1+ D2 3.686 4.358 4.698 4.918 5.078 5.204 5.306 5.393 5.469 5.535 5.594 S.647 5.696 S.741 S.782 5.820 5856 5.891 5.921 S.951 S.979 6.006 6.031 6.056 3 D3 0 0.076 0.136 0.184 0.223 0.256 0.283 0.307 0.328 0.347 0.363 0.378 0.391 0.403 0.415 0.425 0.434 0.443 0.451 0.459 C4 V 2(n - 1) D4 3.267 2.574 2.284 2.114 2.004 1.924 1.864 1.816 1.777 1.744 1.717 1.693 1.672 1.653 1.637 1.622 1.608 1.597 1.583 1.575 1.566 A.3 1.557 1.548 1.541 2.847
- 10. 12.34 Revised control limits for X-chart: () Todraw the revised X- and R-charts: (x) ueen Now using the revised control limits, the X- and R-charts are drawn as shown in Figs.12.16 and 12.17 respectively. 6.70 6.65 6.60 6.55 6.50 R 6.45 6.40 6.35 6.30 6.25 0 0.30 0.25 0.20 Control limit or Central = X-A, R = 6.377 - 0.729 (0.073) : 6.324 Ans. O 0.15 0.10 0.05 0.00 1 1 2 3 4 3 5 Subgroup No. 4 5 6 Fig. 12.16. Revised X-chart Subgroup No. 7 6 Total Quality Management 8 7 Fig. 12.17. Revised R-chart 9 UCLy =6.430 CLz =6.377 LCLy = 6324 10 UCLR = 0.166 CLR =0.073 10 LCL =0