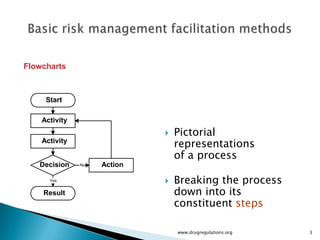
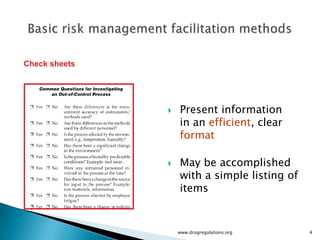
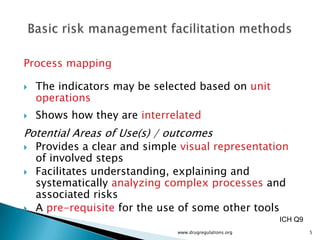
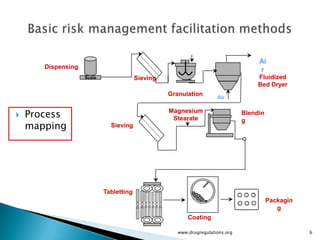
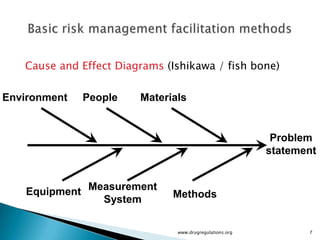
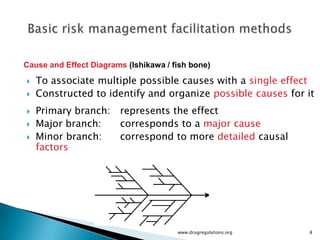
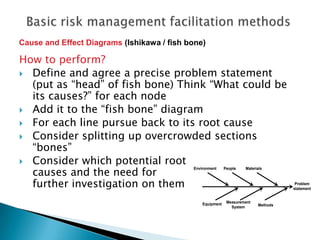
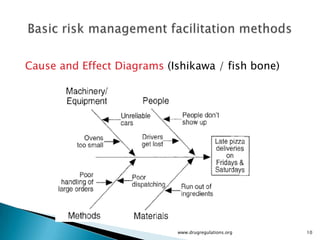
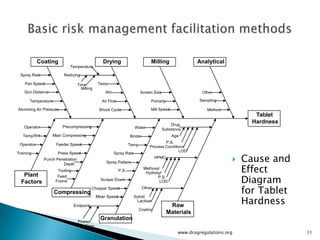
Quality Risk Management

          Basic
Risk Management Facilitation
         Methods
   Presentation complied by Drug Regulations – a not for
     profit organization from publicly available material
     form FDA , EDQM . WHO and similar organizations.
       Visit www.drugregulations.org for the latest in
                       Pharmaceuticals.


                                www.drugregulations.org     1
   Flowchart
   Check Sheets
   Process mapping
   Cause and Effect Diagrams (Ishikawa / fish bone)

They might be helpful to support risk identification


                                www.drugregulations.org   2
Flowcharts


     Start

    Activity
                                Pictorial
    Activity
                                 representations
                                 of a process
   Decision    No   Action

      Yes                       Breaking the process
    Result                       down into its
                                 constituent steps

                                 www.drugregulations.org   3
Check sheets


                  Present information
                   in an efficient, clear
                   format

                  May be accomplished
                   with a simple listing of
                   items


                   www.drugregulations.org    4
Process mapping

   The indicators may be selected based on unit
    operations
   Shows how they are interrelated
Potential Areas of Use(s) / outcomes
   Provides a clear and simple visual representation
    of involved steps
   Facilitates understanding, explaining and
    systematically analyzing complex processes and
    associated risks
   A pre-requisite for the use of some other tools
                                                         ICH Q9
                               www.drugregulations.org            5
Ai
       Dispensing
                                                                                     r
                    Scale                Sieving                                     Fluidized
                                                                                     Bed Dryer
                                                   Granulation        Air


   Process                                        Magnesium
                                                    Stearate
                                                                                Blendin
                                                                                g
    mapping                   Sieving


                            Tabletting
                                                                                          Packagin
                                                                                             g
                                                          Coating

                                                      www.drugregulations.org                        6
Cause and Effect Diagrams (Ishikawa / fish bone)

Environment   People    Materials


                                                          Problem
                                                         statement


   Equipment Measurement      Methods
               System

                               www.drugregulations.org          7
Cause and Effect Diagrams (Ishikawa / fish bone)

   To associate multiple possible causes with a single effect
   Constructed to identify and organize possible causes for it
   Primary branch:     represents the effect
   Major branch:       corresponds to a major cause
   Minor branch:       correspond to more detailed causal
    factors


                                       www.drugregulations.org   8
Cause and Effect Diagrams (Ishikawa / fish bone)

How to perform?
 Define and agree a precise problem statement
  (put as “head” of fish bone) Think “What could be
  its causes?” for each node
 Add it to the “fish bone” diagram
 For each line pursue back to its root cause
 Consider splitting up overcrowded sections
  “bones”
 Consider which potential root
  causes and the need for
                                            Environment     People   Materials


  further investigation on them                                                       Problem
                                                                                     statement


                                                Equipment    Measurement
                                                               System      Methods
Cause and Effect Diagrams (Ishikawa / fish bone)


                            www.drugregulations.org   10
Coating                               Drying                         Milling                Analytical
                            Temperature

  Spray Rate             Redrying

    Pan Speed                      Time        Temp
                                     Milling
    Gun Distance                                    RH                     Screen Size                    Other

       Temperature                                Air Flow                       Porosity                Sampling

Atomizing Air Pressure                          Shock Cycle                      Mill Speed                 Method
                                                                                                                             Tablet
                                                                                             Drug
                                                                                                                            Hardness
    Operator             Precompressing                               Water              Substance
   Temp/RH         Main Compressing                                 Binder                    Age
                                                                                         P.S.
 Operator            Feeder Speed                                   Temp         Process Conditions
                                                                                                LOD

                                                                                                                          Cause and
Training              Press Speed                        Spray Rate
               Punch Penetration
                                                    Spray Pattern
                                                                                     HPMC
                                                                                                                      
                                                                                                                          Effect
                        Depth
                                                                             Methoxyl
                      Tooling                                P.S.
                                                                              Hydroxyl

                                                                                                                          Diagram
   Plant              Feed                                                          P.S.
                                                 Scrape Down
  Factors            Frame                                                            LOD

                     Compressing
                                           Chopper Speed                     Other
                                                                                                                          for Tablet
                                                                                                                          Hardness
                                               Mixer Speed            Syloid
                                                                        Lactose
                                Endpoint                                                     Raw
                                                                           Coating
                                                                                            Materials
                                   Power
                                                 Granulation
                                      Time
                                                                                                www.drugregulations.org                11

Quality risk managment basic facilitation methods

  • 1.
    Quality Risk Management Basic Risk Management Facilitation Methods Presentation complied by Drug Regulations – a not for profit organization from publicly available material form FDA , EDQM . WHO and similar organizations. Visit www.drugregulations.org for the latest in Pharmaceuticals. www.drugregulations.org 1
  • 2.
    Flowchart  Check Sheets  Process mapping  Cause and Effect Diagrams (Ishikawa / fish bone) They might be helpful to support risk identification www.drugregulations.org 2
  • 3.
    Flowcharts Start Activity  Pictorial Activity representations of a process Decision No Action Yes  Breaking the process Result down into its constituent steps www.drugregulations.org 3
  • 4.
    Check sheets  Present information in an efficient, clear format  May be accomplished with a simple listing of items www.drugregulations.org 4
  • 5.
    Process mapping  The indicators may be selected based on unit operations  Shows how they are interrelated Potential Areas of Use(s) / outcomes  Provides a clear and simple visual representation of involved steps  Facilitates understanding, explaining and systematically analyzing complex processes and associated risks  A pre-requisite for the use of some other tools ICH Q9 www.drugregulations.org 5
  • 6.
    Ai Dispensing r Scale Sieving Fluidized Bed Dryer Granulation Air  Process Magnesium Stearate Blendin g mapping Sieving Tabletting Packagin g Coating www.drugregulations.org 6
  • 7.
    Cause and EffectDiagrams (Ishikawa / fish bone) Environment People Materials Problem statement Equipment Measurement Methods System www.drugregulations.org 7
  • 8.
    Cause and EffectDiagrams (Ishikawa / fish bone)  To associate multiple possible causes with a single effect  Constructed to identify and organize possible causes for it  Primary branch: represents the effect  Major branch: corresponds to a major cause  Minor branch: correspond to more detailed causal factors www.drugregulations.org 8
  • 9.
    Cause and EffectDiagrams (Ishikawa / fish bone) How to perform?  Define and agree a precise problem statement (put as “head” of fish bone) Think “What could be its causes?” for each node  Add it to the “fish bone” diagram  For each line pursue back to its root cause  Consider splitting up overcrowded sections “bones”  Consider which potential root causes and the need for Environment People Materials further investigation on them Problem statement Equipment Measurement System Methods
  • 10.
    Cause and EffectDiagrams (Ishikawa / fish bone) www.drugregulations.org 10
  • 11.
    Coating Drying Milling Analytical Temperature Spray Rate Redrying Pan Speed Time Temp Milling Gun Distance RH Screen Size Other Temperature Air Flow Porosity Sampling Atomizing Air Pressure Shock Cycle Mill Speed Method Tablet Drug Hardness Operator Precompressing Water Substance Temp/RH Main Compressing Binder Age P.S. Operator Feeder Speed Temp Process Conditions LOD Cause and Training Press Speed Spray Rate Punch Penetration Spray Pattern HPMC  Effect Depth Methoxyl Tooling P.S. Hydroxyl Diagram Plant Feed P.S. Scrape Down Factors Frame LOD Compressing Chopper Speed Other for Tablet Hardness Mixer Speed Syloid Lactose Endpoint Raw Coating Materials Power Granulation Time www.drugregulations.org 11