Download as PDF, PPTX


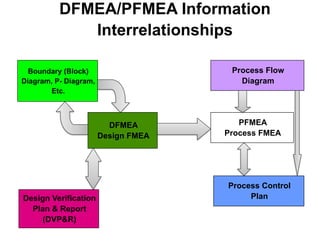

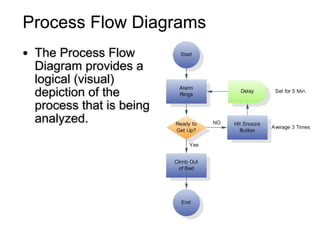


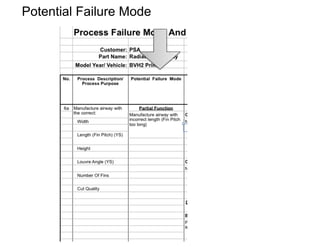

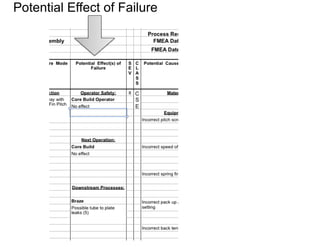
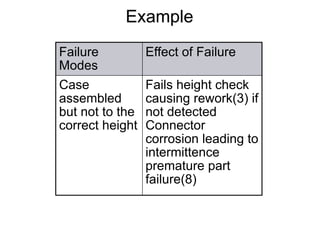


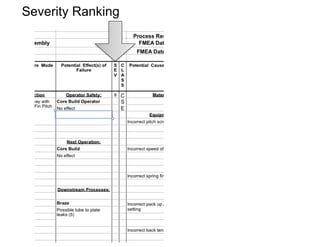


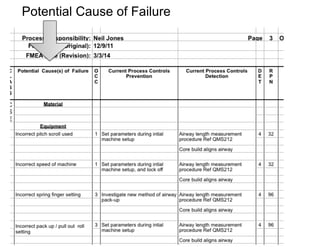


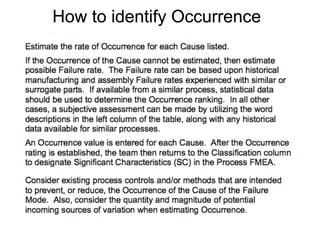


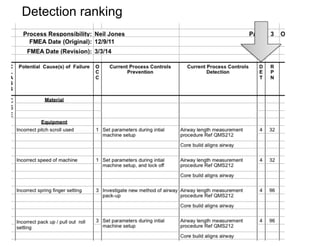
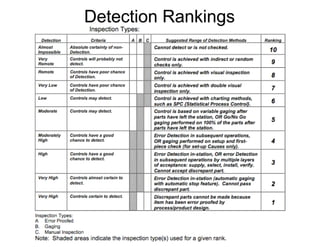
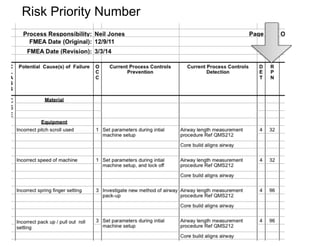
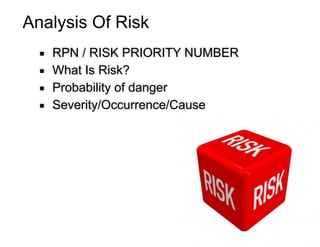


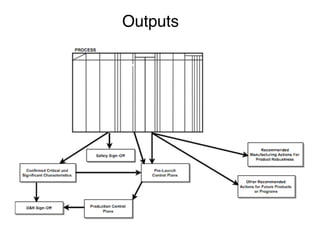
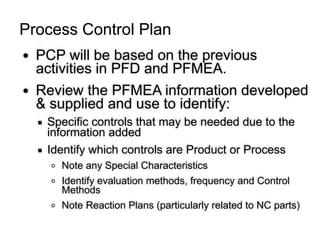
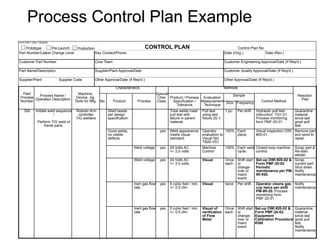
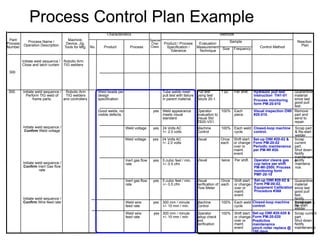

The document discusses failure mode and effects analysis (FMEA). It provides definitions and descriptions of different types of FMEAs, including design FMEA (DFMEA) which focuses on potential design failures, and process FMEA (PFMEA) which focuses on potential process failures and their causes. The document outlines the key steps in conducting a PFMEA, including developing a process flow diagram, identifying potential failure modes and their effects and causes, analyzing the risks associated with failures, and creating a process control plan to address potential failures.


![Fmea Handbook V4.1[1][1]](https://cdn.slidesharecdn.com/ss_thumbnails/fmeahandbookv4111-1310447612699-phpapp01-110712001630-phpapp01-thumbnail.jpg?width=640&height=640&fit=bounds)


