Downloaded 125 times


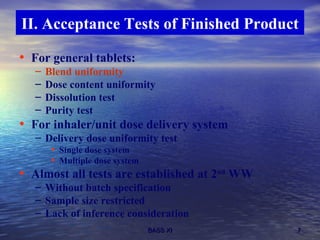
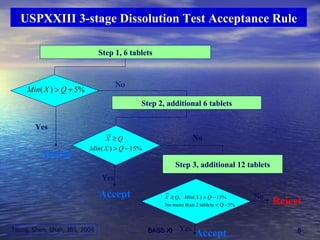


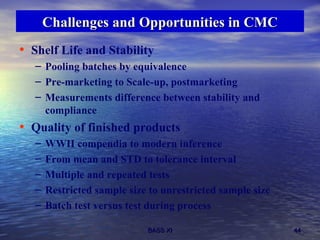


This document discusses emerging issues in manufacturing quality control and assurance of drug products. It covers three key areas: 1) shelf life determination and stability testing, 2) acceptance tests of finished products, and 3) in vitro equivalence tests. For each area, it outlines statistical challenges and opportunities to move from traditional approaches to quality-by-design using process analytical technology. The goal is to better understand and control manufacturing processes to ensure consistent quality.


