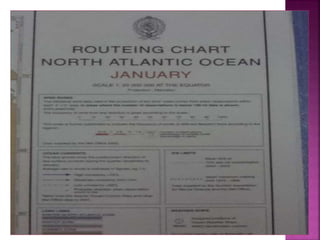
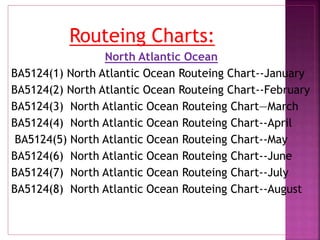
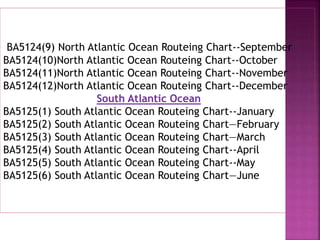
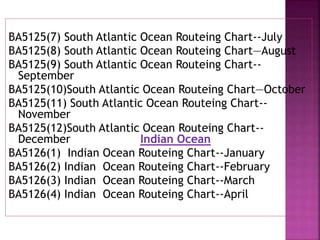
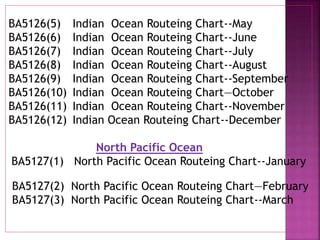
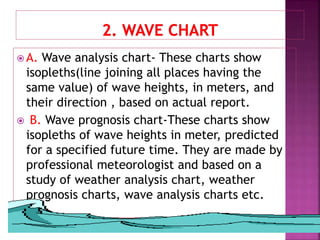
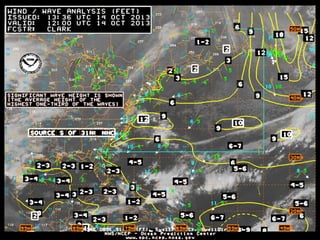
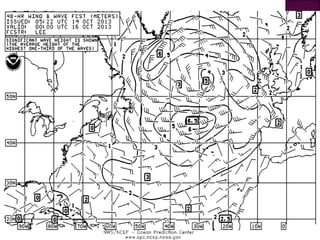
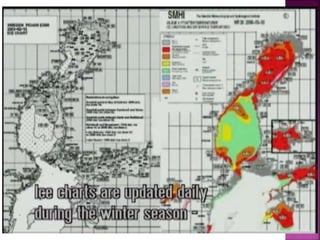
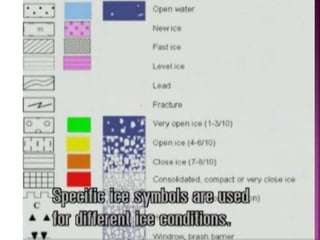
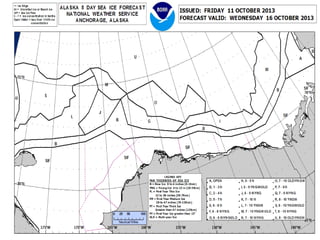
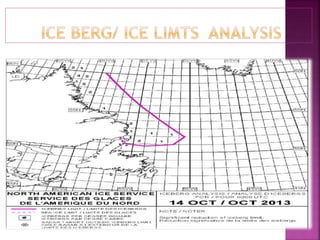
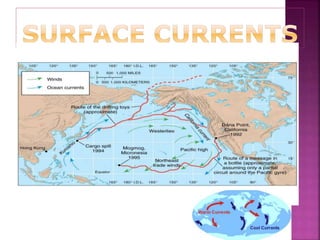
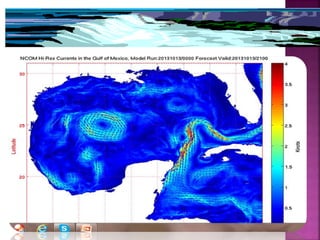
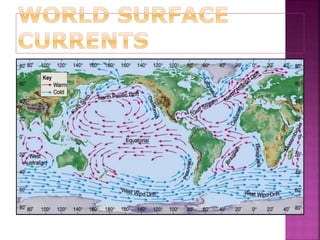
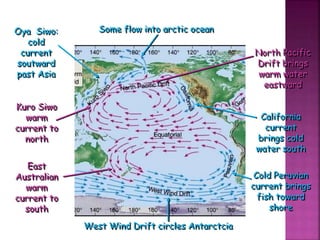
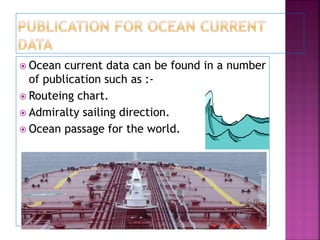
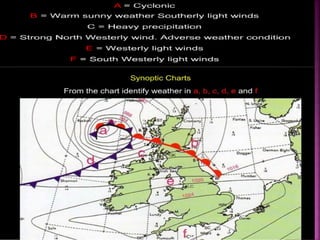
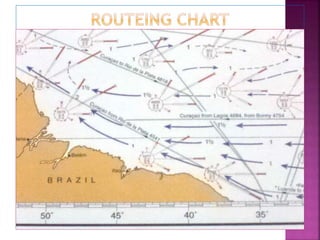
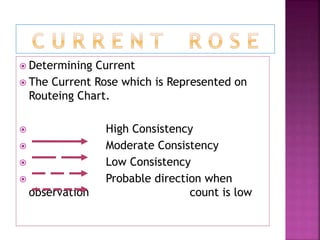
PRESENTED BY :
ABDUL JABBAR
KHAN
1.Monthly Routeing Chart
2.Wave Chart
3.Ice Chart
4.Information on Current
5.Prevailing Wind
6.Ice
7.Other sources of weather information such as
Navtex.
Routeing Charts published for the North and
South Atlantic, Indian, and North and South
Pacific Oceans. Each chart has twelve
versions, one for each month and assist the
navigator to plan an ocean passage for any
time of year . The following data is available
on a Monthly Routeing Chart :
1. An outline of the surrounding land areas.
2.The position of major ports.
3.The recognized shipping routes between
major ports, with distances.
4.Data on wind speed, direction and forces.
5. Incidence of low visibility and Frequency of
storms.
6.Data on sea and air temperature, air pressure
and ice limit.
7.Data on ocean currents.
8.The limits of Load line zones.
9.The locations of ocean weather ships.
 Determining Current
 The Current Rose which is Represented on
Routeing Chart.
 High Consistency
 Moderate Consistency
 Low Consistency
 Probable direction when
 observation count is low
Routeing Charts:
North Atlantic Ocean
BA5124(1) North Atlantic Ocean Routeing Chart--January
BA5124(2) North Atlantic Ocean Routeing Chart--February
BA5124(3) North Atlantic Ocean Routeing Chart—March
BA5124(4) North Atlantic Ocean Routeing Chart--April
BA5124(5) North Atlantic Ocean Routeing Chart--May
BA5124(6) North Atlantic Ocean Routeing Chart--June
BA5124(7) North Atlantic Ocean Routeing Chart--July
BA5124(8) North Atlantic Ocean Routeing Chart--August
BA5124(9) North Atlantic Ocean Routeing Chart--September
BA5124(10)North Atlantic Ocean Routeing Chart--October
BA5124(11)North Atlantic Ocean Routeing Chart--November
BA5124(12)North Atlantic Ocean Routeing Chart--December
South Atlantic Ocean
BA5125(1) South Atlantic Ocean Routeing Chart--January
BA5125(2) South Atlantic Ocean Routeing Chart—February
BA5125(3) South Atlantic Ocean Routeing Chart—March
BA5125(4) South Atlantic Ocean Routeing Chart--April
BA5125(5) South Atlantic Ocean Routeing Chart--May
BA5125(6) South Atlantic Ocean Routeing Chart—June
BA5125(7) South Atlantic Ocean Routeing Chart--July
BA5125(8) South Atlantic Ocean Routeing Chart—August
BA5125(9) South Atlantic Ocean Routeing Chart--
September
BA5125(10)South Atlantic Ocean Routeing Chart—October
BA5125(11) South Atlantic Ocean Routeing Chart--
November
BA5125(12)South Atlantic Ocean Routeing Chart--
December Indian Ocean
BA5126(1) Indian Ocean Routeing Chart--January
BA5126(2) Indian Ocean Routeing Chart--February
BA5126(3) Indian Ocean Routeing Chart--March
BA5126(4) Indian Ocean Routeing Chart--April
BA5126(5) Indian Ocean Routeing Chart--May
BA5126(6) Indian Ocean Routeing Chart--June
BA5126(7) Indian Ocean Routeing Chart--July
BA5126(8) Indian Ocean Routeing Chart--August
BA5126(9) Indian Ocean Routeing Chart--September
BA5126(10) Indian Ocean Routeing Chart—October
BA5126(11) Indian Ocean Routeing Chart--November
BA5126(12) Indian Ocean Routeing Chart--December
North Pacific Ocean
BA5127(1) North Pacific Ocean Routeing Chart--January
BA5127(2) North Pacific Ocean Routeing Chart—February
BA5127(3) North Pacific Ocean Routeing Chart--March
BA5127(4) North Pacific Ocean Routeing Chart-April
BA5127(5) North Pacific Ocean Routeing Chart-May
BA5127(6) North Pacific Ocean Routeing Chart—June
BA5127 (7) North Pacific Ocean Routeing Chart—Jul
BA5127(8) North Pacific Ocean Routeing Chart—August
BA5127(9) North Pacific Ocean Routeing Chart—
September
BA5127(10) North Pacific Ocean Routeing Chart—October
BA5127(11) North Pacific Ocean Routeing Chart--
November
BA5127(12) North Pacific Ocean Routeing Chart--
December
South Pacific Ocean
BA5128(1) South Pacific Ocean Routeing Chart—January
BA5128(2) South Pacific Ocean Routeing Chart—February
BA5128(3) South Pacific Ocean Routeing Chart--March
BA5128(4) South Pacific Ocean Routeing Chart--April
BA5128(5) South Pacific Ocean Routeing Chart—May
BA5128(6) South Pacific Ocean Routeing Chart--June
BA5128(7) South Pacific Ocean Routeing Chart--July
BA5128(8) South Pacific Ocean Routeing Chart--August
BA5128(9) South Pacific Ocean Routeing Chart--
September
BA5128(10) South Pacific Ocean Routeing Chart—October
BA5128(11) South Pacific Ocean Routeing Chart--
November
BA5128(12) South Pacific Ocean Routeing Chart--
December
 A. Wave analysis chart- These charts show
isopleths(line joining all places having the
same value) of wave heights, in meters, and
their direction , based on actual report.
 B. Wave prognosis chart-These charts show
isopleths of wave heights in meter, predicted
for a specified future time. They are made by
professional meteorologist and based on a
study of weather analysis chart, weather
prognosis charts, wave analysis charts etc.
 A heavy lift cargo ship for instance will use
the wave chart during the planning of the
passage to avoid areas where the wave
height will be above the allowed limit for the
vessel safe passage. With the use of the wave
chart the vessel can be safely navigated from
one part of the ocean to the other.
 Ice analysis chart-These chart indicated
amounts and boundaries of each type of ice ,
icepacks, ice leads and icebergs based on
actual observation
 Ice prognosis chart-This charts contain the
same type of information as ice analysis
charts. But predicted for a specified future
time and are usually made 12 hours and 24
hours in advance.
After studying the situation shown by the ice
analysis charts and taking into account
various factors such as winds, currents,
temperature of air and sea etc. the prognosis
charts are made by expert.
 Ocean currents are the circulations of water caused by
various factors. Ocean currents have two different
methods of moving water. Surface currents move as a
result of blowing winds and are influenced by
atmospheric factors. Deep ocean currents move as a
result of the density differences that are present in
the ocean.
 The two largest currents on earth are the Kuroshio
Current which circulates near Japan, and the Antarctic
Circumpolar Current, which circulates around
Antarctica.
 Currents plan an important role in navigation as
well. In addition to being able to avoid trash and
icebergs, knowledge of currents is essential to the
reduction of shipping costs and fuel consumption.
Today, shipping companies and even sailing races
often use currents to reduce time spent at sea.
 It is important to understand that ocean
circulation is very dynamic, and this following map
only shows the average position of these currents.
 Additionally, this map does not show subsurface
and deep ocean circulation, both of which are
very important in ocean dynamics.
Oya Siwo:
cold
current
soutward
past Asia
Kuro Siwo
warm
current to
north
East
Australian
warm
current to
south
West Wind Drift circles Antarctcia
Cold Peruvian
current brings
fish toward
shore
California
current
brings cold
water south
North Pacific
Drift brings
warm water
eastward
Some flow into arctic ocean
 Ocean current data can be found in a number
of publication such as :-
 Routeing chart.
 Admiralty sailing direction.
 Ocean passage for the world.
Admiralty Ocean Passages For
The World NP - 136
 Determining Current
 The Current Rose which is Represented on
Routeing Chart.
 High Consistency
 Moderate Consistency
 Low Consistency
 Probable direction when
observation count is low
 A wind that blows predominantly from a single general
direction. For example the trade winds of the tropics,
which blow from the east throughout the year, are
prevailing winds.
 The earth is encircled by several broad prevailing wind
belts, which are separated by narrower regions of either
subsidence or ascent. The direction and location of
these wind belts are determined by solar radiation and
the rotation of the earth. The three primary circulation
cells are known as the: Hadley cell; Ferrell cell; and
Polar cell.
 The oceans of the world are covered by a set of ships
board chart shows the coastline, the approximate
strengths and direction of prevailing wind.
 By using routeing chart we can find the information
about prevailing wind.
 Ice is a solid form of water, or, more generally, any frozen
volatile.
 Sea ice occurs in both the Arctic and Antarctic.
 In the Northern Hemisphere, it can currently exist as
far south as Bohai Bay, China (approximately 38
degrees north latitude), which is actually about 700
kilometers (435 miles) closer to the Equator than it is
to the North Pole.
 In the Southern Hemisphere, sea ice only develops
around Antarctica, occurring as far north as 55
degrees south latitude.
 Sea ice grows during the winter months and melts
during the summer months, but some sea ice remains
all year in certain regions. About 15 percent of the
world's oceans are covered by sea ice during part of
the year.
 Navtex is a navigational telex service developed by IMO,
and broadcasted by means of narrow band direct
printing techniques on the frequency 518 kHz, for the
promulgation of navigational, meteorological warnings
and urgent information to ships. It is incorporated in
the GMDSS and is achieved by transmitters allocated to
cover a specific Navtex area..
 The other components of the total GMDSS are:
 Radio telephony broadcasts, VHF out to 30 miles, MF to
150 miles, HF worldwide,
 The International Maritime Satellite (INMARSAT) Safety
NET over the oceans, roughly 65°N to 65°S.,
 HF radio-facsimile and radio-teletype.
THANK YOU

Meteorology presentation

  • 1.
  • 2.
    1.Monthly Routeing Chart 2.WaveChart 3.Ice Chart 4.Information on Current 5.Prevailing Wind 6.Ice 7.Other sources of weather information such as Navtex.
  • 3.
    Routeing Charts publishedfor the North and South Atlantic, Indian, and North and South Pacific Oceans. Each chart has twelve versions, one for each month and assist the navigator to plan an ocean passage for any time of year . The following data is available on a Monthly Routeing Chart : 1. An outline of the surrounding land areas. 2.The position of major ports. 3.The recognized shipping routes between major ports, with distances. 4.Data on wind speed, direction and forces.
  • 4.
    5. Incidence oflow visibility and Frequency of storms. 6.Data on sea and air temperature, air pressure and ice limit. 7.Data on ocean currents. 8.The limits of Load line zones. 9.The locations of ocean weather ships.
  • 7.
     Determining Current The Current Rose which is Represented on Routeing Chart.  High Consistency  Moderate Consistency  Low Consistency  Probable direction when  observation count is low
  • 10.
    Routeing Charts: North AtlanticOcean BA5124(1) North Atlantic Ocean Routeing Chart--January BA5124(2) North Atlantic Ocean Routeing Chart--February BA5124(3) North Atlantic Ocean Routeing Chart—March BA5124(4) North Atlantic Ocean Routeing Chart--April BA5124(5) North Atlantic Ocean Routeing Chart--May BA5124(6) North Atlantic Ocean Routeing Chart--June BA5124(7) North Atlantic Ocean Routeing Chart--July BA5124(8) North Atlantic Ocean Routeing Chart--August
  • 11.
    BA5124(9) North AtlanticOcean Routeing Chart--September BA5124(10)North Atlantic Ocean Routeing Chart--October BA5124(11)North Atlantic Ocean Routeing Chart--November BA5124(12)North Atlantic Ocean Routeing Chart--December South Atlantic Ocean BA5125(1) South Atlantic Ocean Routeing Chart--January BA5125(2) South Atlantic Ocean Routeing Chart—February BA5125(3) South Atlantic Ocean Routeing Chart—March BA5125(4) South Atlantic Ocean Routeing Chart--April BA5125(5) South Atlantic Ocean Routeing Chart--May BA5125(6) South Atlantic Ocean Routeing Chart—June
  • 12.
    BA5125(7) South AtlanticOcean Routeing Chart--July BA5125(8) South Atlantic Ocean Routeing Chart—August BA5125(9) South Atlantic Ocean Routeing Chart-- September BA5125(10)South Atlantic Ocean Routeing Chart—October BA5125(11) South Atlantic Ocean Routeing Chart-- November BA5125(12)South Atlantic Ocean Routeing Chart-- December Indian Ocean BA5126(1) Indian Ocean Routeing Chart--January BA5126(2) Indian Ocean Routeing Chart--February BA5126(3) Indian Ocean Routeing Chart--March BA5126(4) Indian Ocean Routeing Chart--April
  • 13.
    BA5126(5) Indian OceanRouteing Chart--May BA5126(6) Indian Ocean Routeing Chart--June BA5126(7) Indian Ocean Routeing Chart--July BA5126(8) Indian Ocean Routeing Chart--August BA5126(9) Indian Ocean Routeing Chart--September BA5126(10) Indian Ocean Routeing Chart—October BA5126(11) Indian Ocean Routeing Chart--November BA5126(12) Indian Ocean Routeing Chart--December North Pacific Ocean BA5127(1) North Pacific Ocean Routeing Chart--January BA5127(2) North Pacific Ocean Routeing Chart—February BA5127(3) North Pacific Ocean Routeing Chart--March
  • 14.
    BA5127(4) North PacificOcean Routeing Chart-April BA5127(5) North Pacific Ocean Routeing Chart-May BA5127(6) North Pacific Ocean Routeing Chart—June BA5127 (7) North Pacific Ocean Routeing Chart—Jul BA5127(8) North Pacific Ocean Routeing Chart—August BA5127(9) North Pacific Ocean Routeing Chart— September BA5127(10) North Pacific Ocean Routeing Chart—October BA5127(11) North Pacific Ocean Routeing Chart-- November BA5127(12) North Pacific Ocean Routeing Chart-- December South Pacific Ocean BA5128(1) South Pacific Ocean Routeing Chart—January BA5128(2) South Pacific Ocean Routeing Chart—February BA5128(3) South Pacific Ocean Routeing Chart--March
  • 15.
    BA5128(4) South PacificOcean Routeing Chart--April BA5128(5) South Pacific Ocean Routeing Chart—May BA5128(6) South Pacific Ocean Routeing Chart--June BA5128(7) South Pacific Ocean Routeing Chart--July BA5128(8) South Pacific Ocean Routeing Chart--August BA5128(9) South Pacific Ocean Routeing Chart-- September BA5128(10) South Pacific Ocean Routeing Chart—October BA5128(11) South Pacific Ocean Routeing Chart-- November BA5128(12) South Pacific Ocean Routeing Chart-- December
  • 16.
     A. Waveanalysis chart- These charts show isopleths(line joining all places having the same value) of wave heights, in meters, and their direction , based on actual report.  B. Wave prognosis chart-These charts show isopleths of wave heights in meter, predicted for a specified future time. They are made by professional meteorologist and based on a study of weather analysis chart, weather prognosis charts, wave analysis charts etc.
  • 19.
     A heavylift cargo ship for instance will use the wave chart during the planning of the passage to avoid areas where the wave height will be above the allowed limit for the vessel safe passage. With the use of the wave chart the vessel can be safely navigated from one part of the ocean to the other.
  • 20.
     Ice analysischart-These chart indicated amounts and boundaries of each type of ice , icepacks, ice leads and icebergs based on actual observation  Ice prognosis chart-This charts contain the same type of information as ice analysis charts. But predicted for a specified future time and are usually made 12 hours and 24 hours in advance. After studying the situation shown by the ice analysis charts and taking into account various factors such as winds, currents, temperature of air and sea etc. the prognosis charts are made by expert.
  • 26.
     Ocean currentsare the circulations of water caused by various factors. Ocean currents have two different methods of moving water. Surface currents move as a result of blowing winds and are influenced by atmospheric factors. Deep ocean currents move as a result of the density differences that are present in the ocean.  The two largest currents on earth are the Kuroshio Current which circulates near Japan, and the Antarctic Circumpolar Current, which circulates around Antarctica.
  • 27.
     Currents planan important role in navigation as well. In addition to being able to avoid trash and icebergs, knowledge of currents is essential to the reduction of shipping costs and fuel consumption. Today, shipping companies and even sailing races often use currents to reduce time spent at sea.  It is important to understand that ocean circulation is very dynamic, and this following map only shows the average position of these currents.  Additionally, this map does not show subsurface and deep ocean circulation, both of which are very important in ocean dynamics.
  • 31.
    Oya Siwo: cold current soutward past Asia KuroSiwo warm current to north East Australian warm current to south West Wind Drift circles Antarctcia Cold Peruvian current brings fish toward shore California current brings cold water south North Pacific Drift brings warm water eastward Some flow into arctic ocean
  • 32.
     Ocean currentdata can be found in a number of publication such as :-  Routeing chart.  Admiralty sailing direction.  Ocean passage for the world.
  • 36.
    Admiralty Ocean PassagesFor The World NP - 136
  • 37.
     Determining Current The Current Rose which is Represented on Routeing Chart.  High Consistency  Moderate Consistency  Low Consistency  Probable direction when observation count is low
  • 38.
     A windthat blows predominantly from a single general direction. For example the trade winds of the tropics, which blow from the east throughout the year, are prevailing winds.  The earth is encircled by several broad prevailing wind belts, which are separated by narrower regions of either subsidence or ascent. The direction and location of these wind belts are determined by solar radiation and the rotation of the earth. The three primary circulation cells are known as the: Hadley cell; Ferrell cell; and Polar cell.  The oceans of the world are covered by a set of ships board chart shows the coastline, the approximate strengths and direction of prevailing wind.  By using routeing chart we can find the information about prevailing wind.
  • 40.
     Ice isa solid form of water, or, more generally, any frozen volatile.  Sea ice occurs in both the Arctic and Antarctic.  In the Northern Hemisphere, it can currently exist as far south as Bohai Bay, China (approximately 38 degrees north latitude), which is actually about 700 kilometers (435 miles) closer to the Equator than it is to the North Pole.  In the Southern Hemisphere, sea ice only develops around Antarctica, occurring as far north as 55 degrees south latitude.  Sea ice grows during the winter months and melts during the summer months, but some sea ice remains all year in certain regions. About 15 percent of the world's oceans are covered by sea ice during part of the year.
  • 41.
     Navtex isa navigational telex service developed by IMO, and broadcasted by means of narrow band direct printing techniques on the frequency 518 kHz, for the promulgation of navigational, meteorological warnings and urgent information to ships. It is incorporated in the GMDSS and is achieved by transmitters allocated to cover a specific Navtex area..  The other components of the total GMDSS are:  Radio telephony broadcasts, VHF out to 30 miles, MF to 150 miles, HF worldwide,  The International Maritime Satellite (INMARSAT) Safety NET over the oceans, roughly 65°N to 65°S.,  HF radio-facsimile and radio-teletype.
  • 42.