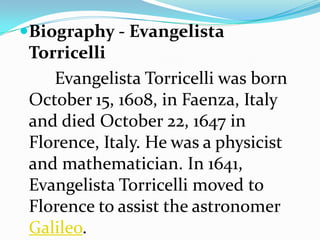
Meteorology is the scientific study of the atmosphere and weather forecasting. The word was coined from Aristotle's book Meteorologica in ancient Greece, which described earth sciences including weather. Significant progress occurred in the 18th century with observing networks and breakthroughs in the 20th century after computer development. Key early inventions included Galileo's thermometer, Torricelli's barometer, and weather instruments to measure variables like wind, humidity and rainfall. Modern meteorology has benefited from technology allowing rapid data sharing and atmospheric probing with balloons, satellites and radars.
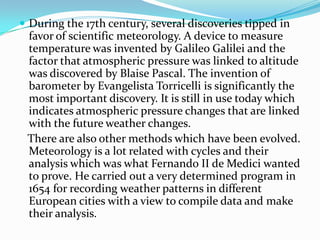
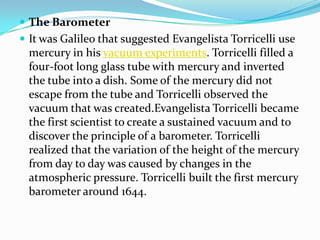
TEMPERATURE
COMPOSITION OF THE ATMOSPHERE
Layers of the ATMOSPHERE
WEATHER and CLIMATE
LATITUDINAL ZONES
ELEMENTS & CONTROLS OF WEATHER & CLIMATE
WARM MAJOR CURRENTS OF THE WORLD
Land Breeze & Sea Breeze
A Presentation on instruments used in Meteorology as well as the Australian Indigenous knowledge of weather patterns and seasons of Kakadu National Park, Northern Territory.
This has been created for Educational Purposes for CQUniversity study in the course of Grad Dip of Learning and Teaching, Primary
This PowerPoint is one small part of the Weather and Climate unit from www.sciencepowerpoint.com. This unit consists of a five part 2500+ slide PowerPoint roadmap, 14 page bundled homework package, modified homework, detailed answer keys, 19 pages of unit notes for students who may require assistance, follow along worksheets, and many review games. The homework and lesson notes chronologically follow the PowerPoint slideshow. The answer keys and unit notes are great for support professionals. The activities and discussion questions in the slideshow are meaningful. The PowerPoint includes built-in instructions, visuals, and review questions. Also included are critical class notes (color coded red), project ideas, video links, and review games. This unit also includes four PowerPoint review games (110+ slides each with Answers), 38+ video links, lab handouts, activity sheets, rubrics, materials list, templates, guides, and much more. Also included is a 190 slide first day of school PowerPoint presentation.
Areas of Focus within The Weather and Climate Unit: -What is weather?, Climate, Importance of the Atmosphere, Components of the Atmosphere, Layers of the Atmosphere, Air Quality and Pollution, Carbon Monoxide, Ozone Layer, Ways to Avoid Skin Cancer, Air Pressure, Barometer, Air Pressure and Wind, Fronts, Wind, Global Wind, Coriolis Force, Jet Stream, Sea Breeze / Land Breeze, Mountain Winds, Mountain Rain Shadow, Wind Chill, Flight, Dangerous Weather Systems, Light, Albedo, Temperature, Thermometers, Seasons, Humidity / Condensation / Evaporation, Dew Points, Clouds, Types of Clouds, Meteorology, Weather Tools, Isotherms, Ocean Currents, Enhanced Global Warming, Greenhouse Effect, The Effects of Global Warming, Biomes, Types of Biomes. Difficulty rating 8/10.
This unit aligns with the Next Generation Science Standards and with Common Core Standards for ELA and Literacy for Science and Technical Subjects. See preview for more information
If you have any questions please feel free to contact me. Thanks again and best wishes. Sincerely, Ryan Murphy M.Ed www.sciencepowerpoint@gmail.com
C3.03: Ocean forecasting services provided by the Bureau of Meteorology - Mik...Blue Planet Symposium
The Australian Bureau of Meteorology is a national authority providing a wide range of environmental information and forecast services for the Australian community. Traditionally, the Bureau’s mission has been to observe, understand and forecast the behaviour of the atmosphere. Over the past decade and in addition to existing wave forecasting services, the Bureau has responded to the need for new products and services, in particular information, warnings and forecasts on ocean temperature, salinity, currents, tides, storm surges and tsunami warnings.
The ocean temperature, salinity and current forecasting capability that underpins these services was developed via the “BLUElink>” project which was established with participation of CSIRO, the Bureau and the Royal Australian Navy. This partnership has delivered a state-of-the-art Ocean Model, Analysis and Prediction System (OceanMAPS), deployed and run operationally by the Bureau. OceanMAPS includes an ocean model, a data assimilation system, real-time observations and atmospheric forcing.
Tide and tidal stream predictions are provided for locations around Australia and for some locations in the South Pacific. State-of-the-art tsunami monitoring and forecasting capabilities have been developed to provide tsunami warnings for Australia and all countries bordering the Indian Ocean. A new coastal forecasting capability is being developed to more accurately forecast hazards associated with sea level anomalies such as storm surges generated by tropical cyclones and mid-latitude storms.
This information ensures a more predictable ocean environment and safer communities. It provides critical capability to Australia’s maritime industries, Navy, emergency services, specialized meteorological services providers, research community and the public. Specific examples of using Bureau’s ocean forecasts in monitoring of oil spills, search-and-rescue operations, Defence, port operations and prediction of coastal hazards (tropical cyclones, storm surges and tsunamis) will be discussed.
Climate and crop modelling approach-Cropping advisories based on seasonal for...ICRISAT
In a pilot study conducted in South India, farmers who followed the cropping advisory derived from climate and crop simulation modeling earned 20% more than those who did not heed the advice.A majority of the farming community in
Hussainapuram, Kurnool, Andhra Pradesh, India, live below the poverty line. Over 50% of the cultivators hold less than two hectares of dryland. Twice in every five years the village experiences drought. Recurrent droughts force migration to nearby cities for employment. In this region the deep black soils are deficient in major and micro nutrients like nitrogen, phosphorus, sulfur, boron and zinc. Cotton, groundnut, sunflower and chickpea are the major crops in the region. Cotton growers have been the worst hit by changing rainfall patterns.
Software Delivery At the Speed of AI: Inflectra Invests In AI-Powered QualityInflectra
In this insightful webinar, Inflectra explores how artificial intelligence (AI) is transforming software development and testing. Discover how AI-powered tools are revolutionizing every stage of the software development lifecycle (SDLC), from design and prototyping to testing, deployment, and monitoring.
Learn about:
• The Future of Testing: How AI is shifting testing towards verification, analysis, and higher-level skills, while reducing repetitive tasks.
• Test Automation: How AI-powered test case generation, optimization, and self-healing tests are making testing more efficient and effective.
• Visual Testing: Explore the emerging capabilities of AI in visual testing and how it's set to revolutionize UI verification.
• Inflectra's AI Solutions: See demonstrations of Inflectra's cutting-edge AI tools like the ChatGPT plugin and Azure Open AI platform, designed to streamline your testing process.
Whether you're a developer, tester, or QA professional, this webinar will give you valuable insights into how AI is shaping the future of software delivery.
JMeter webinar - integration with InfluxDB and GrafanaRTTS
Watch this recorded webinar about real-time monitoring of application performance. See how to integrate Apache JMeter, the open-source leader in performance testing, with InfluxDB, the open-source time-series database, and Grafana, the open-source analytics and visualization application.
In this webinar, we will review the benefits of leveraging InfluxDB and Grafana when executing load tests and demonstrate how these tools are used to visualize performance metrics.
Length: 30 minutes
Session Overview
-------------------------------------------
During this webinar, we will cover the following topics while demonstrating the integrations of JMeter, InfluxDB and Grafana:
- What out-of-the-box solutions are available for real-time monitoring JMeter tests?
- What are the benefits of integrating InfluxDB and Grafana into the load testing stack?
- Which features are provided by Grafana?
- Demonstration of InfluxDB and Grafana using a practice web application
To view the webinar recording, go to:
https://www.rttsweb.com/jmeter-integration-webinar
Connector Corner: Automate dynamic content and events by pushing a buttonDianaGray10
Here is something new! In our next Connector Corner webinar, we will demonstrate how you can use a single workflow to:
Create a campaign using Mailchimp with merge tags/fields
Send an interactive Slack channel message (using buttons)
Have the message received by managers and peers along with a test email for review
But there’s more:
In a second workflow supporting the same use case, you’ll see:
Your campaign sent to target colleagues for approval
If the “Approve” button is clicked, a Jira/Zendesk ticket is created for the marketing design team
But—if the “Reject” button is pushed, colleagues will be alerted via Slack message
Join us to learn more about this new, human-in-the-loop capability, brought to you by Integration Service connectors.
And...
Speakers:
Akshay Agnihotri, Product Manager
Charlie Greenberg, Host
GraphRAG is All You need? LLM & Knowledge GraphGuy Korland
Guy Korland, CEO and Co-founder of FalkorDB, will review two articles on the integration of language models with knowledge graphs.
1. Unifying Large Language Models and Knowledge Graphs: A Roadmap.
https://arxiv.org/abs/2306.08302
2. Microsoft Research's GraphRAG paper and a review paper on various uses of knowledge graphs:
https://www.microsoft.com/en-us/research/blog/graphrag-unlocking-llm-discovery-on-narrative-private-data/
Essentials of Automations: Optimizing FME Workflows with ParametersSafe Software
Are you looking to streamline your workflows and boost your projects’ efficiency? Do you find yourself searching for ways to add flexibility and control over your FME workflows? If so, you’re in the right place.
Join us for an insightful dive into the world of FME parameters, a critical element in optimizing workflow efficiency. This webinar marks the beginning of our three-part “Essentials of Automation” series. This first webinar is designed to equip you with the knowledge and skills to utilize parameters effectively: enhancing the flexibility, maintainability, and user control of your FME projects.
Here’s what you’ll gain:
- Essentials of FME Parameters: Understand the pivotal role of parameters, including Reader/Writer, Transformer, User, and FME Flow categories. Discover how they are the key to unlocking automation and optimization within your workflows.
- Practical Applications in FME Form: Delve into key user parameter types including choice, connections, and file URLs. Allow users to control how a workflow runs, making your workflows more reusable. Learn to import values and deliver the best user experience for your workflows while enhancing accuracy.
- Optimization Strategies in FME Flow: Explore the creation and strategic deployment of parameters in FME Flow, including the use of deployment and geometry parameters, to maximize workflow efficiency.
- Pro Tips for Success: Gain insights on parameterizing connections and leveraging new features like Conditional Visibility for clarity and simplicity.
We’ll wrap up with a glimpse into future webinars, followed by a Q&A session to address your specific questions surrounding this topic.
Don’t miss this opportunity to elevate your FME expertise and drive your projects to new heights of efficiency.
Search and Society: Reimagining Information Access for Radical FuturesBhaskar Mitra
The field of Information retrieval (IR) is currently undergoing a transformative shift, at least partly due to the emerging applications of generative AI to information access. In this talk, we will deliberate on the sociotechnical implications of generative AI for information access. We will argue that there is both a critical necessity and an exciting opportunity for the IR community to re-center our research agendas on societal needs while dismantling the artificial separation between the work on fairness, accountability, transparency, and ethics in IR and the rest of IR research. Instead of adopting a reactionary strategy of trying to mitigate potential social harms from emerging technologies, the community should aim to proactively set the research agenda for the kinds of systems we should build inspired by diverse explicitly stated sociotechnical imaginaries. The sociotechnical imaginaries that underpin the design and development of information access technologies needs to be explicitly articulated, and we need to develop theories of change in context of these diverse perspectives. Our guiding future imaginaries must be informed by other academic fields, such as democratic theory and critical theory, and should be co-developed with social science scholars, legal scholars, civil rights and social justice activists, and artists, among others.
The Art of the Pitch: WordPress Relationships and SalesLaura Byrne
Clients don’t know what they don’t know. What web solutions are right for them? How does WordPress come into the picture? How do you make sure you understand scope and timeline? What do you do if sometime changes?
All these questions and more will be explored as we talk about matching clients’ needs with what your agency offers without pulling teeth or pulling your hair out. Practical tips, and strategies for successful relationship building that leads to closing the deal.
PHP Frameworks: I want to break free (IPC Berlin 2024)Ralf Eggert
In this presentation, we examine the challenges and limitations of relying too heavily on PHP frameworks in web development. We discuss the history of PHP and its frameworks to understand how this dependence has evolved. The focus will be on providing concrete tips and strategies to reduce reliance on these frameworks, based on real-world examples and practical considerations. The goal is to equip developers with the skills and knowledge to create more flexible and future-proof web applications. We'll explore the importance of maintaining autonomy in a rapidly changing tech landscape and how to make informed decisions in PHP development.
This talk is aimed at encouraging a more independent approach to using PHP frameworks, moving towards a more flexible and future-proof approach to PHP development.
Transcript: Selling digital books in 2024: Insights from industry leaders - T...BookNet Canada
The publishing industry has been selling digital audiobooks and ebooks for over a decade and has found its groove. What’s changed? What has stayed the same? Where do we go from here? Join a group of leading sales peers from across the industry for a conversation about the lessons learned since the popularization of digital books, best practices, digital book supply chain management, and more.
Link to video recording: https://bnctechforum.ca/sessions/selling-digital-books-in-2024-insights-from-industry-leaders/
Presented by BookNet Canada on May 28, 2024, with support from the Department of Canadian Heritage.
Epistemic Interaction - tuning interfaces to provide information for AI supportAlan Dix
Paper presented at SYNERGY workshop at AVI 2024, Genoa, Italy. 3rd June 2024
https://alandix.com/academic/papers/synergy2024-epistemic/
As machine learning integrates deeper into human-computer interactions, the concept of epistemic interaction emerges, aiming to refine these interactions to enhance system adaptability. This approach encourages minor, intentional adjustments in user behaviour to enrich the data available for system learning. This paper introduces epistemic interaction within the context of human-system communication, illustrating how deliberate interaction design can improve system understanding and adaptation. Through concrete examples, we demonstrate the potential of epistemic interaction to significantly advance human-computer interaction by leveraging intuitive human communication strategies to inform system design and functionality, offering a novel pathway for enriching user-system engagements.
UiPath Test Automation using UiPath Test Suite series, part 3DianaGray10
Welcome to UiPath Test Automation using UiPath Test Suite series part 3. In this session, we will cover desktop automation along with UI automation.
Topics covered:
UI automation Introduction,
UI automation Sample
Desktop automation flow
Pradeep Chinnala, Senior Consultant Automation Developer @WonderBotz and UiPath MVP
Deepak Rai, Automation Practice Lead, Boundaryless Group and UiPath MVP
Accelerate your Kubernetes clusters with Varnish CachingThijs Feryn
A presentation about the usage and availability of Varnish on Kubernetes. This talk explores the capabilities of Varnish caching and shows how to use the Varnish Helm chart to deploy it to Kubernetes.
This presentation was delivered at K8SUG Singapore. See https://feryn.eu/presentations/accelerate-your-kubernetes-clusters-with-varnish-caching-k8sug-singapore-28-2024 for more details.
DevOps and Testing slides at DASA ConnectKari Kakkonen
My and Rik Marselis slides at 30.5.2024 DASA Connect conference. We discuss about what is testing, then what is agile testing and finally what is Testing in DevOps. Finally we had lovely workshop with the participants trying to find out different ways to think about quality and testing in different parts of the DevOps infinity loop.
2. The word 'meteorology' was coined from a research book called 'Meteorologica' which was written by Aristotle, a Greek scientist and philosopher. This early work described the science of earth like its geology, elements, hydrology, seas, wind and weather. In the modern term, the term meteorology explains a complete science. It is for understanding the dynamics of atmosphere and forecasting weather phenomena like hurricanes and thunderstorms.Weather forecasting was practiced since the beginning of time with more or less accuracy. Historical records show several examples of weather predicting methods based on observing surrounding elements.
3. Meteorology is the interdisciplinary scientific study of the atmosphere that focuses on weather processes and short term forecasting (in contrast with climatology). Studies in the field stretch back millennia, though significant progress in meteorology did not occur until the eighteenth century. The nineteenth century saw breakthroughs occur after observing networks developed across several countries. Breakthroughs in weather forecasting were achieved in the latter half of the twentieth century, after the development of the computer.
4. Sky is undoubtedly the first indicator used in meteorology its cover and nature of clouds provides clues of the upcoming temperature and weather. The wind factor is also important and is associated with temperature and often rains. Animals and birds are also known to give indications about the future weather. Scientists across the world since ancient times have tried to understand the meteorological phenomena like wind and rain. Many instruments for measuring wind power, humidity and rain were invented in the early 15th century.
5. During the 17th century, several discoveries tipped in favor of scientific meteorology. A device to measure temperature was invented by Galileo Galilei and the factor that atmospheric pressure was linked to altitude was discovered by Blaise Pascal. The invention of barometer by Evangelista Torricelli is significantly the most important discovery. It is still in use today which indicates atmospheric pressure changes that are linked with the future weather changes. There are also other methods which have been evolved. Meteorology is a lot related with cycles and their analysis which was what Fernando II de Medici wanted to prove. He carried out a very determined program in 1654 for recording weather patterns in different European cities with a view to compile data and make their analysis.
6. Other breakthroughs were followed in the 18th century and science was taken to a new level. A modern mercury based thermometer was invented by Gabriel Fahrenheit. Theories about hydrodynamics were devised by Daniel Bernoulli and those theories had helped greatly in understanding the atmospheric changes. When the theory of thermodynamics and atmospheric pressures were adapted, no real changes were important for understanding meteorology. In recent times, focus has been given on meteorological tools for its improvement and attaining better accuracy results. A tremendous boost was given to meteorology because of the technology in two ways. The first is the ability to communicate results and analysis with timing, it was made possible due to the invention of telegraph. The second is the ability of probing skies with using balloons, satellites and radars. Meteorology is a part of our everyday lives. People are kept updated about the changing weather with dedicated channels and mobile devices. The science is still progressing and is an important element of the economy with many industries like agriculture and civil aviation depending on it.
8. By defintion the weather is "the state of the atmosphere at a given time and place, with respect to variables such as temperature, moisture, wind velocity, and barometric pressure.“
10. Measuring the Weather In the early days of the Weather Bureau numerous clever mechanical devices were invented to measure and record any and every meteorological (weather) parameter conceivable: ombroscope or rainfall recorder, mechanical anemometer or wind speed indicator, remote readout wind vane, pole star recorder.
11. Mechanical Anemometer In 1450, the Italian art architect Leon Battista Alberti invented the first mechanical anemometer. This instrument consisted of a disk placed perpendicular to the wind. It would rotate by the force of the wind, and by the angle of inclination of the disk the wind force momentary showed itself. The same type of anemometer was later re-invented by Englishman Robert Hooke who is often mistakenly considered the inventor of the first anemometer. The Mayans were also building wind towers (anemometers) at the same time as Hooke. Another reference credits Wolfius as re-inventing the anemometer in 1709.
12. Hemispherical Cup Anemometer The hemispherical cup anemometer (still used today) was invented in 1846 by Irish researcher, John Thomas Romney Robinson and consisted of four hemispherical cups. The cups rotated horizontally with the wind and a combination of wheels recorded the number of revolutions in a given time. Want to build your own hemispherical cup anemometer.
13. Sonic Anemometer A sonic anemometer determines instantaneous wind speed and direction (turbulence) by measuring how much sound waves traveling between a pair of transducers are sped up or slowed down by the effect of the wind. The sonic anemometer was invented by geologist Dr. Andreas Pflitsch in 1994.
14. Barometer - Pronunciation: [b u rom´ u t u r] - a barometer is an instrument for measuring atmospheric pressure. Two common types are the aneroid barometer and the mercurial barometer (invented first). Evangelista Torricelli invented the first barometer, known as the "Torricelli's tube".
15. Biography - Evangelista Torricelli Evangelista Torricelli was born October 15, 1608, in Faenza, Italy and died October 22, 1647 in Florence, Italy. He was a physicist and mathematician. In 1641, Evangelista Torricelli moved to Florence to assist the astronomer Galileo.
16. The Barometer It was Galileo that suggested Evangelista Torricelli use mercury in his vacuum experiments. Torricelli filled a four-foot long glass tube with mercury and inverted the tube into a dish. Some of the mercury did not escape from the tube and Torricelli observed the vacuum that was created.Evangelista Torricelli became the first scientist to create a sustained vacuum and to discover the principle of a barometer. Torricelli realized that the variation of the height of the mercury from day to day was caused by changes in the atmospheric pressure. Torricelli built the first mercury barometer around 1644.
17. Evangelista Torricelli - Other Research Evangelista Torricelli also wrote on the quadrature of the cycloid and conics, the rectifications of the logarithmic spiral, the theory of the barometer, the value of gravity found by observing the motion of two weights connected by a string passing over a fixed pulley, the theory of projectiles and the motion of fluids.
18. Lucien Vidie - Aneroid Barometer In 1843, the French scientist Lucien Vidie invented the aneroid barometer. A aneroid barometer "registers the change in the shape of an evacuated metal cell to measure variations on the atmospheric pressure." Aneriod means fluidless, no liquids are used, the metal cell is usually made of phosphor bronze or beryllium copper.
19. Altimeter The altimeter is an instrument which measures vertical distance with respect to a reference level.The altimeter is an instrument that measures the altitude of the land surface or any object such as an airplane. Louis Paul Cailletet was the French physicist who invented the altimeter and the high-pressure manometer.
20. Louis Paul Cailletet (1832-1913)French physicist and inventor who in 1877-78 was the first to liquefy oxygen, hydrogen, nitrogen, and air.
21. Radio AltimeterLloyd Espenschied invented the first radio altimeter in 1924. In 1938, the fm radio altimeter was first demonstrated in New York by Bell Labs. In the first public display of the device, radio signals were bounced off the ground, showing pilots the altitude of an aircraft.