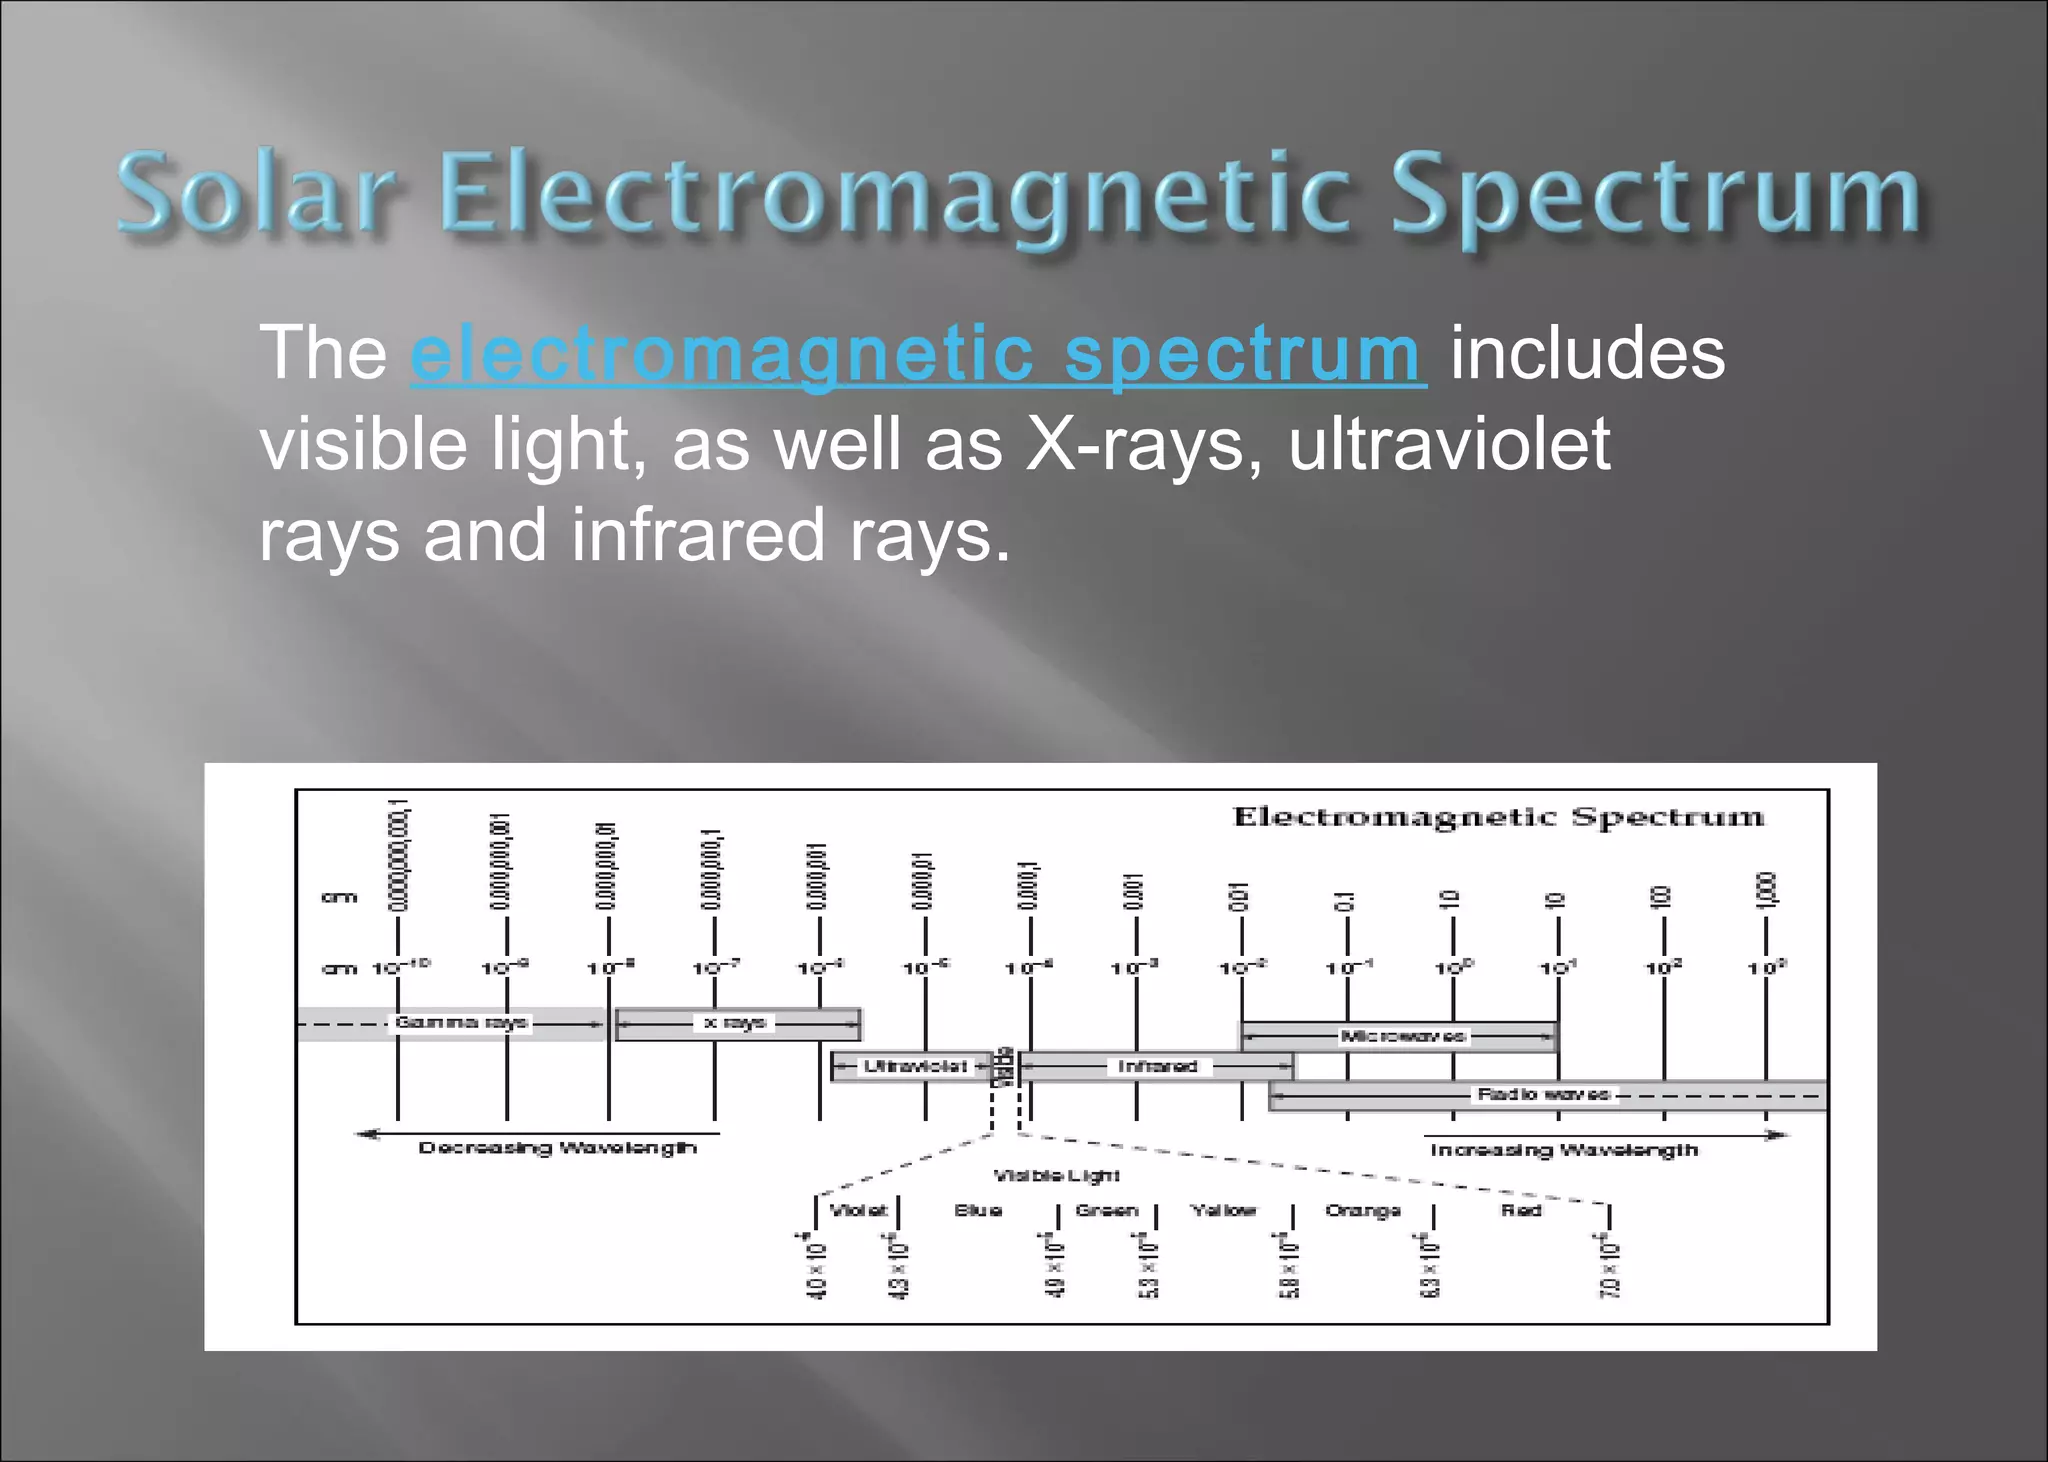
1. The document discusses key concepts about Earth's atmosphere including how solar radiation drives global climate and local weather patterns.
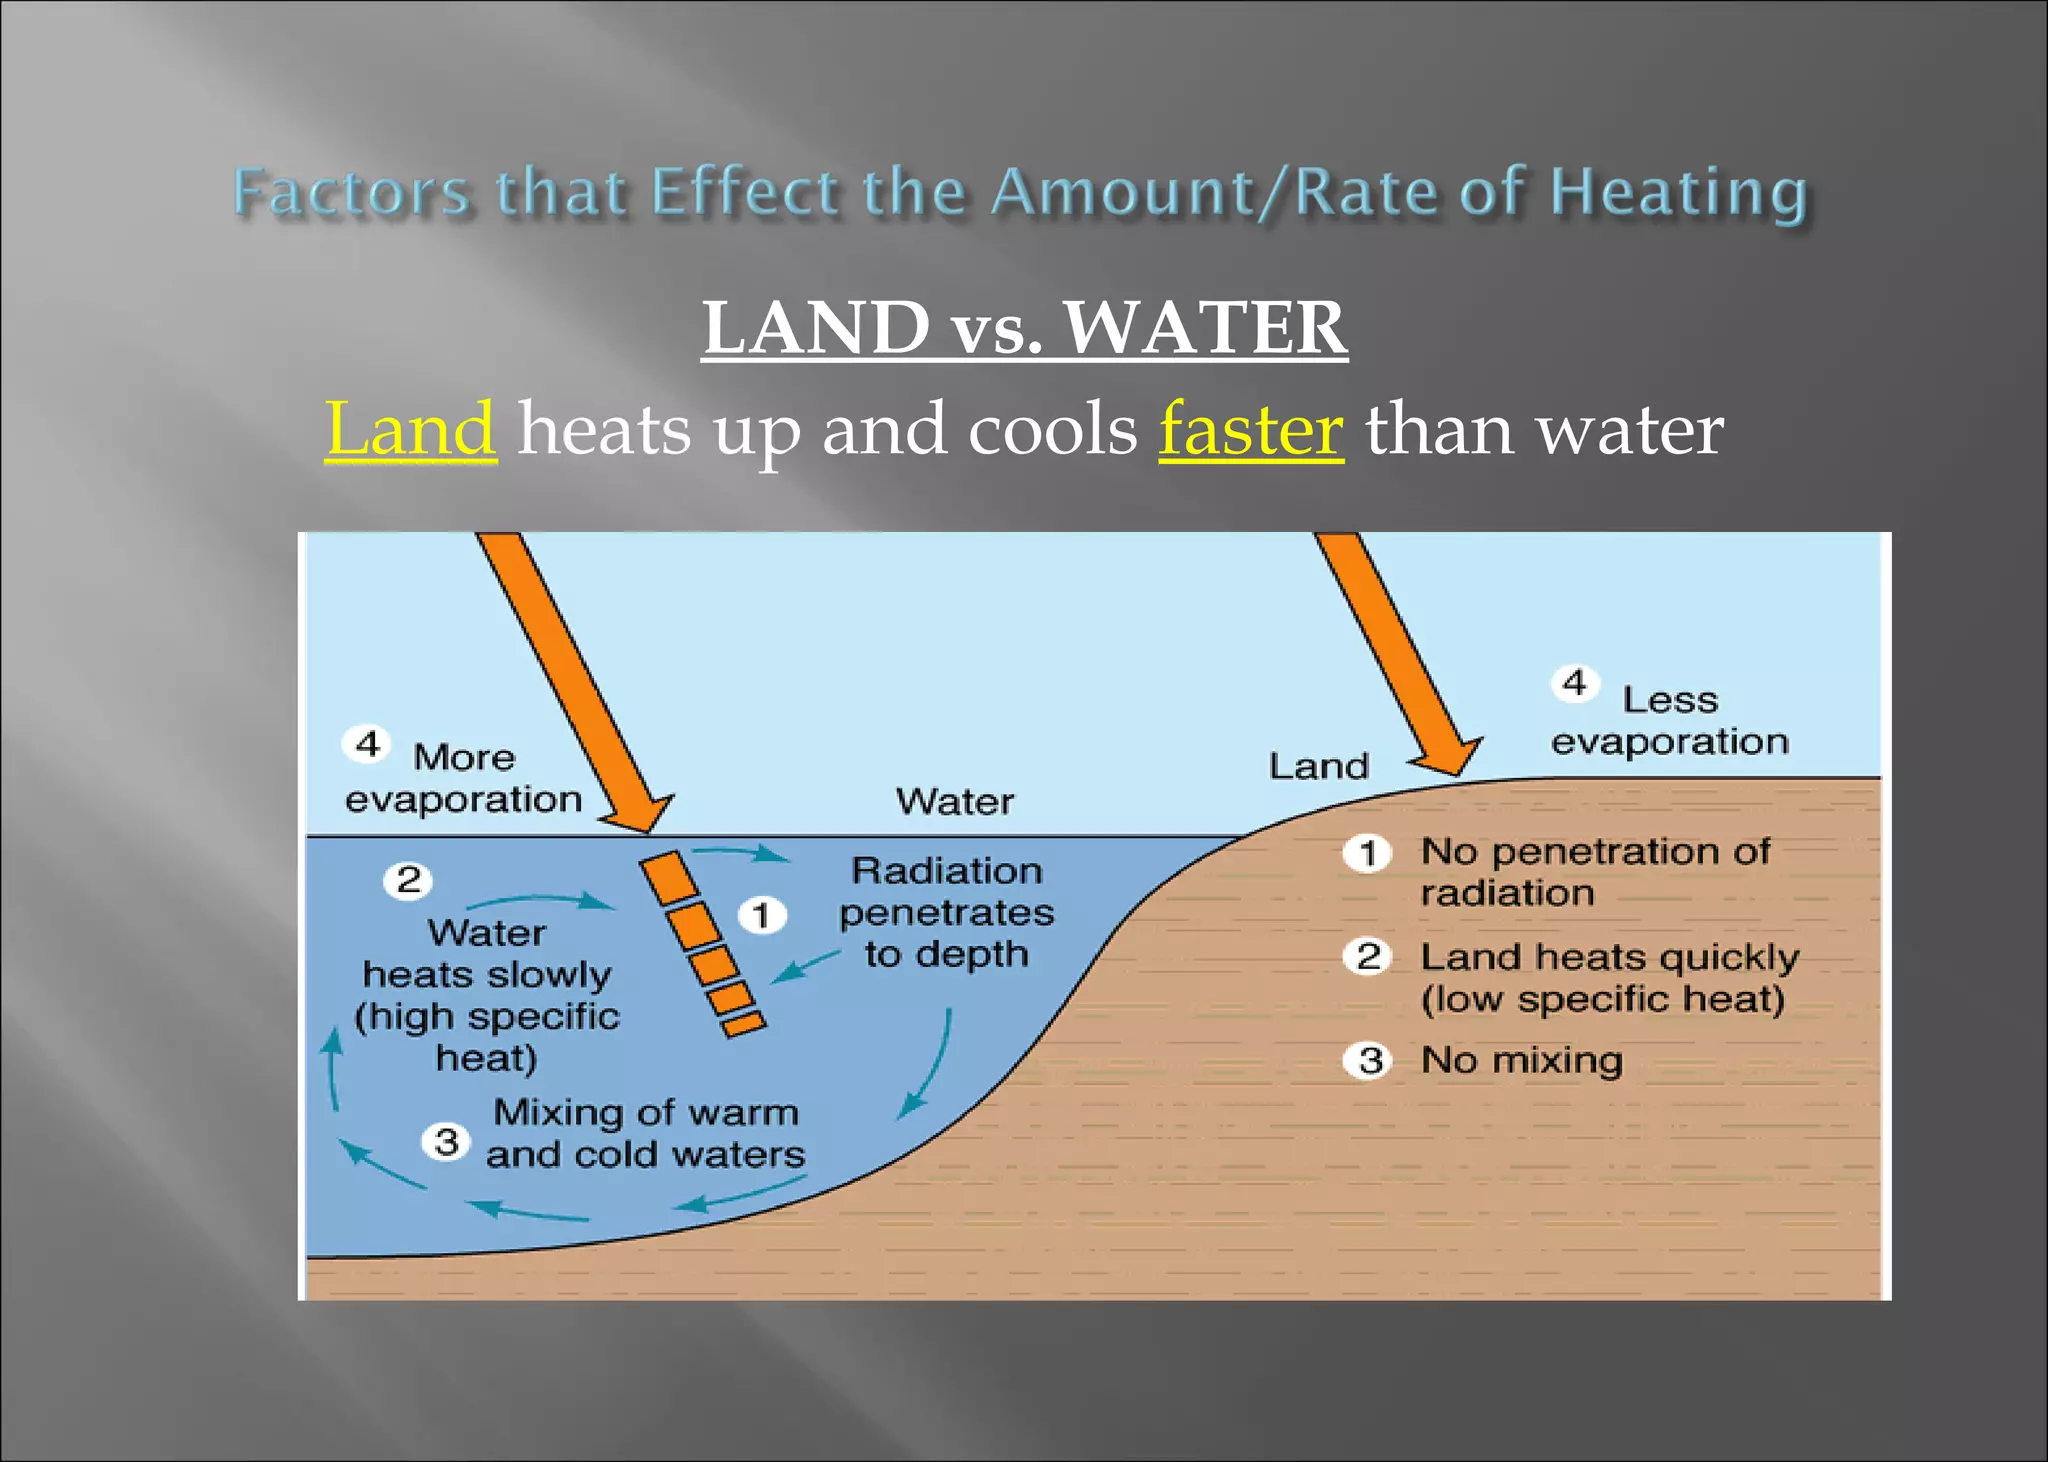
2. It explains different climate types based on factors like latitude, proximity to bodies of water, and elevation. Humid climates receive more precipitation than potential evapotranspiration while arid climates experience the opposite.
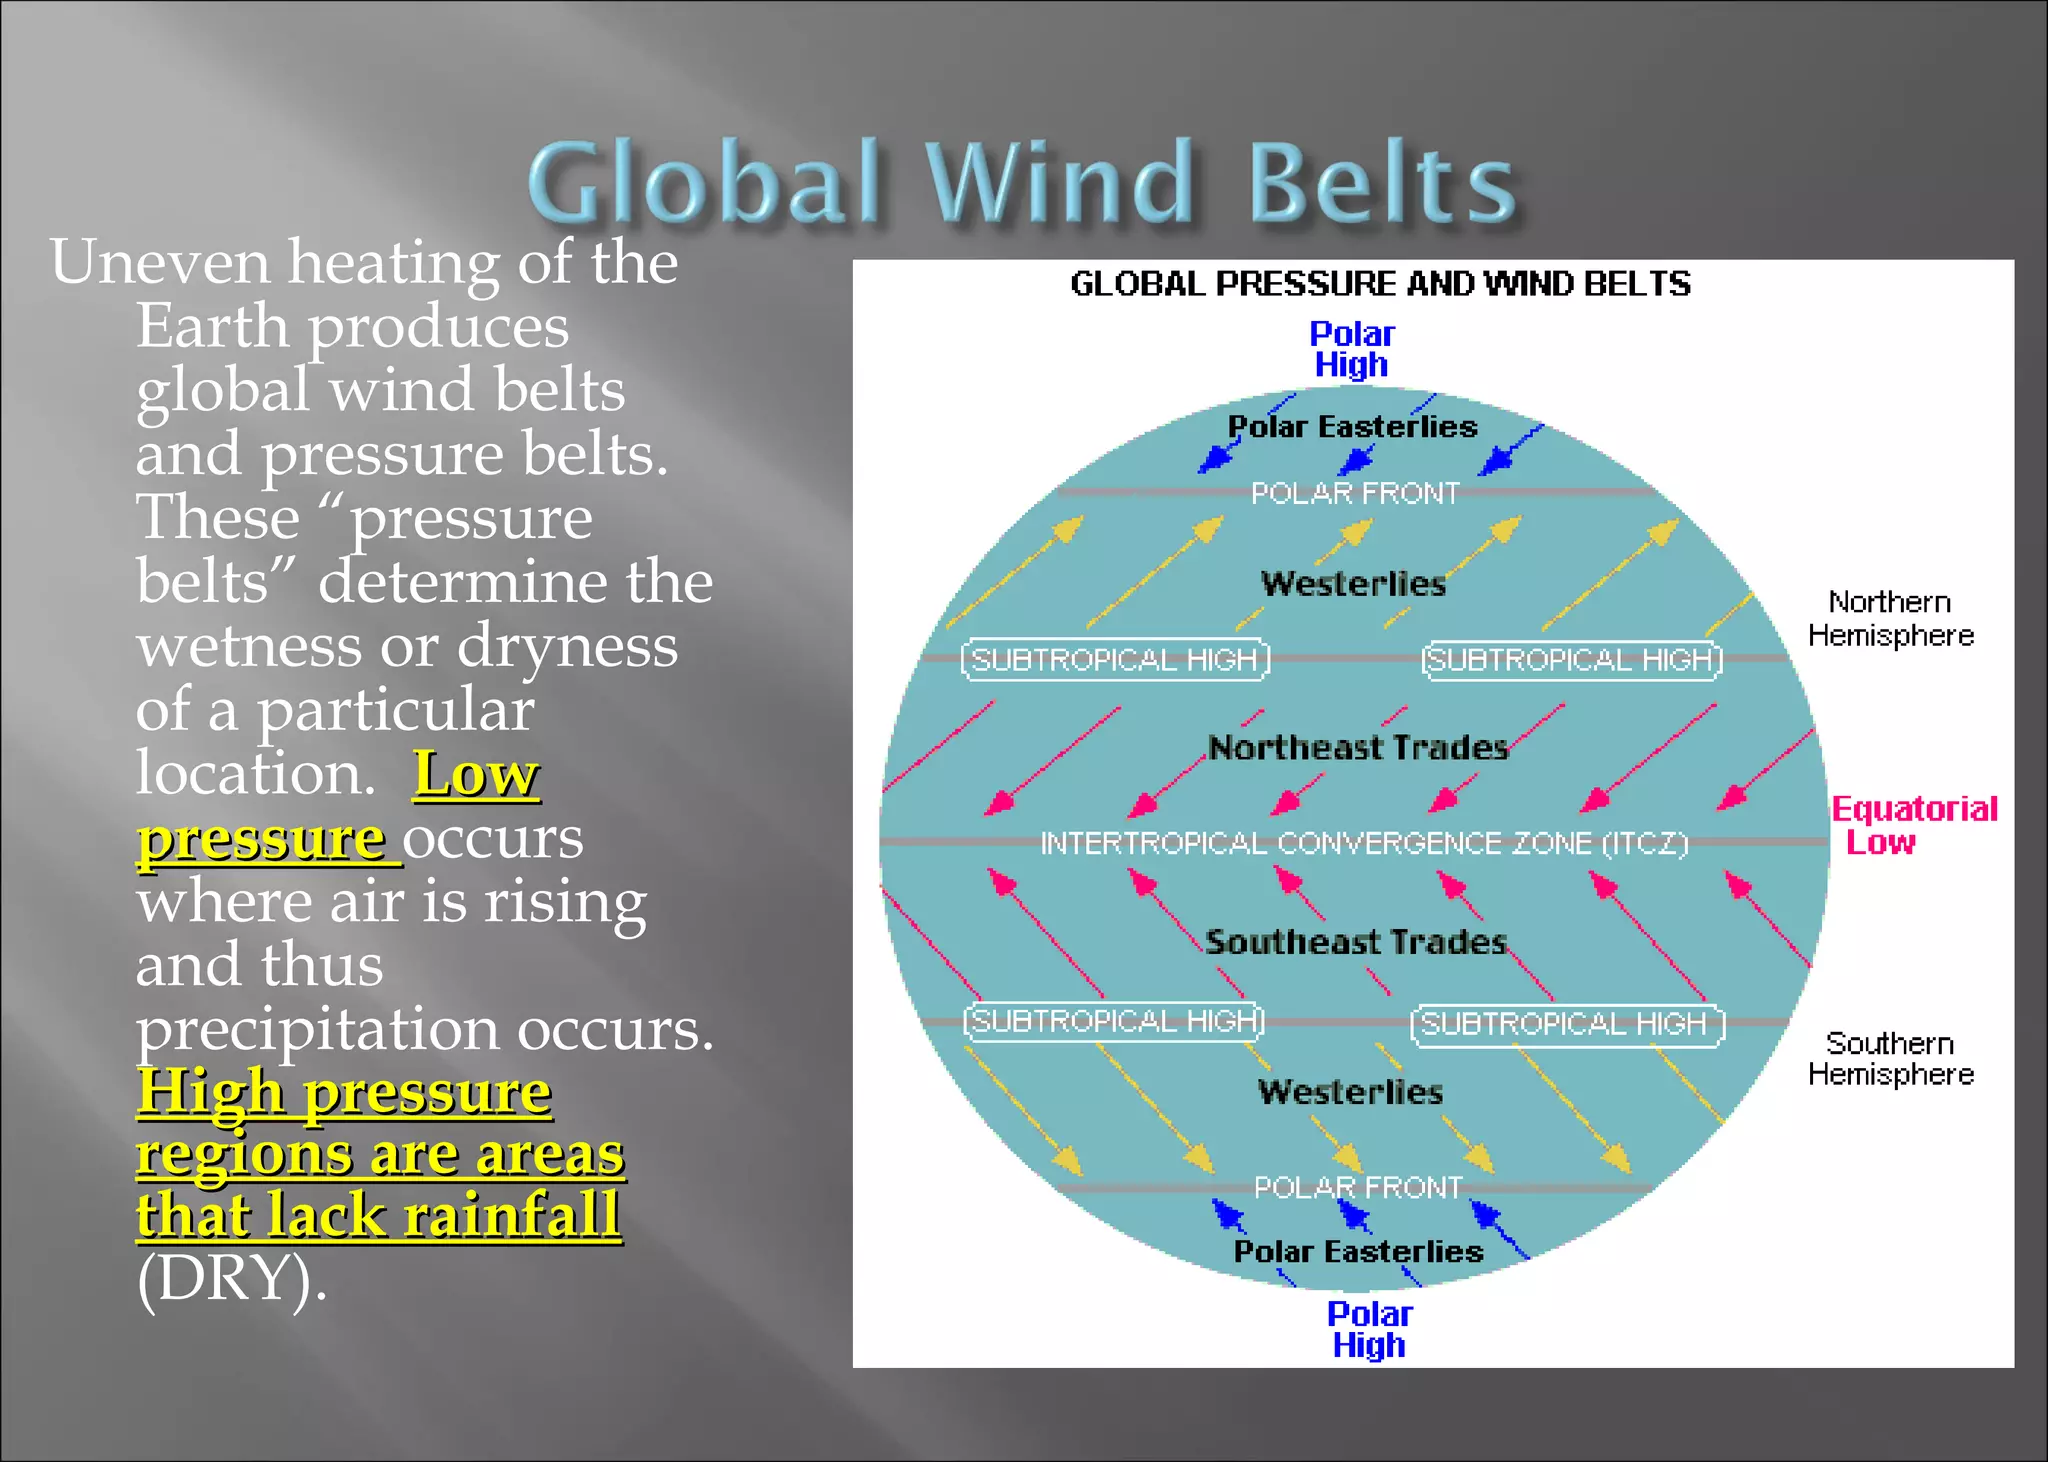
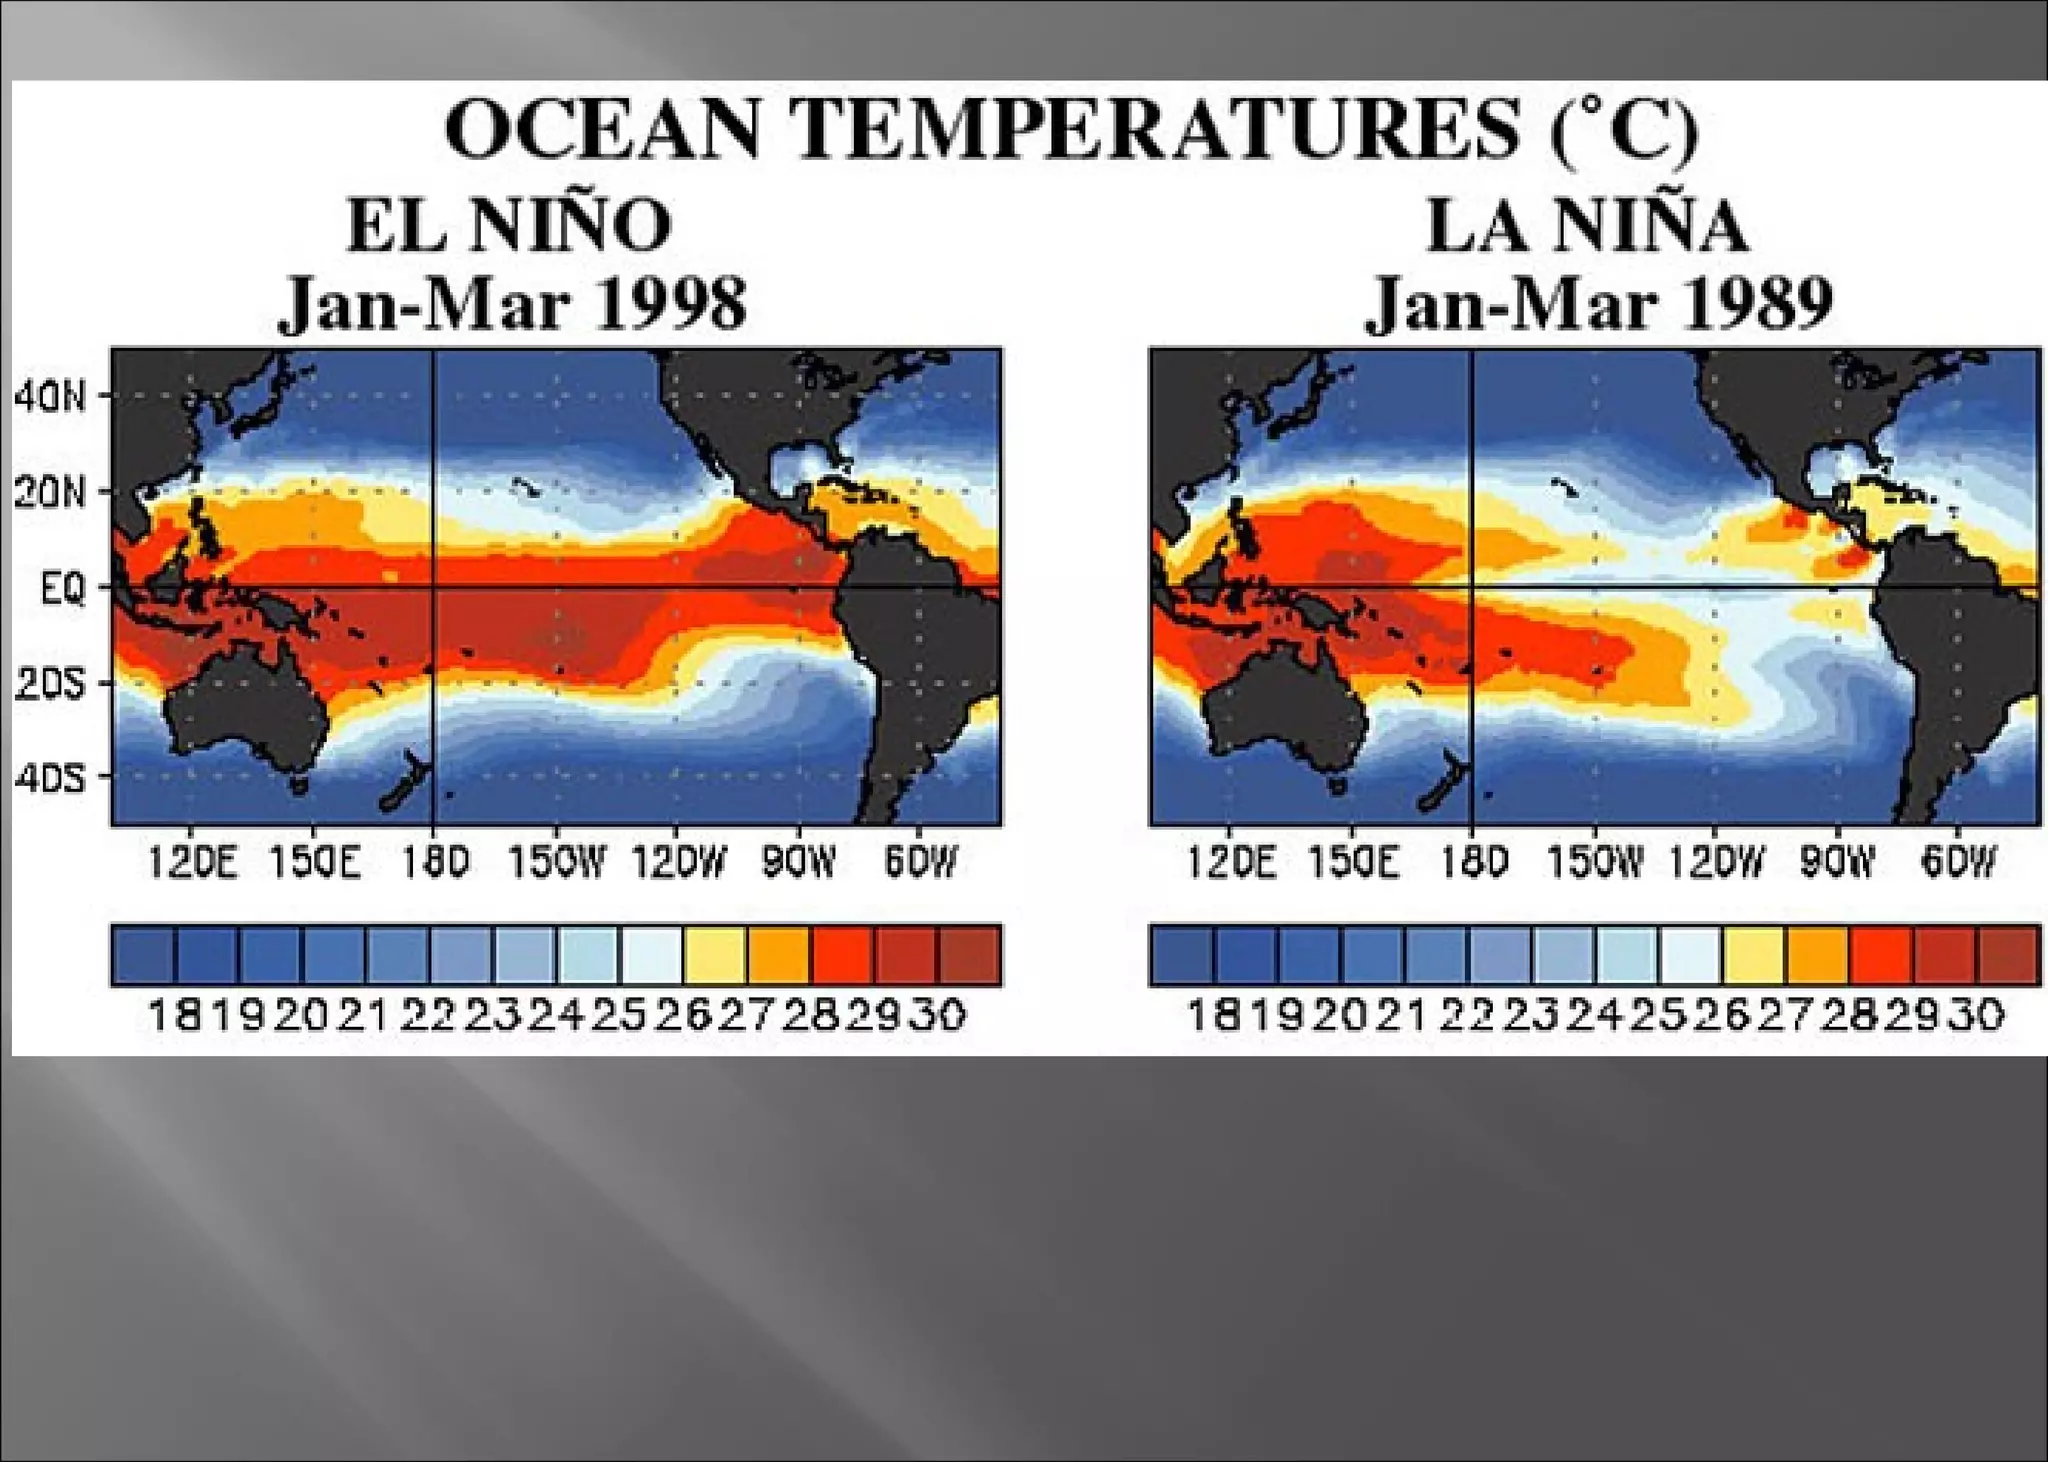
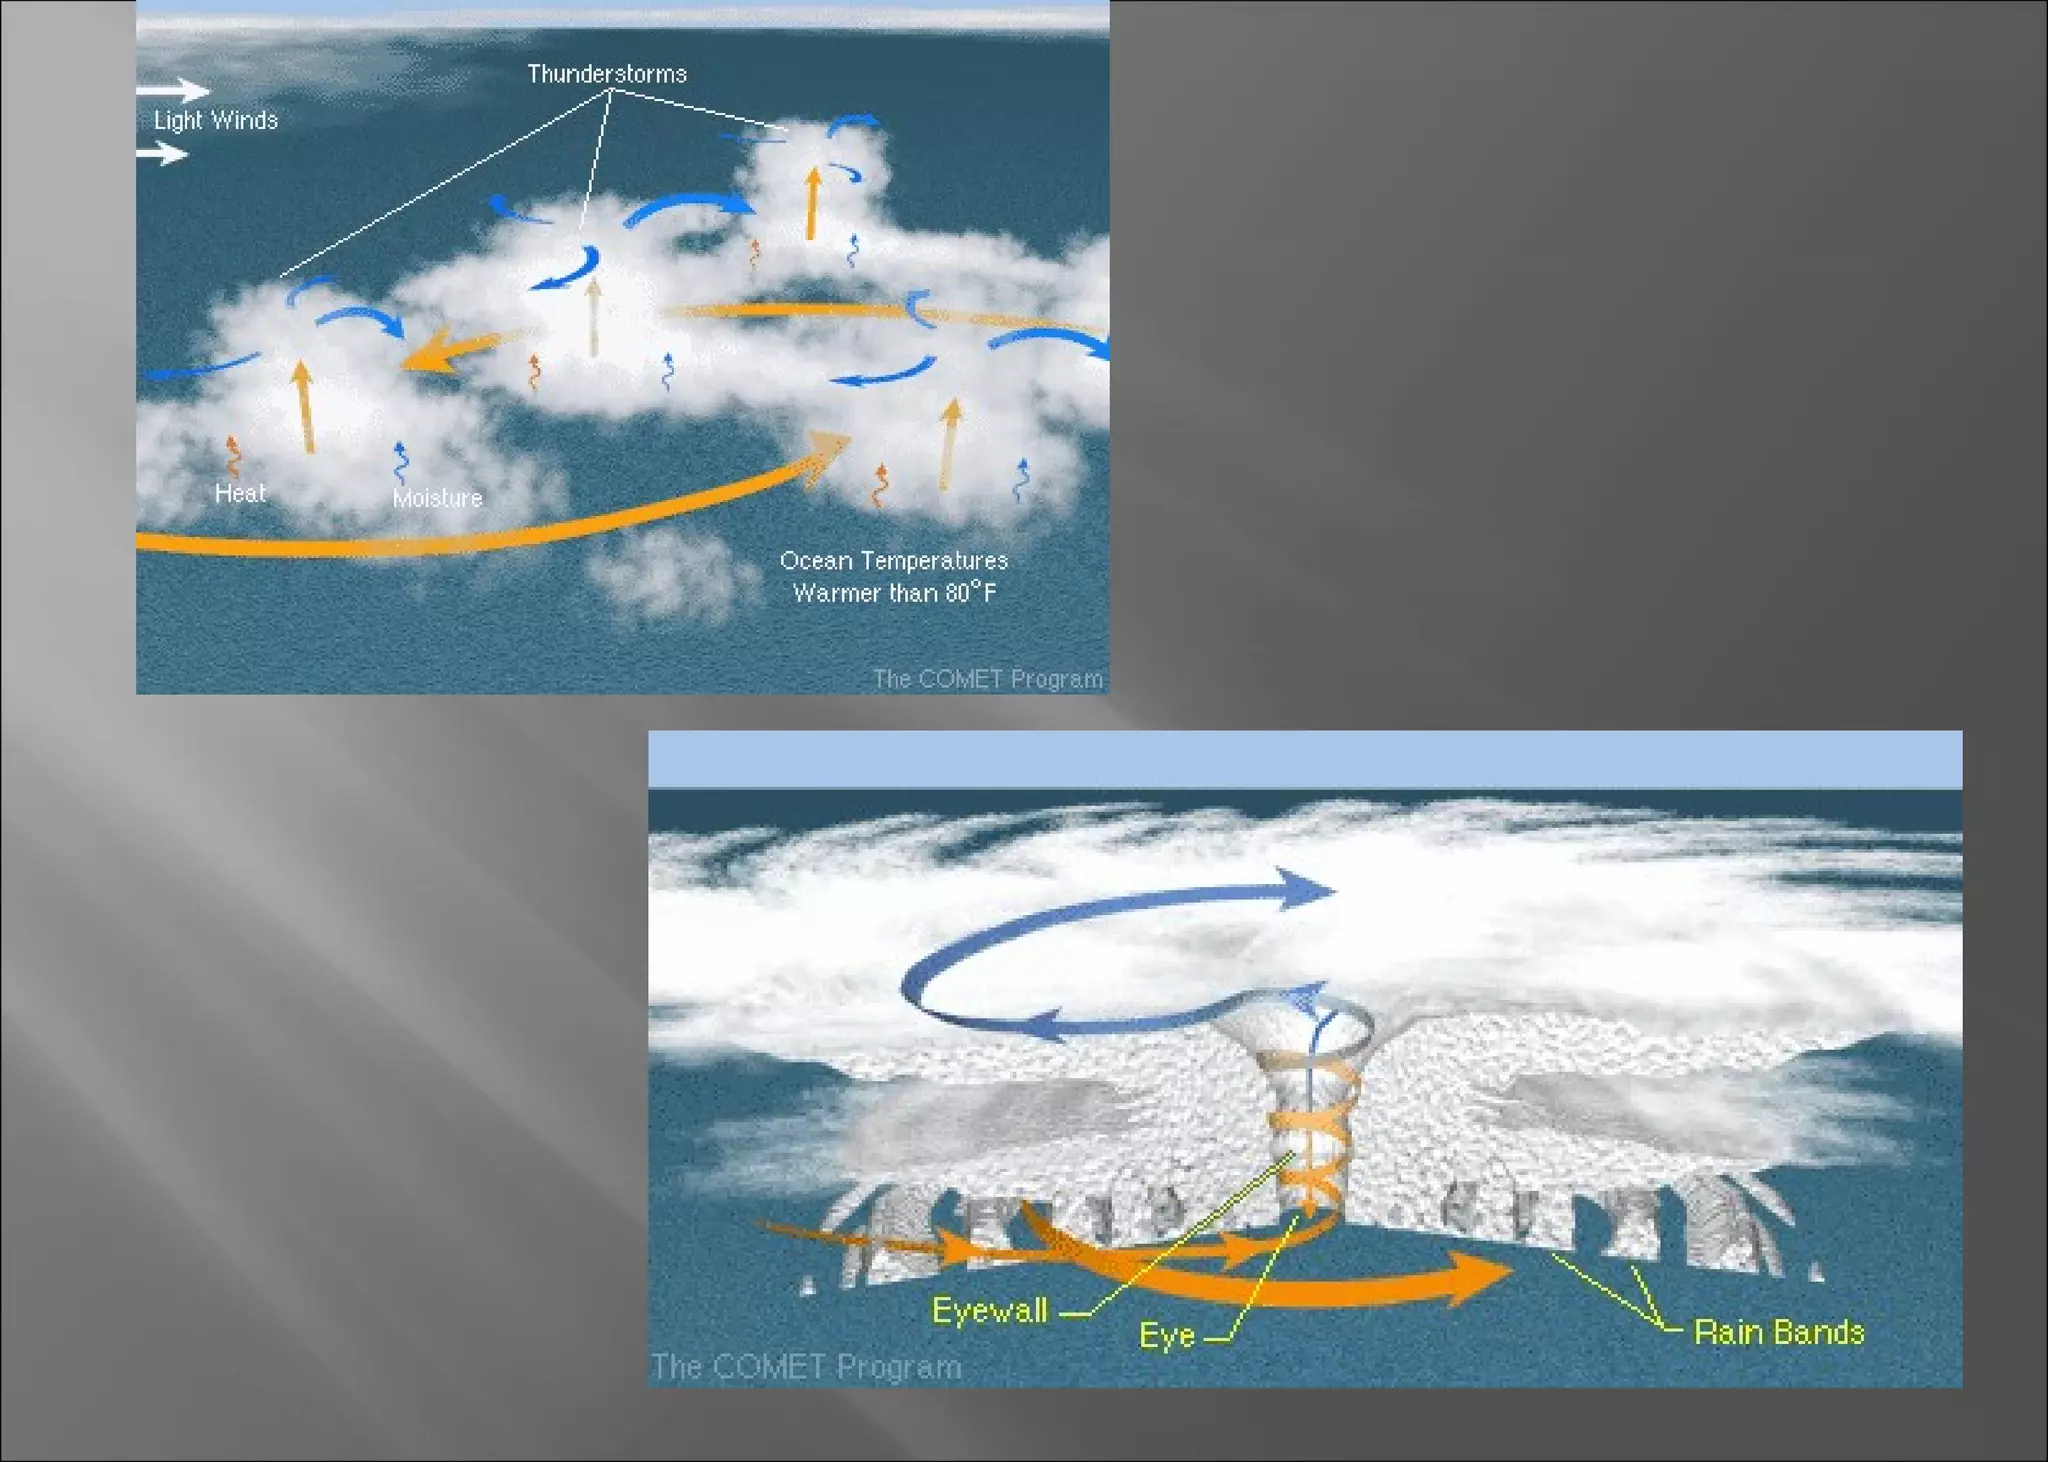
3. Atmospheric circulation patterns like global wind belts and ocean currents play an important role in moderating Earth's climate by transporting heat energy from the tropics to poles and distributing it around the globe over long time periods.