Download as PDF, PPTX

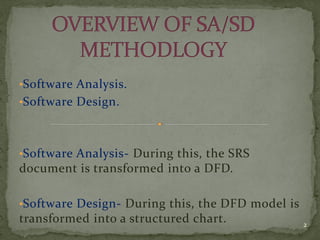
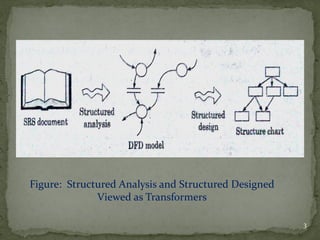
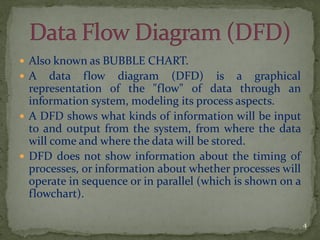
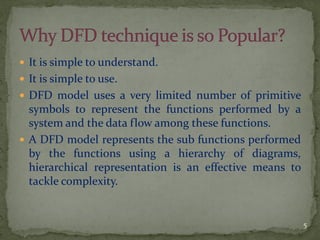
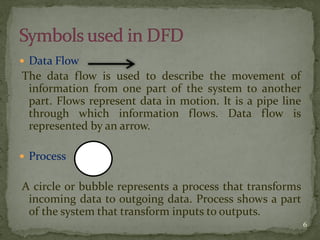
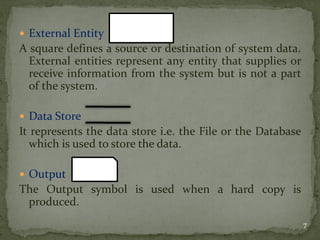
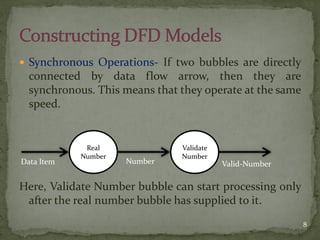


The document discusses software analysis and design, specifically the use of Data Flow Diagrams (DFDs) to represent the flow of data within an information system. DFDs utilize primitive symbols to illustrate processes, data flows, external entities, and data stores, while emphasizing the hierarchy of diagrams for complexity management. Additionally, the document highlights the importance of adhering to a data dictionary and the challenges associated with modifications in DFDs for larger applications.