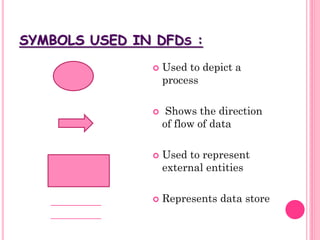
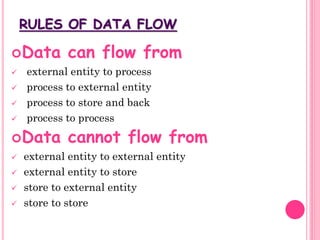
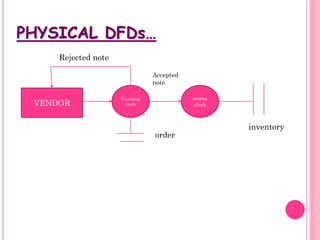
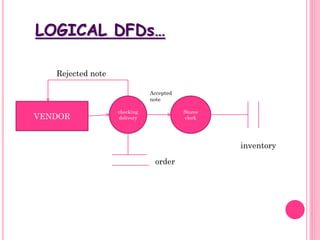
Data flow diagrams (DFDs) are a graphical representation of the system that shows how data moves through processes. DFDs were introduced by DeMarco, Gane, and Sarson and are an important tool for system analysts. A DFD shows what data the system will process, what transformations are done to the data, where data is stored, and where results flow. Common symbols in a DFD include processes, external entities, data stores, and data flows. As an example, a DFD of a mess management system was described to show students, vendors, the mess secretary, manager, and warden as external entities and requisitions as a data flow.
Data flow diagram is used in software development. It shows the flow of data through the system. It has many levels but beyond level 2 complexity increases. It is used in software engineering, Business analysis, agile development & system structures etc. It can provide a detailed representation of a system. Used as a part of system documentation file. It is very easy to understand. It has many advantages but can make the programmers little confuse concerning the system & take long time to create
Data flow Diagram
In this presentation we are going to briefly
Describe what is DFD.
Why Should Use DFD ?
Components of a generic DFD.
Levels of DFD.
DFD with an example (SMS Mela).
A graphical tool, useful for communicating with users, managers, and other personnel.
Used to perform structured analysis to determine logical requirements.
Useful for analyzing existing as well as proposed systems.
Focus on the movement of data between external entities and processes, and between processes and data stores.
A relatively simple technique to learn and use.
DDBMS, characteristics, Centralized vs. Distributed Database, Homogeneous DDBMS, Heterogeneous DDBMS, Advantages, Disadvantages, What is parallel database, Data fragmentation, Replication, Distribution Transaction
in this presentation Data Flow Diagrams (DFD),DFD Development : Basic Rules,Process Naming,Creating Context Diagram,Context Diagram,Diagram 0 (Next Level),Child Diagram,Typical Errors in DFD,Logical & physical Data Flow,Transitions,Logical vs Physical Data Flow,Reason for partitioning DFD,CRUD Matrix,Event Response Table,Use Case and Flow Diagrams..
the ppt contains the overview about the Data Flow Diagram.it will be the simple powerpoint file and it contains a brief view on elements of the Data Flow Diagram,it also contains the level 0 and level 1 diagrams.
You can get clear knowledge about the functional dependencies in "Normalization". And also the rules, types of FDs and finally the closure and its applications
A data flow diagram (DFD) is a graphical representation of the "flow" of data through an information system. Get the detailed dataflow diagram tutorial about the symbols with the example.
For more such innovative content on management studies, join WeSchool PGDM-DLP Program: http://bit.ly/welingkarshybridDlp
Join us on Facebook: http://www.facebook.com/welearnindia
Follow us on Twitter: https://twitter.com/WeLearnIndia
Read our latest blog at: http://welearnindia.wordpress.com
Subscribe to our Slideshare Channel: http://www.slideshare.net/welingkarDLP
Warehouse Operations and Inventory Management Thomas Tanel
Companies that make the best use of the basic principles of planning and managing warehouse operations and inventory management have a competitive advantage. Organizations that lack warehouse strategic planning and inventory operational excellence lose profits, market share, cost advantages, and market leadership.
Traditional Supply Chain and Logistics channels are indeed changing. As organizations move from mass production and mass distribution to mass customization, creative approaches are needed in the management of warehousing and inventory. The challenge is always present, because different customers may demand different levels of service. Demand often cannot be forecasted, especially if one must deliver customized products or services exactly where the customer needs them.
Businesses today must understand that they are competing on the basis of time more than on any other factor. The rigors of supply chain management require that you take action to meet your customers’ demand for faster, more frequent, and more reliable deliveries. Your suppliers need to meet increasingly precise inbound schedules. Tomorrow’s customers are more likely to be in another country or continent than they are likely to be from across town, in another state, or in another province.
With a proven inventory management system and an A-B-C Analysis, you can transform your inventory into a proactive force that lowers your inventory investment, reduces carrying costs, boosts confidence in physical supply and distribution service levels, and increases customer and user satisfaction. From a storage and distribution perspective, you, as overseer of the supply management process, should also know how the warehousing layout design criteria and the space and storage schemes affect your material flow, service levels, computerization, and technology options.
A data flow diagram (DFD) illustrates how data is processed by a system in terms of inputs and outputs. As its name indicates its focus is on the flow of information, where data comes from, where it goes and how it gets stored.
Adolescents & media challenges in 21 st centuryshhajira
ADOLESCENTS THEN & NOW
BENEFITS OF ADOLESCENTS USING SOCIAL MEDIA
RISKS OF YOUTHS USING SOCIAL MEDIA
Meeting the challenges of adolescents in the world of creative writing
Kubernetes & AI - Beauty and the Beast !?! @KCD Istanbul 2024Tobias Schneck
As AI technology is pushing into IT I was wondering myself, as an “infrastructure container kubernetes guy”, how get this fancy AI technology get managed from an infrastructure operational view? Is it possible to apply our lovely cloud native principals as well? What benefit’s both technologies could bring to each other?
Let me take this questions and provide you a short journey through existing deployment models and use cases for AI software. On practical examples, we discuss what cloud/on-premise strategy we may need for applying it to our own infrastructure to get it to work from an enterprise perspective. I want to give an overview about infrastructure requirements and technologies, what could be beneficial or limiting your AI use cases in an enterprise environment. An interactive Demo will give you some insides, what approaches I got already working for real.
The Art of the Pitch: WordPress Relationships and SalesLaura Byrne
Clients don’t know what they don’t know. What web solutions are right for them? How does WordPress come into the picture? How do you make sure you understand scope and timeline? What do you do if sometime changes?
All these questions and more will be explored as we talk about matching clients’ needs with what your agency offers without pulling teeth or pulling your hair out. Practical tips, and strategies for successful relationship building that leads to closing the deal.
Smart TV Buyer Insights Survey 2024 by 91mobiles.pdf91mobiles
91mobiles recently conducted a Smart TV Buyer Insights Survey in which we asked over 3,000 respondents about the TV they own, aspects they look at on a new TV, and their TV buying preferences.
Transcript: Selling digital books in 2024: Insights from industry leaders - T...BookNet Canada
The publishing industry has been selling digital audiobooks and ebooks for over a decade and has found its groove. What’s changed? What has stayed the same? Where do we go from here? Join a group of leading sales peers from across the industry for a conversation about the lessons learned since the popularization of digital books, best practices, digital book supply chain management, and more.
Link to video recording: https://bnctechforum.ca/sessions/selling-digital-books-in-2024-insights-from-industry-leaders/
Presented by BookNet Canada on May 28, 2024, with support from the Department of Canadian Heritage.
GDG Cloud Southlake #33: Boule & Rebala: Effective AppSec in SDLC using Deplo...James Anderson
Effective Application Security in Software Delivery lifecycle using Deployment Firewall and DBOM
The modern software delivery process (or the CI/CD process) includes many tools, distributed teams, open-source code, and cloud platforms. Constant focus on speed to release software to market, along with the traditional slow and manual security checks has caused gaps in continuous security as an important piece in the software supply chain. Today organizations feel more susceptible to external and internal cyber threats due to the vast attack surface in their applications supply chain and the lack of end-to-end governance and risk management.
The software team must secure its software delivery process to avoid vulnerability and security breaches. This needs to be achieved with existing tool chains and without extensive rework of the delivery processes. This talk will present strategies and techniques for providing visibility into the true risk of the existing vulnerabilities, preventing the introduction of security issues in the software, resolving vulnerabilities in production environments quickly, and capturing the deployment bill of materials (DBOM).
Speakers:
Bob Boule
Robert Boule is a technology enthusiast with PASSION for technology and making things work along with a knack for helping others understand how things work. He comes with around 20 years of solution engineering experience in application security, software continuous delivery, and SaaS platforms. He is known for his dynamic presentations in CI/CD and application security integrated in software delivery lifecycle.
Gopinath Rebala
Gopinath Rebala is the CTO of OpsMx, where he has overall responsibility for the machine learning and data processing architectures for Secure Software Delivery. Gopi also has a strong connection with our customers, leading design and architecture for strategic implementations. Gopi is a frequent speaker and well-known leader in continuous delivery and integrating security into software delivery.
"Impact of front-end architecture on development cost", Viktor TurskyiFwdays
I have heard many times that architecture is not important for the front-end. Also, many times I have seen how developers implement features on the front-end just following the standard rules for a framework and think that this is enough to successfully launch the project, and then the project fails. How to prevent this and what approach to choose? I have launched dozens of complex projects and during the talk we will analyze which approaches have worked for me and which have not.
Accelerate your Kubernetes clusters with Varnish CachingThijs Feryn
A presentation about the usage and availability of Varnish on Kubernetes. This talk explores the capabilities of Varnish caching and shows how to use the Varnish Helm chart to deploy it to Kubernetes.
This presentation was delivered at K8SUG Singapore. See https://feryn.eu/presentations/accelerate-your-kubernetes-clusters-with-varnish-caching-k8sug-singapore-28-2024 for more details.
GraphRAG is All You need? LLM & Knowledge GraphGuy Korland
Guy Korland, CEO and Co-founder of FalkorDB, will review two articles on the integration of language models with knowledge graphs.
1. Unifying Large Language Models and Knowledge Graphs: A Roadmap.
https://arxiv.org/abs/2306.08302
2. Microsoft Research's GraphRAG paper and a review paper on various uses of knowledge graphs:
https://www.microsoft.com/en-us/research/blog/graphrag-unlocking-llm-discovery-on-narrative-private-data/
Search and Society: Reimagining Information Access for Radical FuturesBhaskar Mitra
The field of Information retrieval (IR) is currently undergoing a transformative shift, at least partly due to the emerging applications of generative AI to information access. In this talk, we will deliberate on the sociotechnical implications of generative AI for information access. We will argue that there is both a critical necessity and an exciting opportunity for the IR community to re-center our research agendas on societal needs while dismantling the artificial separation between the work on fairness, accountability, transparency, and ethics in IR and the rest of IR research. Instead of adopting a reactionary strategy of trying to mitigate potential social harms from emerging technologies, the community should aim to proactively set the research agenda for the kinds of systems we should build inspired by diverse explicitly stated sociotechnical imaginaries. The sociotechnical imaginaries that underpin the design and development of information access technologies needs to be explicitly articulated, and we need to develop theories of change in context of these diverse perspectives. Our guiding future imaginaries must be informed by other academic fields, such as democratic theory and critical theory, and should be co-developed with social science scholars, legal scholars, civil rights and social justice activists, and artists, among others.
Connector Corner: Automate dynamic content and events by pushing a buttonDianaGray10
Here is something new! In our next Connector Corner webinar, we will demonstrate how you can use a single workflow to:
Create a campaign using Mailchimp with merge tags/fields
Send an interactive Slack channel message (using buttons)
Have the message received by managers and peers along with a test email for review
But there’s more:
In a second workflow supporting the same use case, you’ll see:
Your campaign sent to target colleagues for approval
If the “Approve” button is clicked, a Jira/Zendesk ticket is created for the marketing design team
But—if the “Reject” button is pushed, colleagues will be alerted via Slack message
Join us to learn more about this new, human-in-the-loop capability, brought to you by Integration Service connectors.
And...
Speakers:
Akshay Agnihotri, Product Manager
Charlie Greenberg, Host
UiPath Test Automation using UiPath Test Suite series, part 4DianaGray10
Welcome to UiPath Test Automation using UiPath Test Suite series part 4. In this session, we will cover Test Manager overview along with SAP heatmap.
The UiPath Test Manager overview with SAP heatmap webinar offers a concise yet comprehensive exploration of the role of a Test Manager within SAP environments, coupled with the utilization of heatmaps for effective testing strategies.
Participants will gain insights into the responsibilities, challenges, and best practices associated with test management in SAP projects. Additionally, the webinar delves into the significance of heatmaps as a visual aid for identifying testing priorities, areas of risk, and resource allocation within SAP landscapes. Through this session, attendees can expect to enhance their understanding of test management principles while learning practical approaches to optimize testing processes in SAP environments using heatmap visualization techniques
What will you get from this session?
1. Insights into SAP testing best practices
2. Heatmap utilization for testing
3. Optimization of testing processes
4. Demo
Topics covered:
Execution from the test manager
Orchestrator execution result
Defect reporting
SAP heatmap example with demo
Speaker:
Deepak Rai, Automation Practice Lead, Boundaryless Group and UiPath MVP
4. DATA FLOW DIAGRAMS…
Abbreviated as DFD
Introduced by DE MARCO , GANE , and SARSON
Most important tool used by system analysts
Main merit of DFD is that it can provide an
overview of :-
• what data system would process
• what data transformations are done
• what data are stored and which stored data is used
• where the results flow
The graphical representation of the system makes
it a good communication tool between a user and an
analyst and also the analyst and a system designer
5. SYMBOLS USED IN DFDS :
Used to depict a
process
Shows the direction
of flow of data
Used to represent
external entities
Represents data store
6. DESCRIBING A SYSTEM WITH A DFD :
Let us consider an example of a mess
management system and describe it with the
help of a data flow diagram (DFD)………….
9. A GOOD DFD SHOULD
NOT HAVE……
Loops
Crossing lines
Data flow split into flows with
different names and meanings.
10. GOOD STYLE IN DRAWING DFD
ƒUse meaningful names for data flows, processes
and data stores.
ƒUse top down development starting from context
diagram and successively levelling DFD
ƒA process can only transfer input to output.It
cannot create new data
ƒData stores cannot create new data
11. RULES OF DATA FLOW
Data can flow from
external entity to process
process to external entity
process to store and back
process to process
Data cannot flow from
external entity to external entity
external entity to store
store to external entity
store to store
13. LEVELLING RULES
If a process numbered ‘p’ levelled into n
processes, then each new process is numbered
p1,p2,………pn respectively.
All data flows entering a process must also enter
its levelled DFD.
All data flows leaving a process must also leave
its levelled DFD.
No external entites may appear in lower level
DFD’S.