Downloaded 153 times
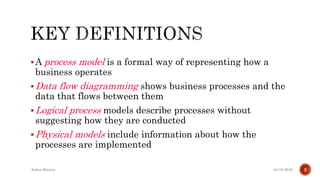
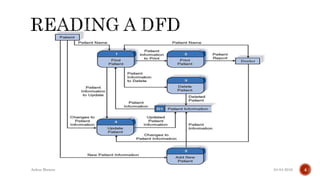
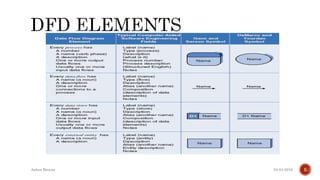
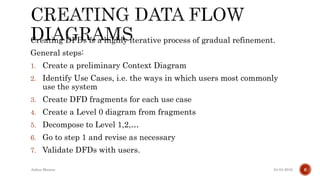
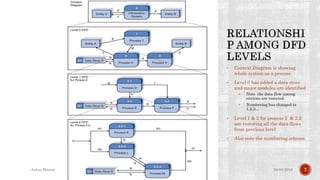
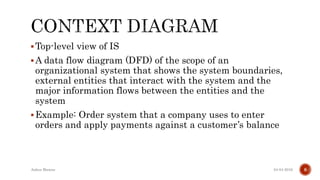
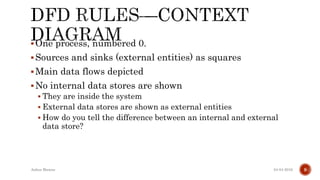
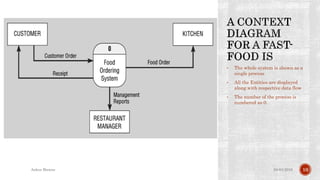
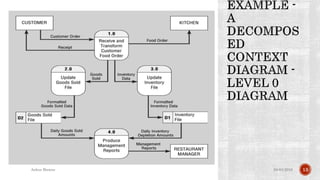
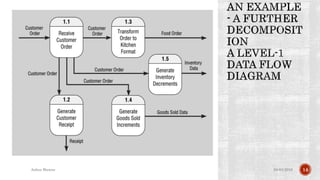
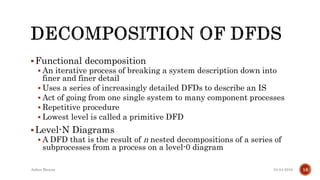
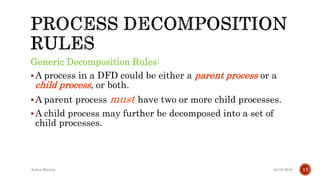
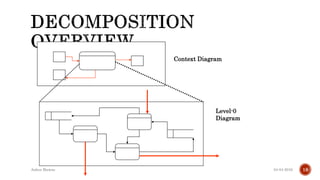
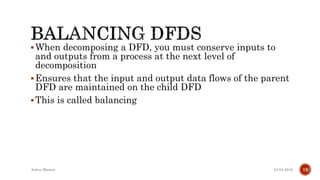

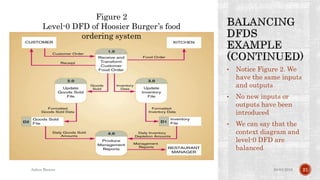
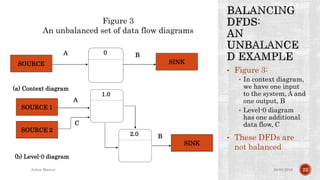
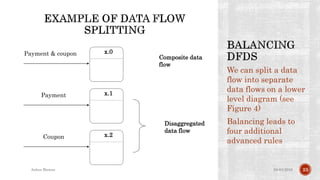
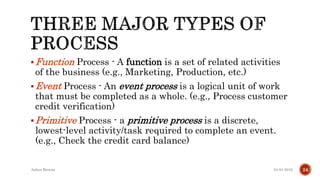
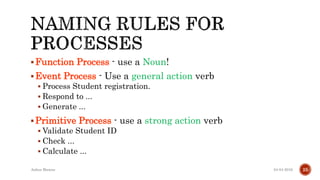
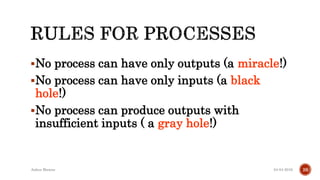
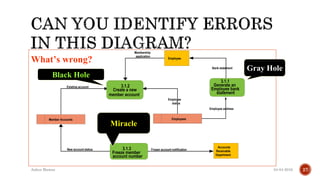
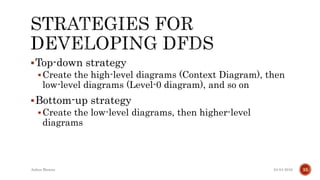
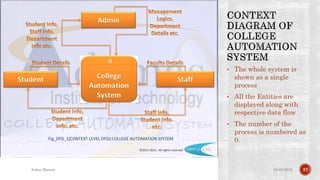
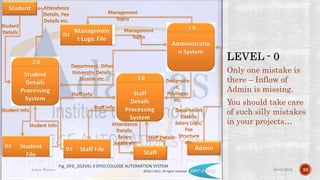
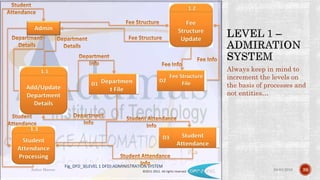


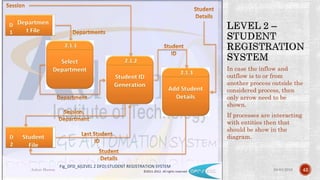


The document discusses process modeling using data flow diagrams (DFDs). It describes how DFDs can be used to represent business processes and data flows. Key points include: - A context diagram shows the entire system as one process and identifies external entities. - Logical process models describe processes without suggesting how they are implemented, while physical models include implementation details. - DFDs are refined through iterative decomposition, starting with a level 0 diagram and breaking processes down into more detailed level 1, 2, etc diagrams. - Effective DFDs balance inputs and outputs as processes are decomposed, and follow conventions for labeling processes, data stores, data flows and entities.