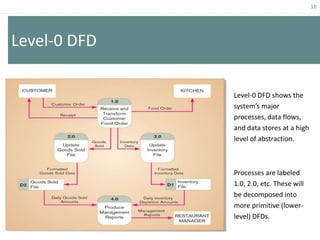
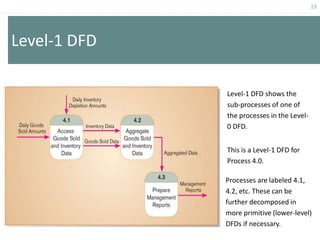
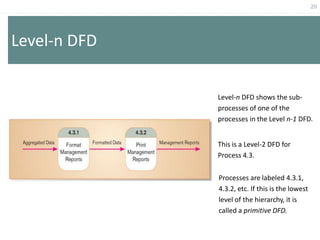
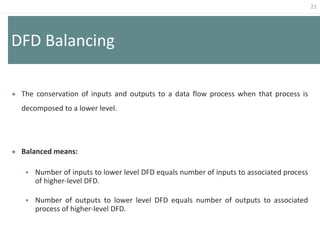
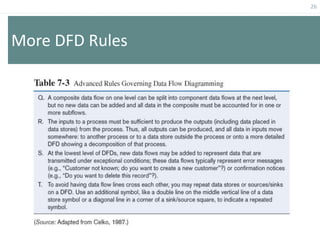
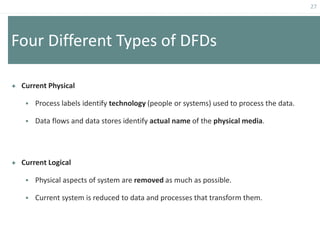
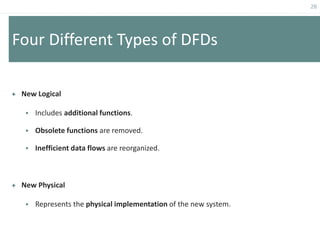
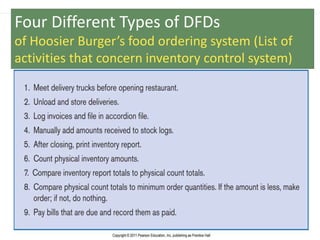
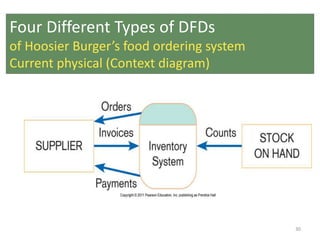
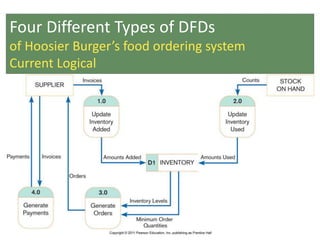
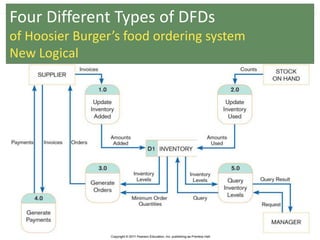
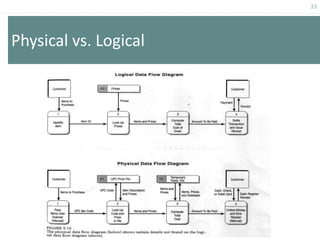
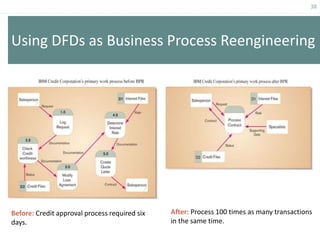
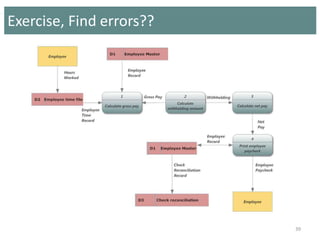
SlideShare a Scribd company logo
1
Data Flow Diagram
Structuring System Process Requirements
Chapter 7 in Modern System Analysis and Design Book.
2
Overview
 Process Modeling and Data Flow Diagrams (DFDs).
 Draw DFDs of well structured process models.
 Decompose DFDs into lower-level diagrams.
 Balance high-level and low-level DFDs.
 The differences between current physical, current logical, new physical, and
new logical DFDs.
 Using DFDs for analyzing information systems.
3
System Development Life Cycle “SDLC”
4
Process Modeling
 A technique for graphically representing the processes that are used to capture,
manipulate, store, and distribute data;
 between a system and its environment,
 among system components.
 Build a DFD using information gathered during requirements gathering and
determination.
 Both processes and data structures are modeled in DFDs.
5
Process Modeling
Deliverables and Outcomes
 Context data flow diagram (DFD).
 Shows the scope of a system (i.e., a top-level view).
 Often DFDs are created showing the current physical and logical system.
 It enables analysts to understand how the current system operates.
 DFDs of new logical system.
 The DFD is independent of technology.
 It shows data flows, structure, and functional requirements of the new system.
 Includes a thorough description of each DFD component.
6
Data Flow Diagram (DFD)
 A picture of the movement of data between external entities and the processes and
data stores within a system.
 How does a DFD differ from a systems flowchart?
 DFDs depict logical data flow independent of technology.
 The focus is on data flows, not process flows alone.
7
Comparison between DFD Symbols Sets
8
DFD Symbols
 Process: work or actions performed on data (inside the system).
 Data Store: data at rest (inside the system).
 Source/Sink: external entity that is origin or destination of data (outside the system).
 Data flow: arrows depicting movement of data.
9
DFD Diagramming Rules
Process
No process can have only outputs or only inputs.
Processes must have both outputs and inputs.
Process labels should be verb phrases.
10
DFD Diagramming Rules
Data Store
Data Store labels should be noun phrases.
All flows to or from a data store must
move through a process.
11
DFD Diagramming Rules
Source/Sink
Source and Sink labels should be noun phrases.
No data moves directly between external entities without
going through a process.
Interactions between external entities without intervening
processes are outside the system and therefore not
represented in the DFD.
12
Bidirectional flow
between process
and data store is
represented by two
separate arrows.
Forked data flow
must refer to exact
same data item (not
different data items)
from a common
location to multiple
destinations.
DFD Diagramming Rules
Data Flow
13
Joined data flow
must refer to exact
same data item (not
different data items)
from multiple
sources to a
common location.
Data flow cannot
go directly from a
process to itself,
must go through
intervening
processes.
DFD Diagramming Rules
Data Flow
14
DFD Diagramming Rules
Data Flow
 Data flow from a process to a data store means update (insert, delete or change).
 Data flow from a data store to a process means retrieve or use.
 Data flow labels should be noun phrases.
15
Functional Decomposition
 An iterative process of breaking a system description down into finer and finer detail.
 High-level processes described in terms of lower-level sub-processes.
 DFD charts created for each level of detail.
16
DFD Levels
 Context DFD
 Overview of the organizational system.
 Level-0 DFD
 Representation of system’s major processes at high level of abstraction.
 Level-1 DFD
 Results from decomposition of Level 0 diagram.
 Level-n DFD
 Results from decomposition of Level n-1 diagram.
17
Context Diagram
of Hoosier Burger’s food ordering system
Context diagram shows the
system boundaries, external
entities that interact with
the system, and major
information flows between
entities and the system.
NOTE: only one process symbol, and no data stores shown.
18
Level-0 DFD
Level-0 DFD shows the
system’s major
processes, data flows,
and data stores at a high
level of abstraction.
Processes are labeled
1.0, 2.0, etc. These will
be decomposed into
more primitive (lower-
level) DFDs.
19
Level-1 DFD
Level-1 DFD shows the
sub-processes of one of
the processes in the Level-
0 DFD.
This is a Level-1 DFD for
Process 4.0.
Processes are labeled 4.1,
4.2, etc. These can be
further decomposed in
more primitive (lower-level)
DFDs if necessary.
20
Level-n DFD
Level-n DFD shows the sub-
processes of one of the
processes in the Level n-1 DFD.
This is a Level-2 DFD for
Process 4.3.
Processes are labeled 4.3.1,
4.3.2, etc. If this is the lowest
level of the hierarchy, it is
called a primitive DFD.
21
DFD Balancing
 The conservation of inputs and outputs to a data flow process when that process is
decomposed to a lower level.
 Balanced means:
 Number of inputs to lower level DFD equals number of inputs to associated process
of higher-level DFD.
 Number of outputs to lower level DFD equals number of outputs to associated
process of higher-level DFD.
22
Unbalanced DFD
This is unbalanced because
the process of the context
diagram has only one input
but the Level-0 diagram has
two inputs.
Context Diagram
Level-0 Diagram
23
Balanced DFD
These are balanced because the
numbers of inputs and outputs of
context diagram process equal the
number of inputs and outputs of
Level-0 diagram.
3 outputs
1 input
Context Diagram
Level-0 Diagram
24
Balanced DFD
These are balanced because the numbers of
inputs and outputs to Process 1.0 of the
Level-0 diagram equals the number of
inputs and outputs to the Level-1 diagram.
1 input
4 outputs
Level-0 Diagram
Level-1 Diagram
25
Data Flow Splitting
A composite data flow at a
higher level may be split if
different parts go to
different processes in the
lower level DFD.
This remains balanced
because the same data is
involved, but split into two
parts.
Complex data flow
Disaggregated data flows
26
More DFD Rules
27
Four Different Types of DFDs
 Current Physical
 Process labels identify technology (people or systems) used to process the data.
 Data flows and data stores identify actual name of the physical media.
 Current Logical
 Physical aspects of system are removed as much as possible.
 Current system is reduced to data and processes that transform them.
28
Four Different Types of DFDs
 New Logical
 Includes additional functions.
 Obsolete functions are removed.
 Inefficient data flows are reorganized.
 New Physical
 Represents the physical implementation of the new system.
29
Four Different Types of DFDs
of Hoosier Burger’s food ordering system (List of
activities that concern inventory control system)
30
Four Different Types of DFDs
of Hoosier Burger’s food ordering system
Current physical (Context diagram)
31
Four Different Types of DFDs
of Hoosier Burger’s food ordering system
Current Logical
32
Four Different Types of DFDs
of Hoosier Burger’s food ordering system
New Logical
33
Physical vs. Logical
34
Guidelines for Drawing DFDs
 Completeness
 DFD must include all components necessary for system.
 Each component must be fully described in the project dictionary or CASE repository.
 Consistency
 The extent to which information contained on one level of a set of nested DFDs is also
included on other levels.
 Timing
 Time is not represented well on DFDs.
 Best to draw DFDs as if the system has never started and will never stop.
35
Guidelines for Drawing DFDs
 Iterative Development
 Analyst should expect to redraw diagram several times before reaching the closest
approximation to the system being modeled.
 Primitive DFDs
 Lowest logical level of decomposition.
 Decision has to be made when to stop decomposition.
36
Guidelines for Drawing DFDs
 Rules for stopping decomposition
 When each process has been reduced to a single decision, calculation or database
operation.
 When each data store represents data about a single entity.
 When the system user does not care to see any more detail.
 When every data flow does not need to be split further to show that data are handled in
various ways.
 When you believe that you have shown each business form or transaction, online display
and report as a single data flow.
 When you believe that there is a separate process for each choice on all lowest-level menu
options.
37
Using DFDs as Analysis Tools
 Gap Analysis
 The process of discovering discrepancies between two or more sets of data flow
diagrams or discrepancies within a single DFD.
 Inefficiencies in a system can often be identified through DFDs.
38
Using DFDs as Business Process Reengineering
Before: Credit approval process required six
days.
After: Process 100 times as many transactions
in the same time.
39
Exercise, Find errors??

More Related Content

What's hot

HSC Context and data flow diagrams ( DFD )
HSC Context and data flow diagrams ( DFD )HSC Context and data flow diagrams ( DFD )
HSC Context and data flow diagrams ( DFD )
greg robertson
 
Tableau - bar chart
Tableau - bar chartTableau - bar chart
Tableau - bar chart
Learnbay Datascience
 
Ch4 ejb
Ch4 ejbCh4 ejb
Requirement Analysis - Software Enigneering
Requirement Analysis - Software EnigneeringRequirement Analysis - Software Enigneering
Requirement Analysis - Software Enigneering
university of education,Lahore
 
Software Design and Modularity
Software Design and ModularitySoftware Design and Modularity
Software Design and Modularity
Danyal Ahmad
 
Software requirement specification
Software requirement specificationSoftware requirement specification
Software requirement specification
shiprashakya2
 
E-R DIAGRAMS, DFD'S AND STATE TRANSITION DIAGRAMS !!
E-R DIAGRAMS, DFD'S AND STATE TRANSITION DIAGRAMS !!E-R DIAGRAMS, DFD'S AND STATE TRANSITION DIAGRAMS !!
E-R DIAGRAMS, DFD'S AND STATE TRANSITION DIAGRAMS !!
Nidhi Kakani
 
Data and functional modeling
Data and functional modelingData and functional modeling
Data and functional modeling
Slideshare
 
DESIGN AND ANALYSIS OF A 32-BIT PIPELINED MIPS RISC PROCESSOR
DESIGN AND ANALYSIS OF A 32-BIT PIPELINED MIPS RISC PROCESSORDESIGN AND ANALYSIS OF A 32-BIT PIPELINED MIPS RISC PROCESSOR
DESIGN AND ANALYSIS OF A 32-BIT PIPELINED MIPS RISC PROCESSOR
VLSICS Design
 
Data flow diagram
Data flow diagramData flow diagram
Data flow diagram
Fizza Khan
 
Introduction to Software Engineering
Introduction to Software EngineeringIntroduction to Software Engineering
Introduction to Software Engineering
AnwarrChaudary
 
ER MODEL
ER MODELER MODEL
ER MODEL
Rupali Rana
 
Nano particles and released erythrocytes
Nano particles and released erythrocytesNano particles and released erythrocytes
Nano particles and released erythrocytes
Malla Reddy College of Pharmacy
 
Software Engineering - chp3- design
Software Engineering - chp3- designSoftware Engineering - chp3- design
Software Engineering - chp3- design
Lilia Sfaxi
 
Database Concept - Normalization (1NF, 2NF, 3NF)
Database Concept - Normalization (1NF, 2NF, 3NF)Database Concept - Normalization (1NF, 2NF, 3NF)
Database Concept - Normalization (1NF, 2NF, 3NF)
Oum Saokosal
 
Unit 1 OOSE
Unit 1 OOSE Unit 1 OOSE
Unit 1 OOSE
ChhayaShelake
 
DFD ppt
DFD pptDFD ppt
DFD ppt
Neha Kaurav
 
Chapter – 4 Normalization and Relational Algebra.pdf
Chapter – 4 Normalization and Relational Algebra.pdfChapter – 4 Normalization and Relational Algebra.pdf
Chapter – 4 Normalization and Relational Algebra.pdf
TamiratDejene1
 
Using T-SQL
Using T-SQL Using T-SQL
Using T-SQL
Antonios Chatzipavlis
 

What's hot (19)

HSC Context and data flow diagrams ( DFD )
HSC Context and data flow diagrams ( DFD )HSC Context and data flow diagrams ( DFD )
HSC Context and data flow diagrams ( DFD )
 
Tableau - bar chart
Tableau - bar chartTableau - bar chart
Tableau - bar chart
 
Ch4 ejb
Ch4 ejbCh4 ejb
Ch4 ejb
 
Requirement Analysis - Software Enigneering
Requirement Analysis - Software EnigneeringRequirement Analysis - Software Enigneering
Requirement Analysis - Software Enigneering
 
Software Design and Modularity
Software Design and ModularitySoftware Design and Modularity
Software Design and Modularity
 
Software requirement specification
Software requirement specificationSoftware requirement specification
Software requirement specification
 
E-R DIAGRAMS, DFD'S AND STATE TRANSITION DIAGRAMS !!
E-R DIAGRAMS, DFD'S AND STATE TRANSITION DIAGRAMS !!E-R DIAGRAMS, DFD'S AND STATE TRANSITION DIAGRAMS !!
E-R DIAGRAMS, DFD'S AND STATE TRANSITION DIAGRAMS !!
 
Data and functional modeling
Data and functional modelingData and functional modeling
Data and functional modeling
 
DESIGN AND ANALYSIS OF A 32-BIT PIPELINED MIPS RISC PROCESSOR
DESIGN AND ANALYSIS OF A 32-BIT PIPELINED MIPS RISC PROCESSORDESIGN AND ANALYSIS OF A 32-BIT PIPELINED MIPS RISC PROCESSOR
DESIGN AND ANALYSIS OF A 32-BIT PIPELINED MIPS RISC PROCESSOR
 
Data flow diagram
Data flow diagramData flow diagram
Data flow diagram
 
Introduction to Software Engineering
Introduction to Software EngineeringIntroduction to Software Engineering
Introduction to Software Engineering
 
ER MODEL
ER MODELER MODEL
ER MODEL
 
Nano particles and released erythrocytes
Nano particles and released erythrocytesNano particles and released erythrocytes
Nano particles and released erythrocytes
 
Software Engineering - chp3- design
Software Engineering - chp3- designSoftware Engineering - chp3- design
Software Engineering - chp3- design
 
Database Concept - Normalization (1NF, 2NF, 3NF)
Database Concept - Normalization (1NF, 2NF, 3NF)Database Concept - Normalization (1NF, 2NF, 3NF)
Database Concept - Normalization (1NF, 2NF, 3NF)
 
Unit 1 OOSE
Unit 1 OOSE Unit 1 OOSE
Unit 1 OOSE
 
DFD ppt
DFD pptDFD ppt
DFD ppt
 
Chapter – 4 Normalization and Relational Algebra.pdf
Chapter – 4 Normalization and Relational Algebra.pdfChapter – 4 Normalization and Relational Algebra.pdf
Chapter – 4 Normalization and Relational Algebra.pdf
 
Using T-SQL
Using T-SQL Using T-SQL
Using T-SQL
 

Similar to DFD_Context-_zero-level.ppt

Chapter 7software engneeringand system development life cycle.ppt
Chapter 7software engneeringand system development life cycle.pptChapter 7software engneeringand system development life cycle.ppt
Chapter 7software engneeringand system development life cycle.ppt
DoaaRezk5
 
Data Flow Diagrams
Data Flow DiagramsData Flow Diagrams
Data Flow Diagrams
Reetesh Gupta
 
Design Flow Diagram for Information System
Design Flow Diagram for Information SystemDesign Flow Diagram for Information System
Design Flow Diagram for Information System
arifasyrafcp13
 
Data Flow Diagram.pptx
Data Flow Diagram.pptxData Flow Diagram.pptx
Data Flow Diagram.pptx
ubaidullah75790
 
Dfd over flowcharts
Dfd over flowcharts Dfd over flowcharts
Dfd over flowcharts
Ashwathy Nair
 
Data flow oriented modeling
Data flow oriented modelingData flow oriented modeling
Data flow oriented modeling
KavithaGowri
 
Dfd mechanics
Dfd mechanicsDfd mechanics
Dfd mechanics
rishisinghgaur
 
Creative Team.pdf
Creative Team.pdfCreative Team.pdf
Creative Team.pdf
sumitbppimt9523
 
Data Flow Diagram or DFD
Data Flow Diagram  or DFDData Flow Diagram  or DFD
Data Flow Diagram or DFD
Mubassira Mahmuda Supty
 
Refer to the following figure which contains drafts of a context and l.docx
Refer to the following figure which contains drafts of a context and l.docxRefer to the following figure which contains drafts of a context and l.docx
Refer to the following figure which contains drafts of a context and l.docx
lmarie40
 
Data Flow Models part6
Data Flow Models part6Data Flow Models part6
Data Flow Models part6
DrMohammed Qassim
 
DFD.pptx
DFD.pptxDFD.pptx
DFD.pptx
sumitbppimt9523
 
Data Flow Diagram
Data Flow DiagramData Flow Diagram
Data Flow Diagram
Shreya Chatterjee
 
DFD.pptx
DFD.pptxDFD.pptx
DFD.pptx
SHAHZAIBABBAS13
 
Data flow diagram
Data flow diagram Data flow diagram
Data flow diagram
Nidhi Sharma
 
Data flow diagram
Data flow diagramData flow diagram
Data flow diagram
Upendra Sengar
 
Dfd data flow diagram
Dfd   data flow diagramDfd   data flow diagram
Dfd data flow diagram
Puneet Arora
 
Chapter7
Chapter7Chapter7
Chapter7
Ahmed Magdy
 
Data Flow Diagram
Data Flow DiagramData Flow Diagram
Data Flow Diagram
Puneet Arora
 
Dfd final
Dfd finalDfd final
Dfd final
Mukund Trivedi
 

Similar to DFD_Context-_zero-level.ppt (20)

Chapter 7software engneeringand system development life cycle.ppt
Chapter 7software engneeringand system development life cycle.pptChapter 7software engneeringand system development life cycle.ppt
Chapter 7software engneeringand system development life cycle.ppt
 
Data Flow Diagrams
Data Flow DiagramsData Flow Diagrams
Data Flow Diagrams
 
Design Flow Diagram for Information System
Design Flow Diagram for Information SystemDesign Flow Diagram for Information System
Design Flow Diagram for Information System
 
Data Flow Diagram.pptx
Data Flow Diagram.pptxData Flow Diagram.pptx
Data Flow Diagram.pptx
 
Dfd over flowcharts
Dfd over flowcharts Dfd over flowcharts
Dfd over flowcharts
 
Data flow oriented modeling
Data flow oriented modelingData flow oriented modeling
Data flow oriented modeling
 
Dfd mechanics
Dfd mechanicsDfd mechanics
Dfd mechanics
 
Creative Team.pdf
Creative Team.pdfCreative Team.pdf
Creative Team.pdf
 
Data Flow Diagram or DFD
Data Flow Diagram  or DFDData Flow Diagram  or DFD
Data Flow Diagram or DFD
 
Refer to the following figure which contains drafts of a context and l.docx
Refer to the following figure which contains drafts of a context and l.docxRefer to the following figure which contains drafts of a context and l.docx
Refer to the following figure which contains drafts of a context and l.docx
 
Data Flow Models part6
Data Flow Models part6Data Flow Models part6
Data Flow Models part6
 
DFD.pptx
DFD.pptxDFD.pptx
DFD.pptx
 
Data Flow Diagram
Data Flow DiagramData Flow Diagram
Data Flow Diagram
 
DFD.pptx
DFD.pptxDFD.pptx
DFD.pptx
 
Data flow diagram
Data flow diagram Data flow diagram
Data flow diagram
 
Data flow diagram
Data flow diagramData flow diagram
Data flow diagram
 
Dfd data flow diagram
Dfd   data flow diagramDfd   data flow diagram
Dfd data flow diagram
 
Chapter7
Chapter7Chapter7
Chapter7
 
Data Flow Diagram
Data Flow DiagramData Flow Diagram
Data Flow Diagram
 
Dfd final
Dfd finalDfd final
Dfd final
 

More from FarHana74914

Use-Case-Diagram.ppt
Use-Case-Diagram.pptUse-Case-Diagram.ppt
Use-Case-Diagram.ppt
FarHana74914
 
Lecture-1-3.pptx
Lecture-1-3.pptxLecture-1-3.pptx
Lecture-1-3.pptx
FarHana74914
 
Lecture - 24-25.pptx
Lecture - 24-25.pptxLecture - 24-25.pptx
Lecture - 24-25.pptx
FarHana74914
 
Lecture - 20-23.pptx
Lecture - 20-23.pptxLecture - 20-23.pptx
Lecture - 20-23.pptx
FarHana74914
 
Lecture - 16-19.pptx
Lecture - 16-19.pptxLecture - 16-19.pptx
Lecture - 16-19.pptx
FarHana74914
 
Lecture - 11-15.pptx
Lecture - 11-15.pptxLecture - 11-15.pptx
Lecture - 11-15.pptx
FarHana74914
 
Lecture - 7-10.pptx
Lecture - 7-10.pptxLecture - 7-10.pptx
Lecture - 7-10.pptx
FarHana74914
 

More from FarHana74914 (7)

Use-Case-Diagram.ppt
Use-Case-Diagram.pptUse-Case-Diagram.ppt
Use-Case-Diagram.ppt
 
Lecture-1-3.pptx
Lecture-1-3.pptxLecture-1-3.pptx
Lecture-1-3.pptx
 
Lecture - 24-25.pptx
Lecture - 24-25.pptxLecture - 24-25.pptx
Lecture - 24-25.pptx
 
Lecture - 20-23.pptx
Lecture - 20-23.pptxLecture - 20-23.pptx
Lecture - 20-23.pptx
 
Lecture - 16-19.pptx
Lecture - 16-19.pptxLecture - 16-19.pptx
Lecture - 16-19.pptx
 
Lecture - 11-15.pptx
Lecture - 11-15.pptxLecture - 11-15.pptx
Lecture - 11-15.pptx
 
Lecture - 7-10.pptx
Lecture - 7-10.pptxLecture - 7-10.pptx
Lecture - 7-10.pptx
 

Recently uploaded

2. Operations Strategy in a Global Environment.ppt
2. Operations Strategy in a Global Environment.ppt2. Operations Strategy in a Global Environment.ppt
2. Operations Strategy in a Global Environment.ppt
PuktoonEngr
 
PPT on GRP pipes manufacturing and testing
PPT on GRP pipes manufacturing and testingPPT on GRP pipes manufacturing and testing
PPT on GRP pipes manufacturing and testing
anoopmanoharan2
 
ML Based Model for NIDS MSc Updated Presentation.v2.pptx
ML Based Model for NIDS MSc Updated Presentation.v2.pptxML Based Model for NIDS MSc Updated Presentation.v2.pptx
ML Based Model for NIDS MSc Updated Presentation.v2.pptx
JamalHussainArman
 
IEEE Aerospace and Electronic Systems Society as a Graduate Student Member
IEEE Aerospace and Electronic Systems Society as a Graduate Student MemberIEEE Aerospace and Electronic Systems Society as a Graduate Student Member
IEEE Aerospace and Electronic Systems Society as a Graduate Student Member
VICTOR MAESTRE RAMIREZ
 
ACEP Magazine edition 4th launched on 05.06.2024
ACEP Magazine edition 4th launched on 05.06.2024ACEP Magazine edition 4th launched on 05.06.2024
ACEP Magazine edition 4th launched on 05.06.2024
Rahul
 
ACRP 4-09 Risk Assessment Method to Support Modification of Airfield Separat...
ACRP 4-09 Risk Assessment Method to Support Modification of Airfield Separat...ACRP 4-09 Risk Assessment Method to Support Modification of Airfield Separat...
ACRP 4-09 Risk Assessment Method to Support Modification of Airfield Separat...
Mukeshwaran Balu
 
Literature Review Basics and Understanding Reference Management.pptx
Literature Review Basics and Understanding Reference Management.pptxLiterature Review Basics and Understanding Reference Management.pptx
Literature Review Basics and Understanding Reference Management.pptx
Dr Ramhari Poudyal
 
bank management system in java and mysql report1.pdf
bank management system in java and mysql report1.pdfbank management system in java and mysql report1.pdf
bank management system in java and mysql report1.pdf
Divyam548318
 
Harnessing WebAssembly for Real-time Stateless Streaming Pipelines
Harnessing WebAssembly for Real-time Stateless Streaming PipelinesHarnessing WebAssembly for Real-time Stateless Streaming Pipelines
Harnessing WebAssembly for Real-time Stateless Streaming Pipelines
Christina Lin
 
Exception Handling notes in java exception
Exception Handling notes in java exceptionException Handling notes in java exception
Exception Handling notes in java exception
Ratnakar Mikkili
 
Series of visio cisco devices Cisco_Icons.ppt
Series of visio cisco devices Cisco_Icons.pptSeries of visio cisco devices Cisco_Icons.ppt
Series of visio cisco devices Cisco_Icons.ppt
PauloRodrigues104553
 
New techniques for characterising damage in rock slopes.pdf
New techniques for characterising damage in rock slopes.pdfNew techniques for characterising damage in rock slopes.pdf
New techniques for characterising damage in rock slopes.pdf
wisnuprabawa3
 
RAT: Retrieval Augmented Thoughts Elicit Context-Aware Reasoning in Long-Hori...
RAT: Retrieval Augmented Thoughts Elicit Context-Aware Reasoning in Long-Hori...RAT: Retrieval Augmented Thoughts Elicit Context-Aware Reasoning in Long-Hori...
RAT: Retrieval Augmented Thoughts Elicit Context-Aware Reasoning in Long-Hori...
thanhdowork
 
Generative AI leverages algorithms to create various forms of content
Generative AI leverages algorithms to create various forms of contentGenerative AI leverages algorithms to create various forms of content
Generative AI leverages algorithms to create various forms of content
Hitesh Mohapatra
 
Embedded machine learning-based road conditions and driving behavior monitoring
Embedded machine learning-based road conditions and driving behavior monitoringEmbedded machine learning-based road conditions and driving behavior monitoring
Embedded machine learning-based road conditions and driving behavior monitoring
IJECEIAES
 
digital fundamental by Thomas L.floydl.pdf
digital fundamental by Thomas L.floydl.pdfdigital fundamental by Thomas L.floydl.pdf
digital fundamental by Thomas L.floydl.pdf
drwaing
 
14 Template Contractual Notice - EOT Application
14 Template Contractual Notice - EOT Application14 Template Contractual Notice - EOT Application
14 Template Contractual Notice - EOT Application
SyedAbiiAzazi1
 
[JPP-1] - (JEE 3.0) - Kinematics 1D - 14th May..pdf
[JPP-1] - (JEE 3.0) - Kinematics 1D - 14th May..pdf[JPP-1] - (JEE 3.0) - Kinematics 1D - 14th May..pdf
[JPP-1] - (JEE 3.0) - Kinematics 1D - 14th May..pdf
awadeshbabu
 
Question paper of renewable energy sources
Question paper of renewable energy sourcesQuestion paper of renewable energy sources
Question paper of renewable energy sources
mahammadsalmanmech
 
5214-1693458878915-Unit 6 2023 to 2024 academic year assignment (AutoRecovere...
5214-1693458878915-Unit 6 2023 to 2024 academic year assignment (AutoRecovere...5214-1693458878915-Unit 6 2023 to 2024 academic year assignment (AutoRecovere...
5214-1693458878915-Unit 6 2023 to 2024 academic year assignment (AutoRecovere...
ihlasbinance2003
 

Recently uploaded (20)

2. Operations Strategy in a Global Environment.ppt
2. Operations Strategy in a Global Environment.ppt2. Operations Strategy in a Global Environment.ppt
2. Operations Strategy in a Global Environment.ppt
 
PPT on GRP pipes manufacturing and testing
PPT on GRP pipes manufacturing and testingPPT on GRP pipes manufacturing and testing
PPT on GRP pipes manufacturing and testing
 
ML Based Model for NIDS MSc Updated Presentation.v2.pptx
ML Based Model for NIDS MSc Updated Presentation.v2.pptxML Based Model for NIDS MSc Updated Presentation.v2.pptx
ML Based Model for NIDS MSc Updated Presentation.v2.pptx
 
IEEE Aerospace and Electronic Systems Society as a Graduate Student Member
IEEE Aerospace and Electronic Systems Society as a Graduate Student MemberIEEE Aerospace and Electronic Systems Society as a Graduate Student Member
IEEE Aerospace and Electronic Systems Society as a Graduate Student Member
 
ACEP Magazine edition 4th launched on 05.06.2024
ACEP Magazine edition 4th launched on 05.06.2024ACEP Magazine edition 4th launched on 05.06.2024
ACEP Magazine edition 4th launched on 05.06.2024
 
ACRP 4-09 Risk Assessment Method to Support Modification of Airfield Separat...
ACRP 4-09 Risk Assessment Method to Support Modification of Airfield Separat...ACRP 4-09 Risk Assessment Method to Support Modification of Airfield Separat...
ACRP 4-09 Risk Assessment Method to Support Modification of Airfield Separat...
 
Literature Review Basics and Understanding Reference Management.pptx
Literature Review Basics and Understanding Reference Management.pptxLiterature Review Basics and Understanding Reference Management.pptx
Literature Review Basics and Understanding Reference Management.pptx
 
bank management system in java and mysql report1.pdf
bank management system in java and mysql report1.pdfbank management system in java and mysql report1.pdf
bank management system in java and mysql report1.pdf
 
Harnessing WebAssembly for Real-time Stateless Streaming Pipelines
Harnessing WebAssembly for Real-time Stateless Streaming PipelinesHarnessing WebAssembly for Real-time Stateless Streaming Pipelines
Harnessing WebAssembly for Real-time Stateless Streaming Pipelines
 
Exception Handling notes in java exception
Exception Handling notes in java exceptionException Handling notes in java exception
Exception Handling notes in java exception
 
Series of visio cisco devices Cisco_Icons.ppt
Series of visio cisco devices Cisco_Icons.pptSeries of visio cisco devices Cisco_Icons.ppt
Series of visio cisco devices Cisco_Icons.ppt
 
New techniques for characterising damage in rock slopes.pdf
New techniques for characterising damage in rock slopes.pdfNew techniques for characterising damage in rock slopes.pdf
New techniques for characterising damage in rock slopes.pdf
 
RAT: Retrieval Augmented Thoughts Elicit Context-Aware Reasoning in Long-Hori...
RAT: Retrieval Augmented Thoughts Elicit Context-Aware Reasoning in Long-Hori...RAT: Retrieval Augmented Thoughts Elicit Context-Aware Reasoning in Long-Hori...
RAT: Retrieval Augmented Thoughts Elicit Context-Aware Reasoning in Long-Hori...
 
Generative AI leverages algorithms to create various forms of content
Generative AI leverages algorithms to create various forms of contentGenerative AI leverages algorithms to create various forms of content
Generative AI leverages algorithms to create various forms of content
 
Embedded machine learning-based road conditions and driving behavior monitoring
Embedded machine learning-based road conditions and driving behavior monitoringEmbedded machine learning-based road conditions and driving behavior monitoring
Embedded machine learning-based road conditions and driving behavior monitoring
 
digital fundamental by Thomas L.floydl.pdf
digital fundamental by Thomas L.floydl.pdfdigital fundamental by Thomas L.floydl.pdf
digital fundamental by Thomas L.floydl.pdf
 
14 Template Contractual Notice - EOT Application
14 Template Contractual Notice - EOT Application14 Template Contractual Notice - EOT Application
14 Template Contractual Notice - EOT Application
 
[JPP-1] - (JEE 3.0) - Kinematics 1D - 14th May..pdf
[JPP-1] - (JEE 3.0) - Kinematics 1D - 14th May..pdf[JPP-1] - (JEE 3.0) - Kinematics 1D - 14th May..pdf
[JPP-1] - (JEE 3.0) - Kinematics 1D - 14th May..pdf
 
Question paper of renewable energy sources
Question paper of renewable energy sourcesQuestion paper of renewable energy sources
Question paper of renewable energy sources
 
5214-1693458878915-Unit 6 2023 to 2024 academic year assignment (AutoRecovere...
5214-1693458878915-Unit 6 2023 to 2024 academic year assignment (AutoRecovere...5214-1693458878915-Unit 6 2023 to 2024 academic year assignment (AutoRecovere...
5214-1693458878915-Unit 6 2023 to 2024 academic year assignment (AutoRecovere...
 

DFD_Context-_zero-level.ppt

  • 1. 1 Data Flow Diagram Structuring System Process Requirements Chapter 7 in Modern System Analysis and Design Book.
  • 2. 2 Overview  Process Modeling and Data Flow Diagrams (DFDs).  Draw DFDs of well structured process models.  Decompose DFDs into lower-level diagrams.  Balance high-level and low-level DFDs.  The differences between current physical, current logical, new physical, and new logical DFDs.  Using DFDs for analyzing information systems.
  • 3. 3 System Development Life Cycle “SDLC”
  • 4. 4 Process Modeling  A technique for graphically representing the processes that are used to capture, manipulate, store, and distribute data;  between a system and its environment,  among system components.  Build a DFD using information gathered during requirements gathering and determination.  Both processes and data structures are modeled in DFDs.
  • 5. 5 Process Modeling Deliverables and Outcomes  Context data flow diagram (DFD).  Shows the scope of a system (i.e., a top-level view).  Often DFDs are created showing the current physical and logical system.  It enables analysts to understand how the current system operates.  DFDs of new logical system.  The DFD is independent of technology.  It shows data flows, structure, and functional requirements of the new system.  Includes a thorough description of each DFD component.
  • 6. 6 Data Flow Diagram (DFD)  A picture of the movement of data between external entities and the processes and data stores within a system.  How does a DFD differ from a systems flowchart?  DFDs depict logical data flow independent of technology.  The focus is on data flows, not process flows alone.
  • 8. 8 DFD Symbols  Process: work or actions performed on data (inside the system).  Data Store: data at rest (inside the system).  Source/Sink: external entity that is origin or destination of data (outside the system).  Data flow: arrows depicting movement of data.
  • 9. 9 DFD Diagramming Rules Process No process can have only outputs or only inputs. Processes must have both outputs and inputs. Process labels should be verb phrases.
  • 10. 10 DFD Diagramming Rules Data Store Data Store labels should be noun phrases. All flows to or from a data store must move through a process.
  • 11. 11 DFD Diagramming Rules Source/Sink Source and Sink labels should be noun phrases. No data moves directly between external entities without going through a process. Interactions between external entities without intervening processes are outside the system and therefore not represented in the DFD.
  • 12. 12 Bidirectional flow between process and data store is represented by two separate arrows. Forked data flow must refer to exact same data item (not different data items) from a common location to multiple destinations. DFD Diagramming Rules Data Flow
  • 13. 13 Joined data flow must refer to exact same data item (not different data items) from multiple sources to a common location. Data flow cannot go directly from a process to itself, must go through intervening processes. DFD Diagramming Rules Data Flow
  • 14. 14 DFD Diagramming Rules Data Flow  Data flow from a process to a data store means update (insert, delete or change).  Data flow from a data store to a process means retrieve or use.  Data flow labels should be noun phrases.
  • 15. 15 Functional Decomposition  An iterative process of breaking a system description down into finer and finer detail.  High-level processes described in terms of lower-level sub-processes.  DFD charts created for each level of detail.
  • 16. 16 DFD Levels  Context DFD  Overview of the organizational system.  Level-0 DFD  Representation of system’s major processes at high level of abstraction.  Level-1 DFD  Results from decomposition of Level 0 diagram.  Level-n DFD  Results from decomposition of Level n-1 diagram.
  • 17. 17 Context Diagram of Hoosier Burger’s food ordering system Context diagram shows the system boundaries, external entities that interact with the system, and major information flows between entities and the system. NOTE: only one process symbol, and no data stores shown.
  • 18. 18 Level-0 DFD Level-0 DFD shows the system’s major processes, data flows, and data stores at a high level of abstraction. Processes are labeled 1.0, 2.0, etc. These will be decomposed into more primitive (lower- level) DFDs.
  • 19. 19 Level-1 DFD Level-1 DFD shows the sub-processes of one of the processes in the Level- 0 DFD. This is a Level-1 DFD for Process 4.0. Processes are labeled 4.1, 4.2, etc. These can be further decomposed in more primitive (lower-level) DFDs if necessary.
  • 20. 20 Level-n DFD Level-n DFD shows the sub- processes of one of the processes in the Level n-1 DFD. This is a Level-2 DFD for Process 4.3. Processes are labeled 4.3.1, 4.3.2, etc. If this is the lowest level of the hierarchy, it is called a primitive DFD.
  • 21. 21 DFD Balancing  The conservation of inputs and outputs to a data flow process when that process is decomposed to a lower level.  Balanced means:  Number of inputs to lower level DFD equals number of inputs to associated process of higher-level DFD.  Number of outputs to lower level DFD equals number of outputs to associated process of higher-level DFD.
  • 22. 22 Unbalanced DFD This is unbalanced because the process of the context diagram has only one input but the Level-0 diagram has two inputs. Context Diagram Level-0 Diagram
  • 23. 23 Balanced DFD These are balanced because the numbers of inputs and outputs of context diagram process equal the number of inputs and outputs of Level-0 diagram. 3 outputs 1 input Context Diagram Level-0 Diagram
  • 24. 24 Balanced DFD These are balanced because the numbers of inputs and outputs to Process 1.0 of the Level-0 diagram equals the number of inputs and outputs to the Level-1 diagram. 1 input 4 outputs Level-0 Diagram Level-1 Diagram
  • 25. 25 Data Flow Splitting A composite data flow at a higher level may be split if different parts go to different processes in the lower level DFD. This remains balanced because the same data is involved, but split into two parts. Complex data flow Disaggregated data flows
  • 27. 27 Four Different Types of DFDs  Current Physical  Process labels identify technology (people or systems) used to process the data.  Data flows and data stores identify actual name of the physical media.  Current Logical  Physical aspects of system are removed as much as possible.  Current system is reduced to data and processes that transform them.
  • 28. 28 Four Different Types of DFDs  New Logical  Includes additional functions.  Obsolete functions are removed.  Inefficient data flows are reorganized.  New Physical  Represents the physical implementation of the new system.
  • 29. 29 Four Different Types of DFDs of Hoosier Burger’s food ordering system (List of activities that concern inventory control system)
  • 30. 30 Four Different Types of DFDs of Hoosier Burger’s food ordering system Current physical (Context diagram)
  • 31. 31 Four Different Types of DFDs of Hoosier Burger’s food ordering system Current Logical
  • 32. 32 Four Different Types of DFDs of Hoosier Burger’s food ordering system New Logical
  • 34. 34 Guidelines for Drawing DFDs  Completeness  DFD must include all components necessary for system.  Each component must be fully described in the project dictionary or CASE repository.  Consistency  The extent to which information contained on one level of a set of nested DFDs is also included on other levels.  Timing  Time is not represented well on DFDs.  Best to draw DFDs as if the system has never started and will never stop.
  • 35. 35 Guidelines for Drawing DFDs  Iterative Development  Analyst should expect to redraw diagram several times before reaching the closest approximation to the system being modeled.  Primitive DFDs  Lowest logical level of decomposition.  Decision has to be made when to stop decomposition.
  • 36. 36 Guidelines for Drawing DFDs  Rules for stopping decomposition  When each process has been reduced to a single decision, calculation or database operation.  When each data store represents data about a single entity.  When the system user does not care to see any more detail.  When every data flow does not need to be split further to show that data are handled in various ways.  When you believe that you have shown each business form or transaction, online display and report as a single data flow.  When you believe that there is a separate process for each choice on all lowest-level menu options.
  • 37. 37 Using DFDs as Analysis Tools  Gap Analysis  The process of discovering discrepancies between two or more sets of data flow diagrams or discrepancies within a single DFD.  Inefficiencies in a system can often be identified through DFDs.
  • 38. 38 Using DFDs as Business Process Reengineering Before: Credit approval process required six days. After: Process 100 times as many transactions in the same time.

Editor's Notes

  1. - Process 1 has no output - Process 2 has no input - Data store D2 should not connect directly to an external entity - Data store D1 should not connect directly to another data store - Data flow “Employee record” should not be bidirectional