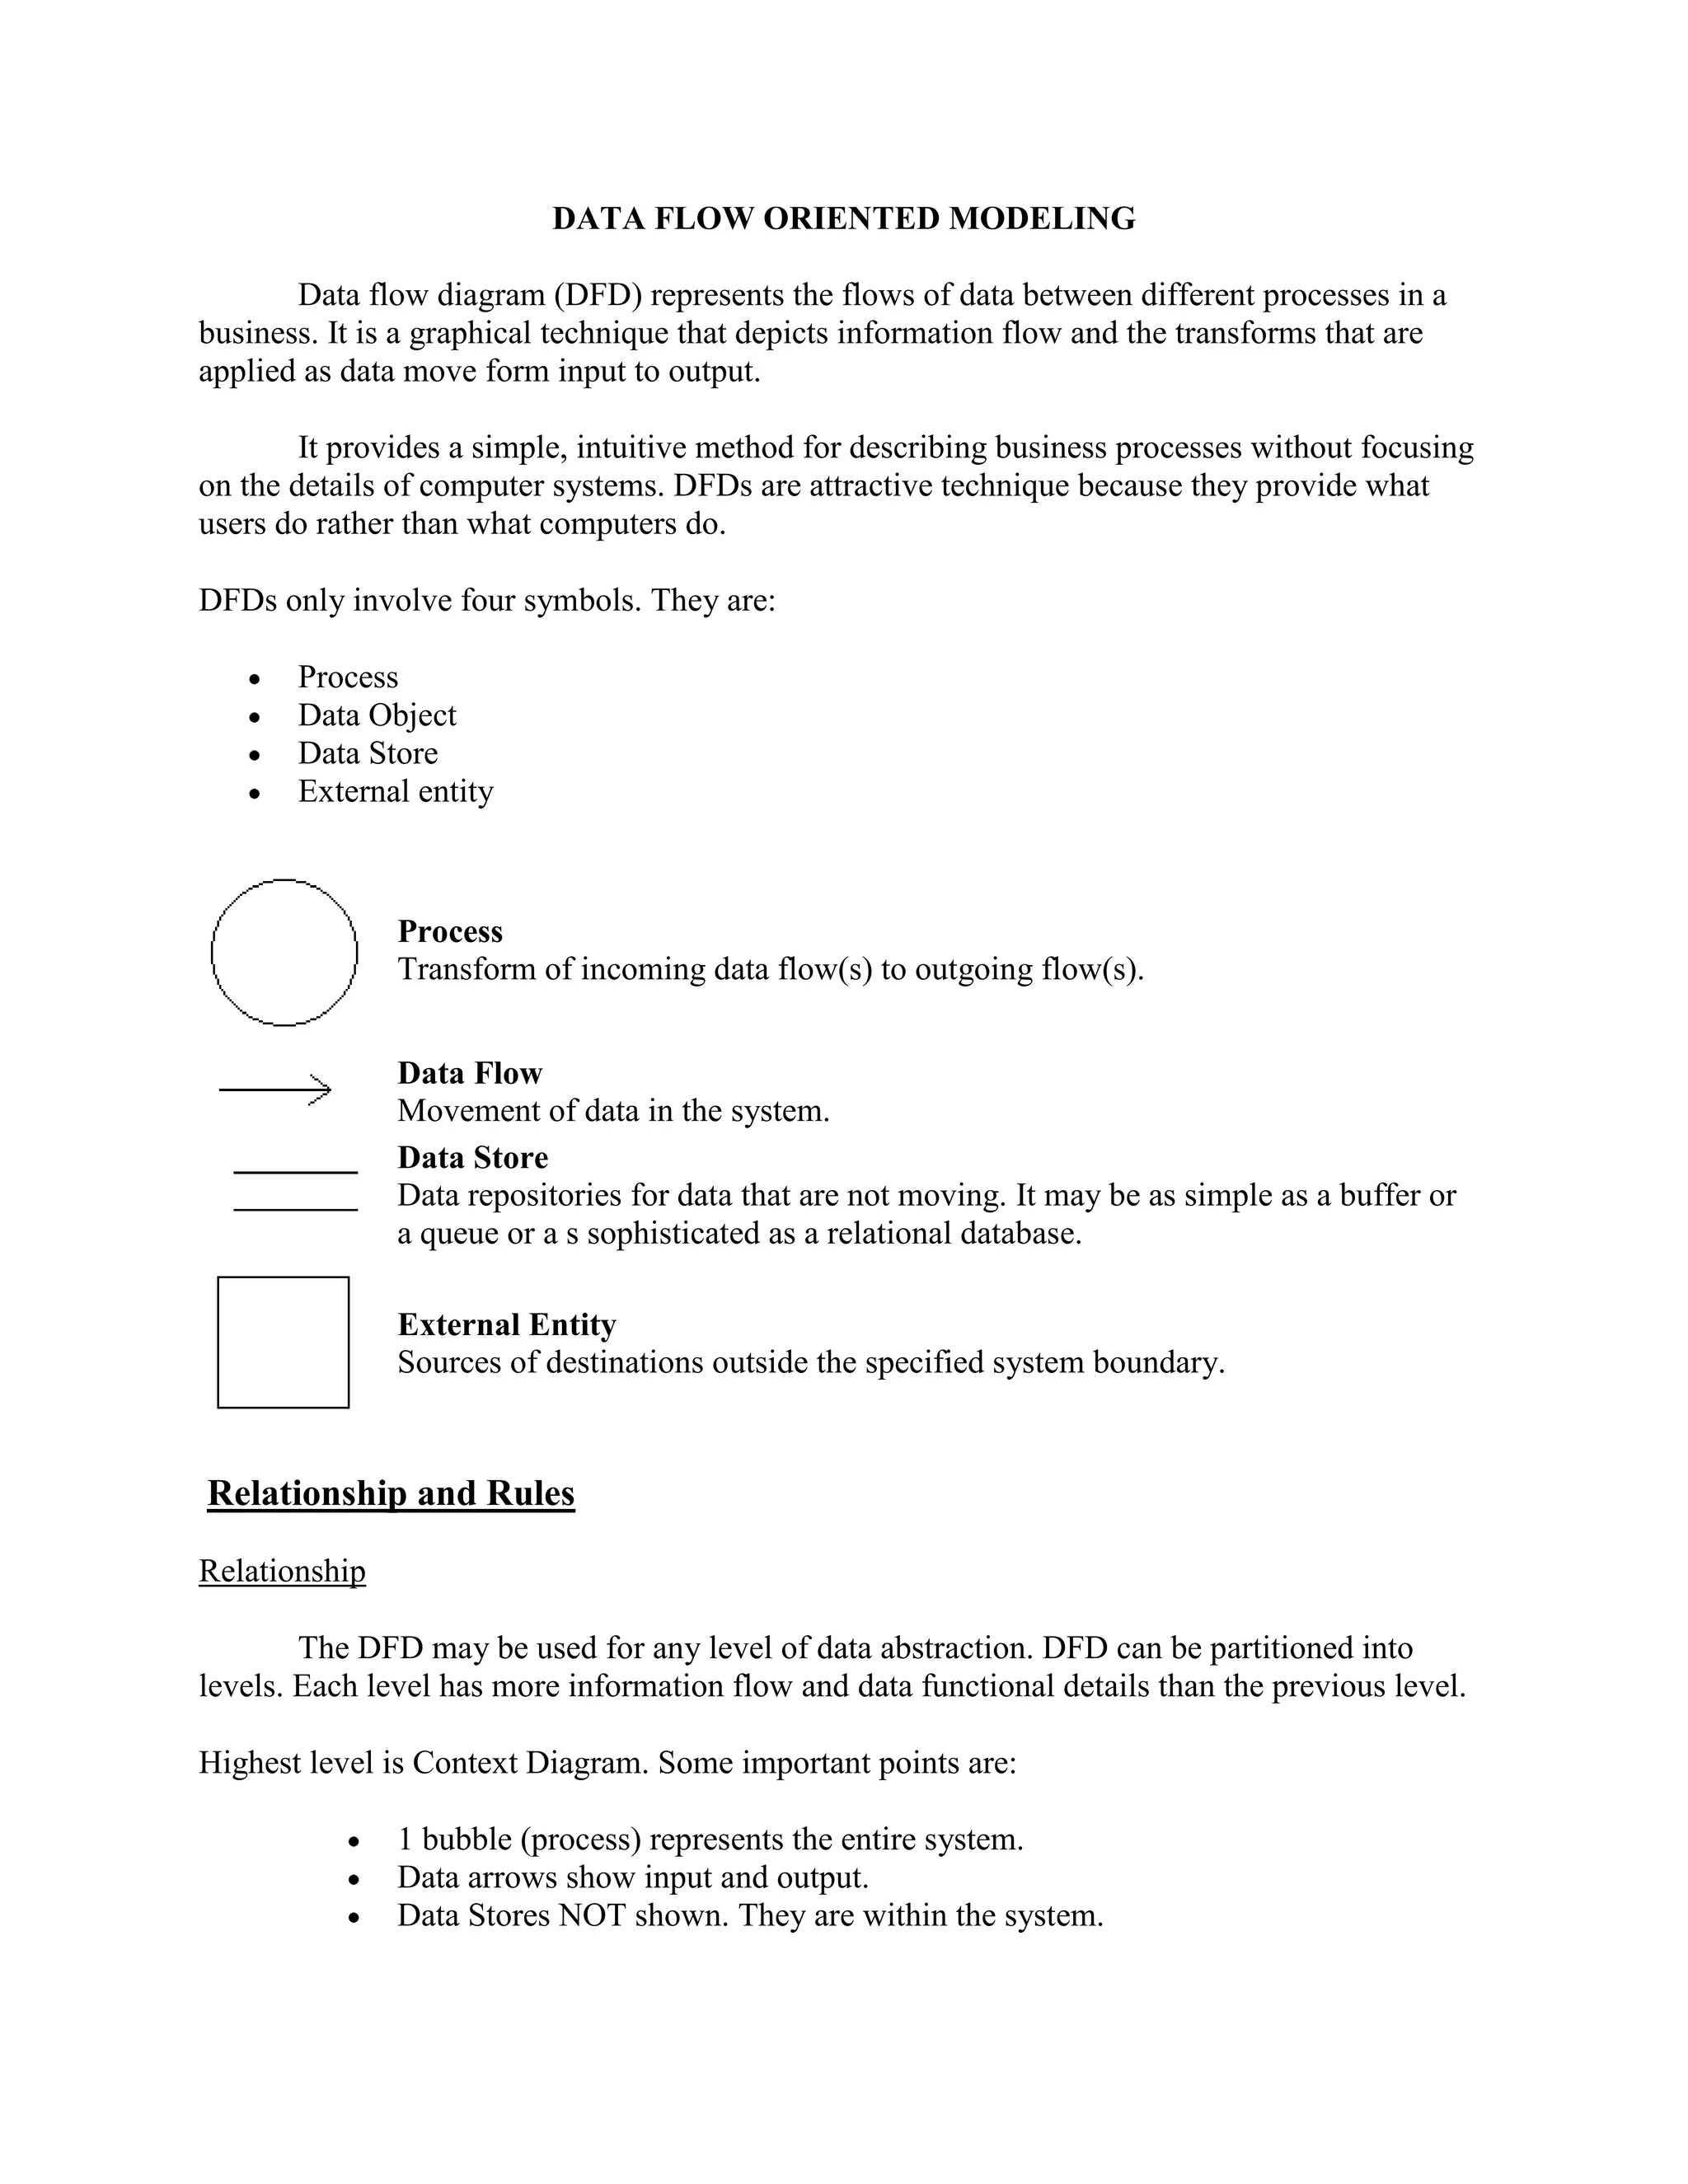
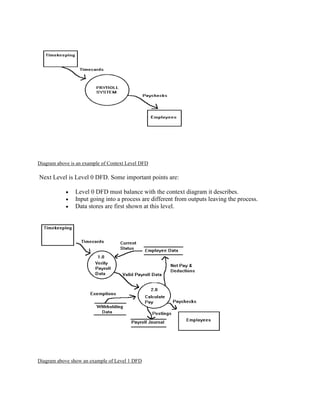
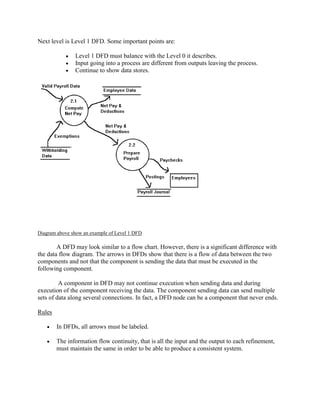
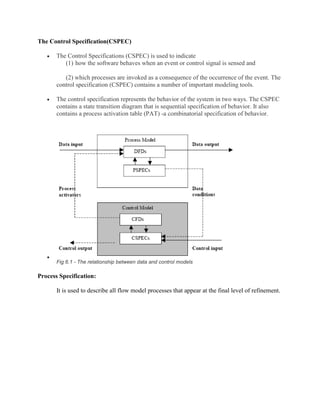
Transcript: #StandardsGoals for 2024: What’s new for BISAC - Tech Forum 2024
Â
Data flow oriented modeling
1. DATA FLOW ORIENTED MODELING
Data flow diagram (DFD) represents the flows of data between different processes in a
business. It is a graphical technique that depicts information flow and the transforms that are
applied as data move form input to output.
It provides a simple, intuitive method for describing business processes without focusing
on the details of computer systems. DFDs are attractive technique because they provide what
users do rather than what computers do.
DFDs only involve four symbols. They are:
Process
Data Object
Data Store
External entity
Process
Transform of incoming data flow(s) to outgoing flow(s).
Data Flow
Movement of data in the system.
Data Store
Data repositories for data that are not moving. It may be as simple as a buffer or
a queue or a s sophisticated as a relational database.
External Entity
Sources of destinations outside the specified system boundary.
Relationship and Rules
Relationship
The DFD may be used for any level of data abstraction. DFD can be partitioned into
levels. Each level has more information flow and data functional details than the previous level.
Highest level is Context Diagram. Some important points are:
1 bubble (process) represents the entire system.
Data arrows show input and output.
Data Stores NOT shown. They are within the system.
2. Diagram above is an example of Context Level DFD
Next Level is Level 0 DFD. Some important points are:
Level 0 DFD must balance with the context diagram it describes.
Input going into a process are different from outputs leaving the process.
Data stores are first shown at this level.
Diagram above show an example of Level 1 DFD
3. Next level is Level 1 DFD. Some important points are:
Level 1 DFD must balance with the Level 0 it describes.
Input going into a process are different from outputs leaving the process.
Continue to show data stores.
Diagram above show an example of Level 1 DFD
A DFD may look similar to a flow chart. However, there is a significant difference with
the data flow diagram. The arrows in DFDs show that there is a flow of data between the two
components and not that the component is sending the data that must be executed in the
following component.
A component in DFD may not continue execution when sending data and during
execution of the component receiving the data. The component sending data can send multiple
sets of data along several connections. In fact, a DFD node can be a component that never ends.
Rules
In DFDs, all arrows must be labeled.
The information flow continuity, that is all the input and the output to each refinement,
must maintain the same in order to be able to produce a consistent system.
4. The Control Specification(CSPEC)
The Control Specifications (CSPEC) is used to indicate
(1) how the software behaves when an event or control signal is sensed and
(2) which processes are invoked as a consequence of the occurrence of the event. The
control specification (CSPEC) contains a number of important modeling tools.
The control specification represents the behavior of the system in two ways. The CSPEC
contains a state transition diagram that is sequential specification of behavior. It also
contains a process activation table (PAT) -a combinatorial specification of behavior.
Fig 6.1 - The relationship between data and control models
Process Specification:
It is used to describe all flow model processes that appear at the final level of refinement.