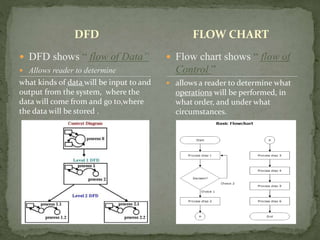
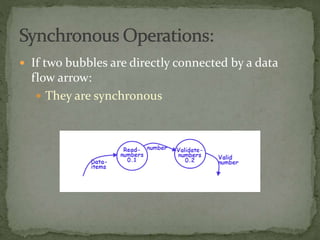
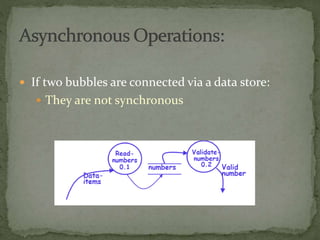
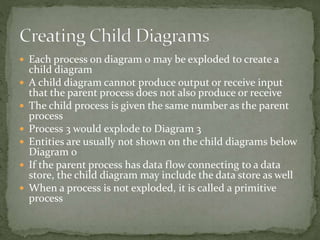
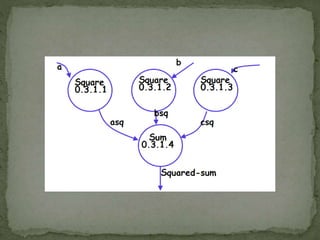
TOPIC: DATA FLOW DIAGRAM
PRESENTED BY:
Shreya Chattopadhyay
DEFINITION:
A data-flow diagram (DFD) is a graphical
representation of the "flow" of data through an
information system.
 to provide an indication of how data are transformed
as they move through the system.
 to depict the functions (and subfunctions) that
transform the data flow.
The DFD provides additional information that is used
during the analysis of the information domain and
serves as
DFD
 DFD shows “ flow of Data”
 Allows reader to determine
what kinds of data will be input to and
output from the system, where the
data will come from and go to,where
the data will be stored .
FLOW CHART
 Flow chart shows “ flow of
Control ”
 allows a reader to determine what
operations will be performed, in
what order, and under what
circumstances.
.
 The sharp cornered rectangles(or simply boxes) in a
DFD indicates entities.
 are called sources if they are external to the system
and provide data to the system, and sinks if they are
external to the system and receive information from
the system
Student
Doctor
Teacher
Manager
Cashier
UserCustomer
 The circles in a DFD indicate processes.
 The Process symbol represents an activity that
transforms or manipulates the data (combines,
reorders, converts,Prints etc.).
Accounting
System
Reservation
System
Patient
Administrati
on System
Marketing
System
Grading
System
 Two parallel lines in DFD indicate Data Store
 A Data Store is a repository of data.
 Data can be written into the data store. This is
depicted by an incoming arrow.
 Data can be read from a data store. This is
depicted by an outgoing arrow.
 Two data stores cannot be connected by a data
flow.
Order details Student’s grade
Flight Database
Employee’s Data Inventory
 Arrow symbol in DFD indicate data flow.
 The Data Flow symbol represents movement of
data.
 If two bubbles are directly connected by a data
flow arrow:
 They are synchronous
 If two bubbles are connected via a data store:
 They are not synchronous
Context Diagram :
 The highest level in a data flow diagram
 Contains only one process, representing the entire
system
 The process is given the number 0
 All external entities, as well as Major data flows are
shown
 Identify your main system
 Identify the external people who interact with the system
 Decide what data these entities will enter into the system
 Determine what these entities expect as output from the
system
 The basic module of the system are represented in this
phase and how data moves through different module
is shown.
 The level 1 DFD provides a high –level view of the
system that identifies the major processes and data
stores.
 Each process on diagram 0 may be exploded to create a
child diagram
 A child diagram cannot produce output or receive input
that the parent process does not also produce or receive
 The child process is given the same number as the parent
process
 Process 3 would explode to Diagram 3
 Entities are usually not shown on the child diagrams below
Diagram 0
 If the parent process has data flow connecting to a data
store, the child diagram may include the data store as well
 When a process is not exploded, it is called a primitive
process
 Accept input numbers from the
user:
Validate the numbers,
Calculate the root mean square
of the input numbers
Display the result.
registers retrieves
& stores
Password
Book
System
0
Customer
Level 1:
select process retrieves pass
stores Pass
Save_Pass
Login Form
Authentication
form
User’s account Process
Execution
Exit
Level 2:
Data Flow Diagram

Data Flow Diagram

  • 1.
    TOPIC: DATA FLOWDIAGRAM PRESENTED BY: Shreya Chattopadhyay
  • 2.
    DEFINITION: A data-flow diagram(DFD) is a graphical representation of the "flow" of data through an information system.
  • 3.
     to providean indication of how data are transformed as they move through the system.  to depict the functions (and subfunctions) that transform the data flow. The DFD provides additional information that is used during the analysis of the information domain and serves as
  • 4.
    DFD  DFD shows“ flow of Data”  Allows reader to determine what kinds of data will be input to and output from the system, where the data will come from and go to,where the data will be stored . FLOW CHART  Flow chart shows “ flow of Control ”  allows a reader to determine what operations will be performed, in what order, and under what circumstances.
  • 6.
    .  The sharpcornered rectangles(or simply boxes) in a DFD indicates entities.  are called sources if they are external to the system and provide data to the system, and sinks if they are external to the system and receive information from the system
  • 7.
  • 8.
     The circlesin a DFD indicate processes.  The Process symbol represents an activity that transforms or manipulates the data (combines, reorders, converts,Prints etc.).
  • 9.
  • 10.
     Two parallellines in DFD indicate Data Store  A Data Store is a repository of data.  Data can be written into the data store. This is depicted by an incoming arrow.  Data can be read from a data store. This is depicted by an outgoing arrow.  Two data stores cannot be connected by a data flow.
  • 11.
    Order details Student’sgrade Flight Database Employee’s Data Inventory
  • 12.
     Arrow symbolin DFD indicate data flow.  The Data Flow symbol represents movement of data.
  • 14.
     If twobubbles are directly connected by a data flow arrow:  They are synchronous
  • 15.
     If twobubbles are connected via a data store:  They are not synchronous
  • 16.
    Context Diagram : The highest level in a data flow diagram  Contains only one process, representing the entire system  The process is given the number 0  All external entities, as well as Major data flows are shown
  • 17.
     Identify yourmain system  Identify the external people who interact with the system  Decide what data these entities will enter into the system  Determine what these entities expect as output from the system
  • 18.
     The basicmodule of the system are represented in this phase and how data moves through different module is shown.  The level 1 DFD provides a high –level view of the system that identifies the major processes and data stores.
  • 19.
     Each processon diagram 0 may be exploded to create a child diagram  A child diagram cannot produce output or receive input that the parent process does not also produce or receive  The child process is given the same number as the parent process  Process 3 would explode to Diagram 3  Entities are usually not shown on the child diagrams below Diagram 0  If the parent process has data flow connecting to a data store, the child diagram may include the data store as well  When a process is not exploded, it is called a primitive process
  • 20.
     Accept inputnumbers from the user: Validate the numbers, Calculate the root mean square of the input numbers Display the result.
  • 24.
  • 25.
    Level 1: select processretrieves pass stores Pass Save_Pass Login Form Authentication form User’s account Process Execution Exit
  • 26.