This document provides an overview of data flow diagrams (DFDs), including their introduction, components, notation, levels, examples, and advantages/disadvantages. DFDs were introduced to graphically represent data flow in business systems. They model processes, external entities, data storage, and data flows. The document outlines rules for creating DFDs and defines the components and notation used to represent different elements. It also describes the different levels of DFDs from overall system view to process-level detail. Examples of clothing and food ordering systems are given. Advantages include understanding system functioning and limits, while disadvantages are potential for confusion and time required.
CONTENTS
Here are thetopics that we are gonna cover :
1. Introduction
2. Rules for creating DFD
3. Components of DFD
4. Notations
5. Levels of DFD
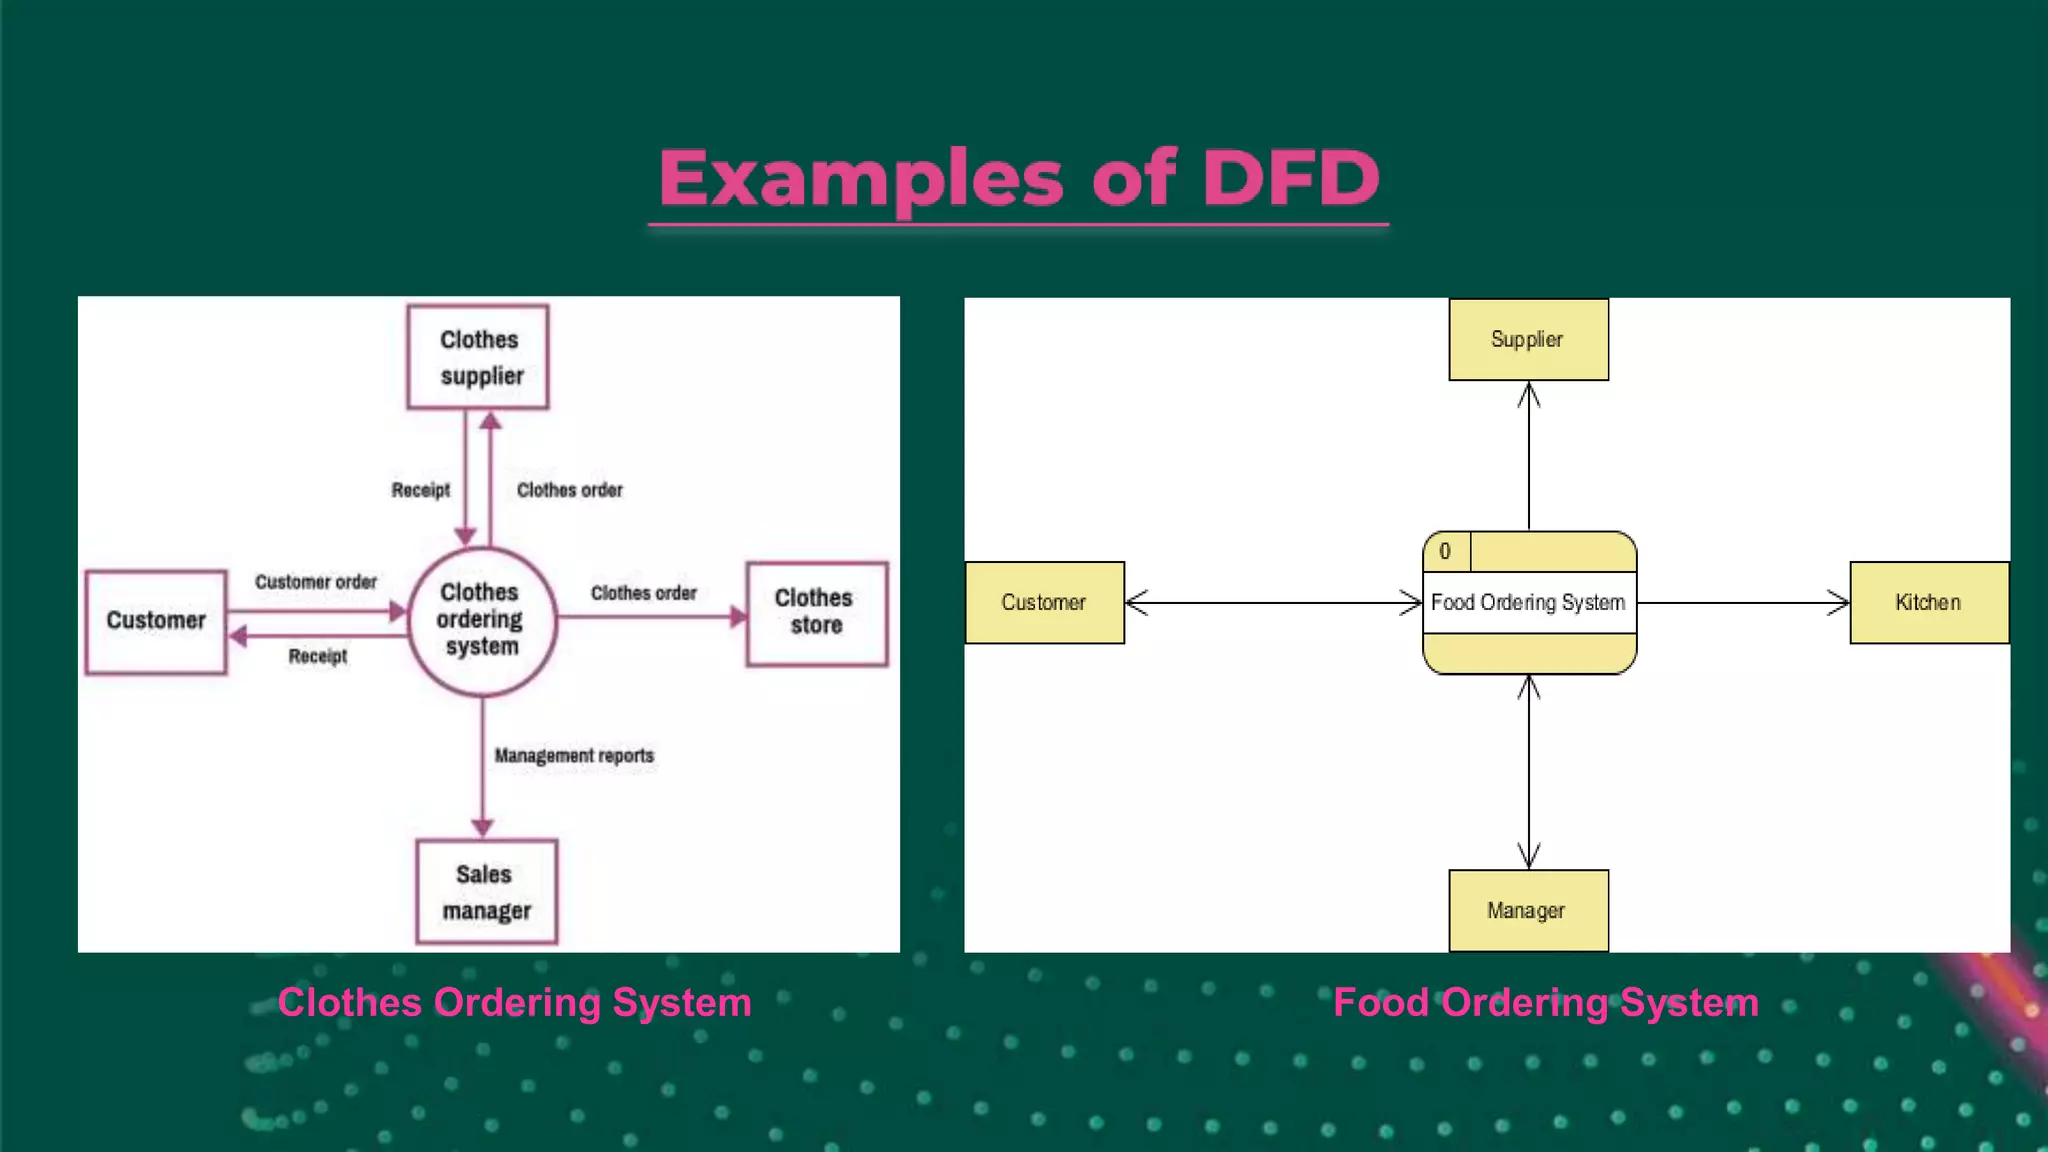
6. Examples of DFD
7. Advantages & Disadvantages
8. Conclusion
Data Flow Diagram(DFD) was introduced by Tom DeMarco, gane
and sarson.
Data flow diagrams are used to graphically represent the flow of
data in a business information system.
DFD is an important tool used by the system analyst. A data flow
diagram models a system by using external entities from which
data flows to a process which transforms the data to creates
output dataflows which go to other processes and external entities
or data stores. Stored data may also flow to processes as inputs.
The name ofthe entity should be easy and understandable without
any extra assistance(like comments).
The processes should be numbered or put in ordered list to be
referred easily.
The DFD should maintain consistency across all the DFD levels.
A single DFD can have a maximum of nine processes and a
minimum of three processes.
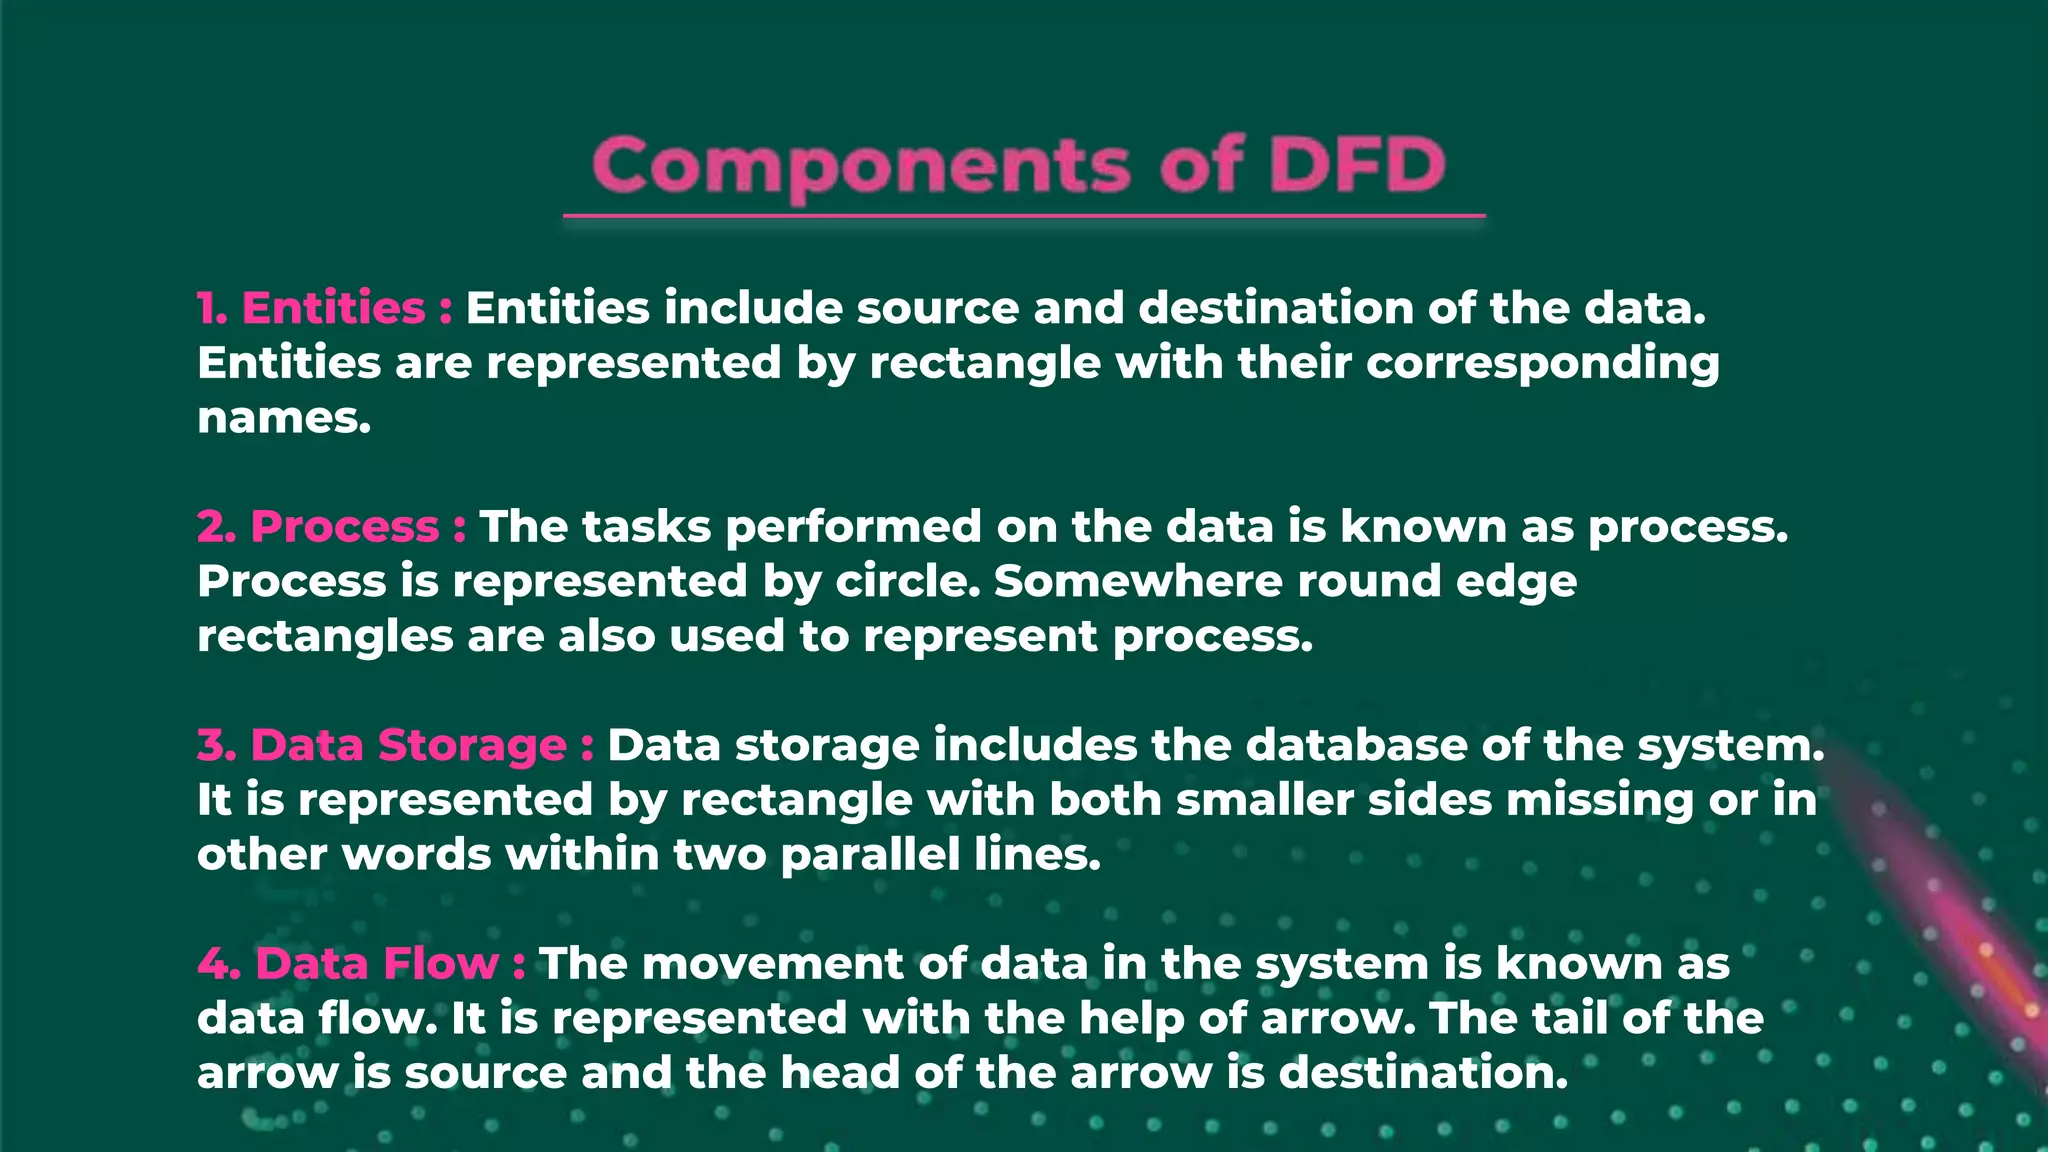
1. Entities :Entities include source and destination of the data.
Entities are represented by rectangle with their corresponding
names.
2. Process : The tasks performed on the data is known as process.
Process is represented by circle. Somewhere round edge
rectangles are also used to represent process.
3. Data Storage : Data storage includes the database of the system.
It is represented by rectangle with both smaller sides missing or in
other words within two parallel lines.
4. Data Flow : The movement of data in the system is known as
data flow. It is represented with the help of arrow. The tail of the
arrow is source and the head of the arrow is destination.
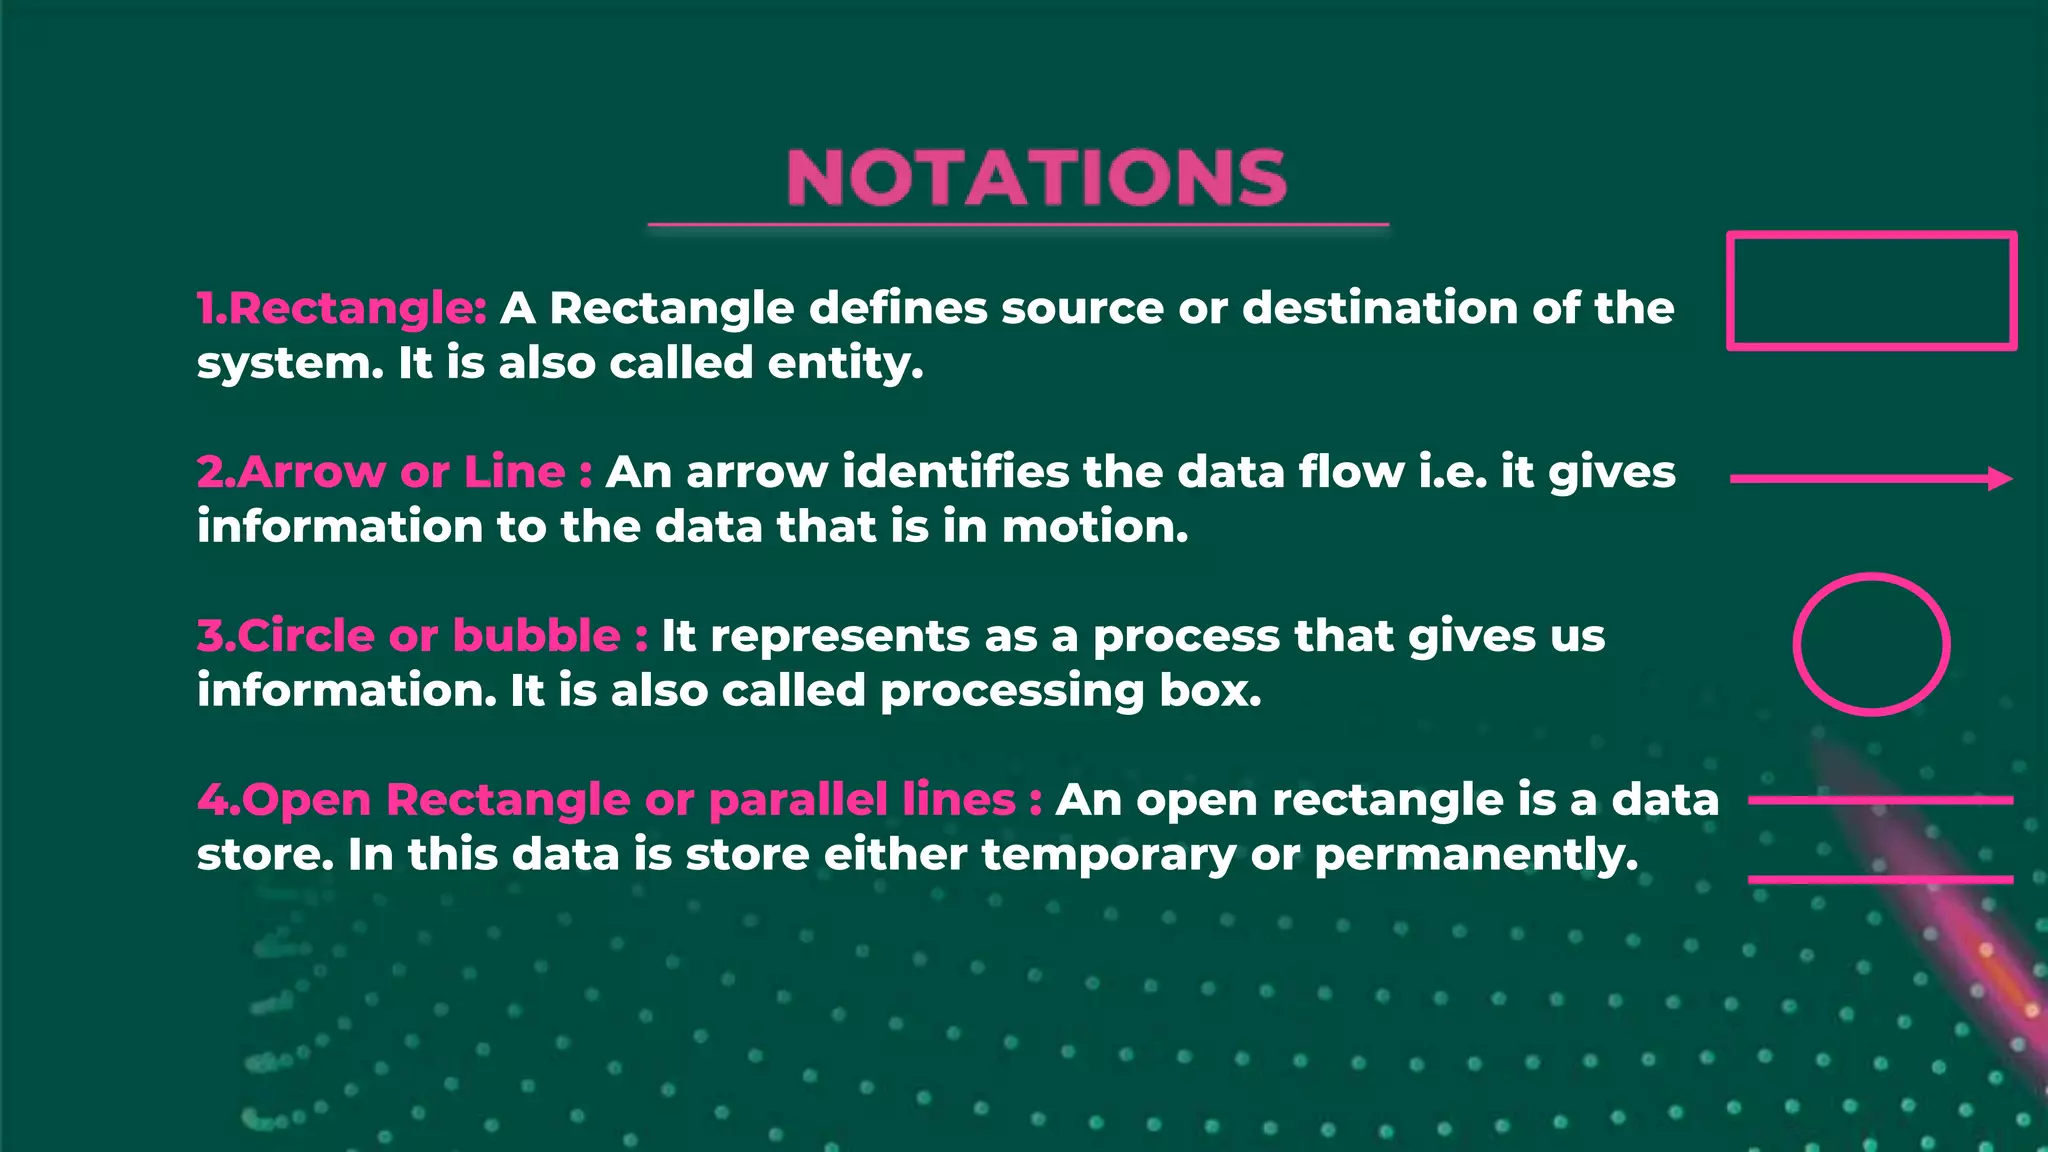
1.Rectangle: A Rectangledefines source or destination of the
system. It is also called entity.
2.Arrow or Line : An arrow identifies the data flow i.e. it gives
information to the data that is in motion.
3.Circle or bubble : It represents as a process that gives us
information. It is also called processing box.
4.Open Rectangle or parallel lines : An open rectangle is a data
store. In this data is store either temporary or permanently.
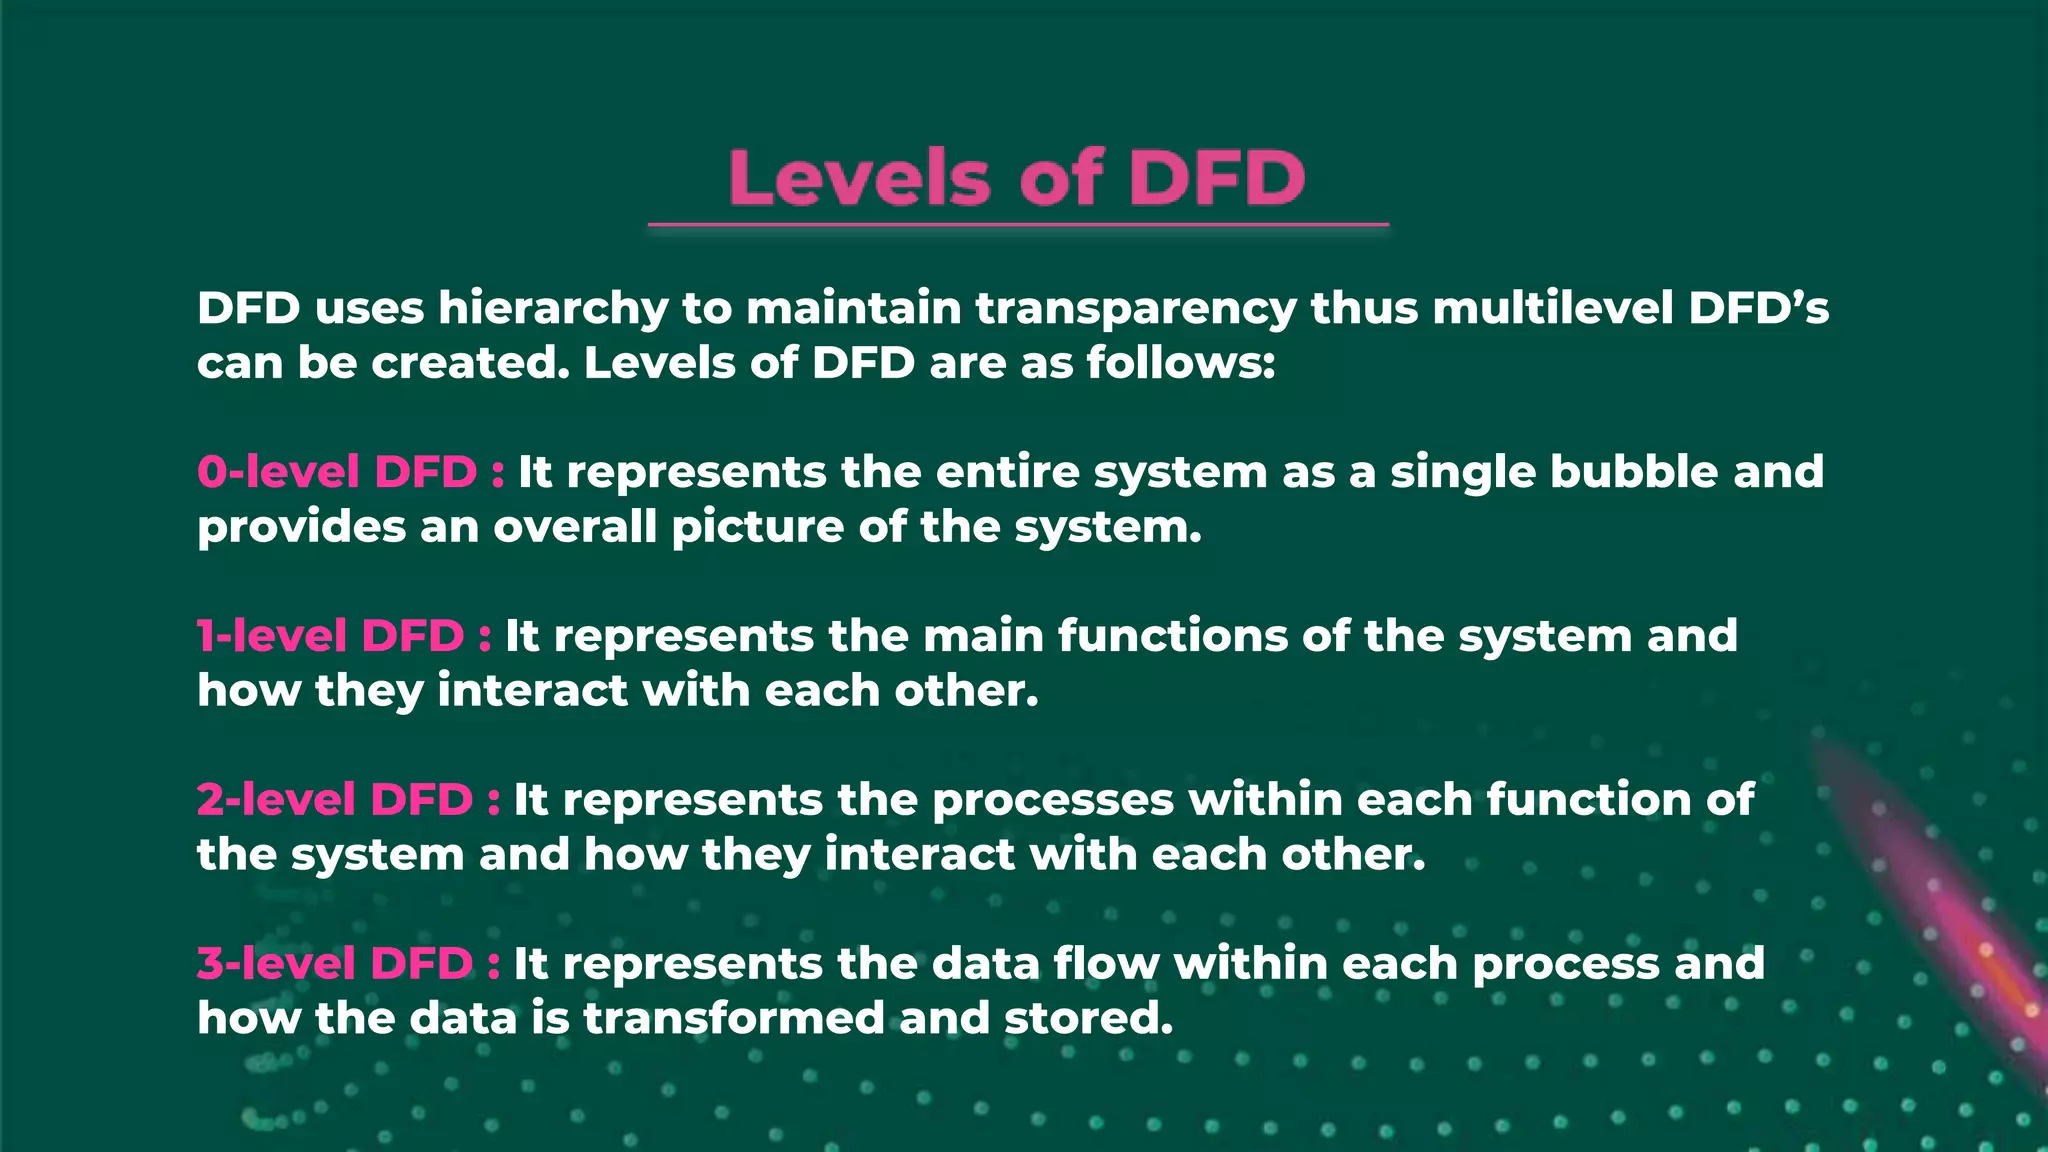
DFD uses hierarchyto maintain transparency thus multilevel DFD’s
can be created. Levels of DFD are as follows:
0-level DFD : It represents the entire system as a single bubble and
provides an overall picture of the system.
1-level DFD : It represents the main functions of the system and
how they interact with each other.
2-level DFD : It represents the processes within each function of
the system and how they interact with each other.
3-level DFD : It represents the data flow within each process and
how the data is transformed and stored.
It helps usto understand the functioning and the limits of a
system.
It is a graphical representation which is very easy to understand as
it helps visualize contents.
Data Flow Diagram represent detailed and well explained diagram
of system components.
It is used as the part of system documentation file.
Data Flow Diagrams can be understood by both technical or
nontechnical person because they are very easy to understand.
At times DFDcan confuse the programmers regarding the system.
Data Flow Diagram takes long time to be generated, and many
times due to this reasons analysts are denied permission to work
on it.
Efficiency and clarityof the process are among the essential
elements of any business operation. Data Flow Diagrams are highly
useful tools to maintain these aspects of the operation.
They provide critical insights into the systems and ways the
information passes through it. DFD helps structure every element
of the system, keep them logically intact and interconnected.


![CleanMyMac X v5.2.8 Crack for MacOS Full Version [Latest] pptx](https://cdn.slidesharecdn.com/ss_thumbnails/softwareoverview-251207194121-a81f0142-thumbnail.jpg?width=640&height=640&fit=bounds)
![Soundtoys Mac v5.5.5.0 Crack for MacOS Full Version [Latest] pptx](https://cdn.slidesharecdn.com/ss_thumbnails/softwareoverview-251207193711-91d8ae6b-thumbnail.jpg?width=640&height=640&fit=bounds)
![Wondershare Filmora 15.0.11 Crack for Mac Key Full Download [Latest] pptx](https://cdn.slidesharecdn.com/ss_thumbnails/software-251207184836-1d16ba16-thumbnail.jpg?width=640&height=640&fit=bounds)
![WinRAR Crack 7.13 Final Mac Keygen 2026 Download [Latest] Software.pptx](https://cdn.slidesharecdn.com/ss_thumbnails/software-251207185858-eb450678-thumbnail.jpg?width=640&height=640&fit=bounds)
![PowerISO 9.2 Mac Crack + Serial Key Free Download 2026 [Latest] Software.pptx](https://cdn.slidesharecdn.com/ss_thumbnails/software-251207185653-5d5700e6-thumbnail.jpg?width=640&height=640&fit=bounds)


![Chapter4_Initiation_of_Sediment_Motion_v2[1].pptx](https://cdn.slidesharecdn.com/ss_thumbnails/chapter4initiationofsedimentmotionv21-251208223747-f94ef163-thumbnail.jpg?width=640&height=640&fit=bounds)


