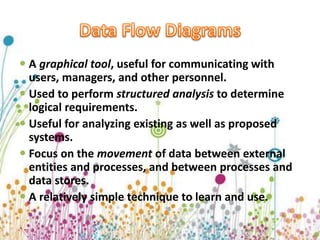
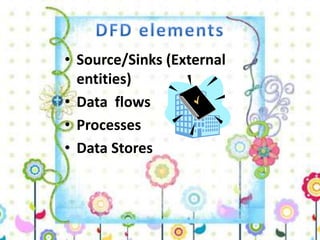
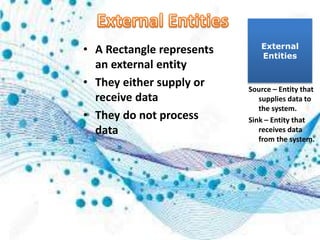
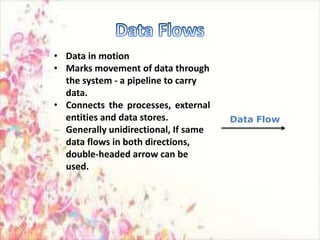
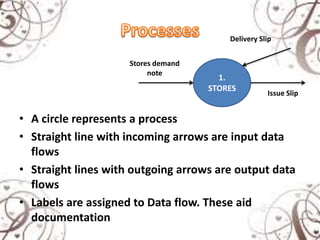
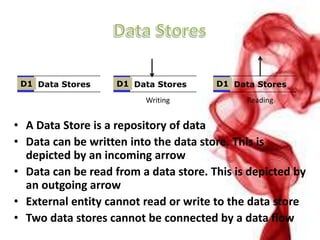
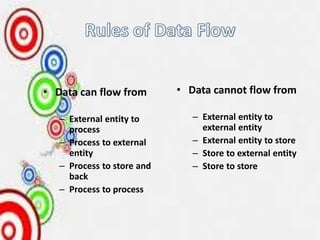
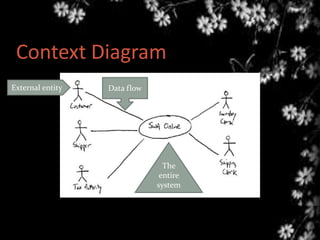
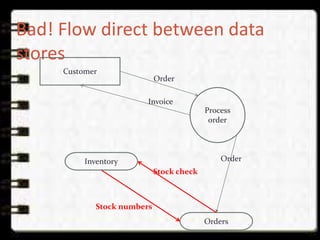
NEHA KAURAV
CLASS:
BCA 3rd SEM.
 A graphical tool, useful for communicating with
users, managers, and other personnel.
 Used to perform structured analysis to determine
logical requirements.
 Useful for analyzing existing as well as proposed
systems.
 Focus on the movement of data between external
entities and processes, and between processes and
data stores.
 A relatively simple technique to learn and use.
• Provides an overview of-
– What data a system processes
– What transformations are performed
– What data are stored
– What results are produced and where they flow
• Graphical nature makes it a good
communication tool between-
– User and analyst
– Analyst and System designer
• Source/Sinks (External
entities)
• Data flows
• Processes
• Data Stores
• A Rectangle represents
an external entity
• They either supply or
receive data
• They do not process
data
External
Entities
Source – Entity that
supplies data to
the system.
Sink – Entity that
receives data
from the system.
• Data in motion
• Marks movement of data through
the system - a pipeline to carry
data.
• Connects the processes, external
entities and data stores.
– Generally unidirectional, If same
data flows in both directions,
double-headed arrow can be
used.
Data Flow
• A circle represents a process
• Straight line with incoming arrows are input data
flows
• Straight lines with outgoing arrows are output data
flows
• Labels are assigned to Data flow. These aid
documentation
1.
STORES
Stores demand
note
Delivery Slip
Issue Slip
• A Data Store is a repository of data
• Data can be written into the data store. This is
depicted by an incoming arrow
• Data can be read from a data store. This is depicted by
an outgoing arrow
• External entity cannot read or write to the data store
• Two data stores cannot be connected by a data flow
Data StoresD1 Data StoresD1 Data StoresD1
Writing Reading
• Data can flow from
– External entity to
process
– Process to external
entity
– Process to store and
back
– Process to process
• Data cannot flow from
– External entity to
external entity
– External entity to store
– Store to external entity
– Store to store
• Use meaningful names for data flows, processes
and data stores.
• Use top down development starting from
context diagram and successively levelling DFD
• Only previously stored data can be read
• A process can only transfer input to output. It
cannot create new data
• Data stores cannot create new data
 Context diagram
 Level-0 diagram (System diagram)
 Level-n diagram
- Detail of one process from next
highest level
 Primitive diagram (Lowest level DFD)
 If a process p is expanded, the process at the next
level are labelled as p.1, p.2 etc.
 All data flow entering or leaving p must also enter
or leave it’s expanded version
 Expanded DFD may have data stores
 No external entity can appear in expanded DFD
 Keep the number of processes at each level less
than 7
 Draw one process
representing the entire
system (process 0)
 Find all inputs and outputs
that come from or go to
external entities; draw as
data flows.
 Draw in external entities as
the source or destination of
the data flows.
Context Diagram
External entity Data flow
The
entire
system
IT’S A BAD DFD
 Do not use direct data flows from one data store to
another. There must be a process between the store.s
 Do not use direct data flows from an external entity
to a data store flows. Again, a process is needed
between them.
 Do not show direct data flows between external
entities.
Bad! Flow between external
entities
Weather bureauFire brigade
Weather forecast
Call for help
Assess
fire risk
Weather forecast
Bad! Flow direct to data store
Weather bureauFire brigade
Weather forecast
Call for help
Assess
fire risk
Weather forecast
Forecast history
Bad! Flow direct between data
stores
Customer
Stock numbers
Process
order
Invoice
Orders
Inventory
Stock check
Order
Order
DFD ppt

DFD ppt

  • 2.
  • 3.
     A graphicaltool, useful for communicating with users, managers, and other personnel.  Used to perform structured analysis to determine logical requirements.  Useful for analyzing existing as well as proposed systems.  Focus on the movement of data between external entities and processes, and between processes and data stores.  A relatively simple technique to learn and use.
  • 4.
    • Provides anoverview of- – What data a system processes – What transformations are performed – What data are stored – What results are produced and where they flow • Graphical nature makes it a good communication tool between- – User and analyst – Analyst and System designer
  • 5.
    • Source/Sinks (External entities) •Data flows • Processes • Data Stores
  • 6.
    • A Rectanglerepresents an external entity • They either supply or receive data • They do not process data External Entities Source – Entity that supplies data to the system. Sink – Entity that receives data from the system.
  • 7.
    • Data inmotion • Marks movement of data through the system - a pipeline to carry data. • Connects the processes, external entities and data stores. – Generally unidirectional, If same data flows in both directions, double-headed arrow can be used. Data Flow
  • 8.
    • A circlerepresents a process • Straight line with incoming arrows are input data flows • Straight lines with outgoing arrows are output data flows • Labels are assigned to Data flow. These aid documentation 1. STORES Stores demand note Delivery Slip Issue Slip
  • 9.
    • A DataStore is a repository of data • Data can be written into the data store. This is depicted by an incoming arrow • Data can be read from a data store. This is depicted by an outgoing arrow • External entity cannot read or write to the data store • Two data stores cannot be connected by a data flow Data StoresD1 Data StoresD1 Data StoresD1 Writing Reading
  • 10.
    • Data canflow from – External entity to process – Process to external entity – Process to store and back – Process to process • Data cannot flow from – External entity to external entity – External entity to store – Store to external entity – Store to store
  • 11.
    • Use meaningfulnames for data flows, processes and data stores. • Use top down development starting from context diagram and successively levelling DFD • Only previously stored data can be read • A process can only transfer input to output. It cannot create new data • Data stores cannot create new data
  • 12.
     Context diagram Level-0 diagram (System diagram)  Level-n diagram - Detail of one process from next highest level  Primitive diagram (Lowest level DFD)
  • 13.
     If aprocess p is expanded, the process at the next level are labelled as p.1, p.2 etc.  All data flow entering or leaving p must also enter or leave it’s expanded version  Expanded DFD may have data stores  No external entity can appear in expanded DFD  Keep the number of processes at each level less than 7
  • 14.
     Draw oneprocess representing the entire system (process 0)  Find all inputs and outputs that come from or go to external entities; draw as data flows.  Draw in external entities as the source or destination of the data flows.
  • 15.
    Context Diagram External entityData flow The entire system
  • 16.
    IT’S A BADDFD  Do not use direct data flows from one data store to another. There must be a process between the store.s  Do not use direct data flows from an external entity to a data store flows. Again, a process is needed between them.  Do not show direct data flows between external entities.
  • 17.
    Bad! Flow betweenexternal entities Weather bureauFire brigade Weather forecast Call for help Assess fire risk Weather forecast
  • 18.
    Bad! Flow directto data store Weather bureauFire brigade Weather forecast Call for help Assess fire risk Weather forecast Forecast history
  • 19.
    Bad! Flow directbetween data stores Customer Stock numbers Process order Invoice Orders Inventory Stock check Order Order