Downloaded 125 times
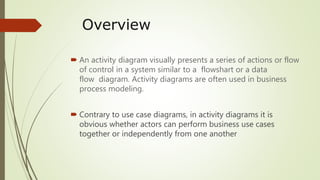

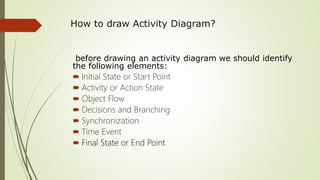
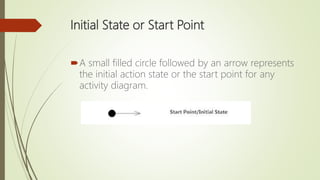
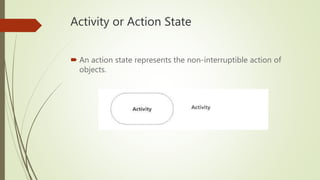


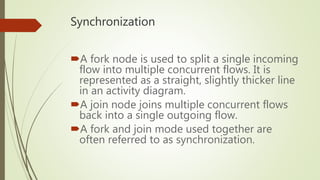
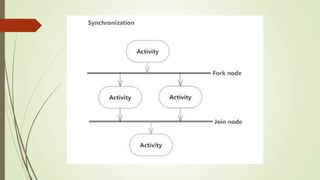
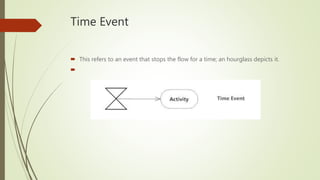
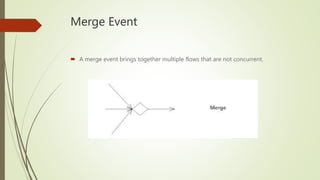
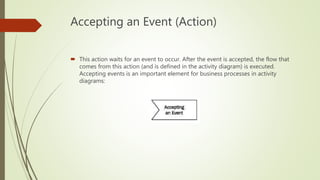

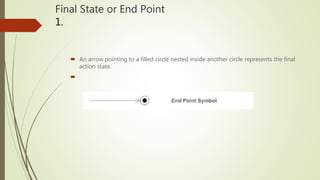
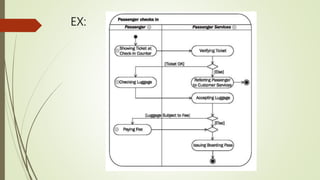

Activity diagrams visually represent the flow of control and actions in a system, serving as a tool for business process modeling. Key components include initial states, actions, decisions, synchronization, and final states, which help delineate the sequence and structure of activities. These diagrams are useful for modeling workflows, business requirements, and understanding system functionalities.


![谷歌留痕技术教程[ 𝙩𝙤𝙥 𝟮𝟯𝟯. 𝙘 𝙤𝙢 ]](https://cdn.slidesharecdn.com/ss_thumbnails/top233-260130173900-2eb784f9-thumbnail.jpg?width=640&height=640&fit=bounds)


