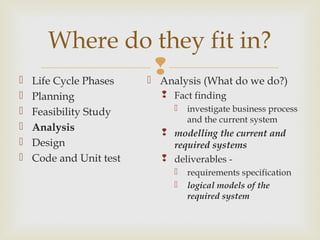
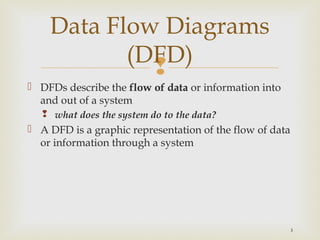
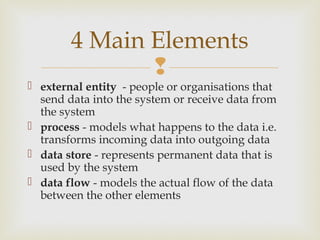
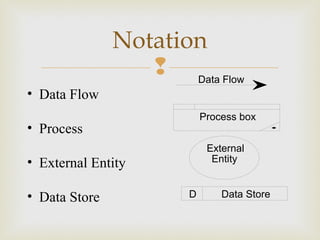
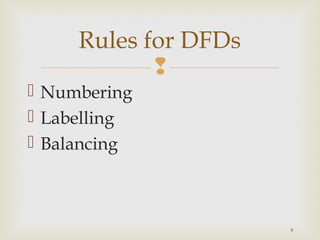
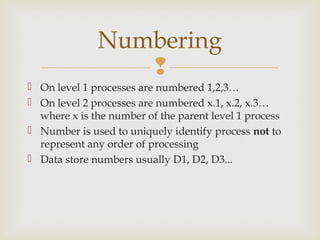
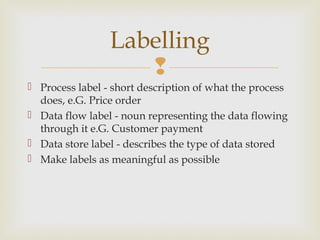
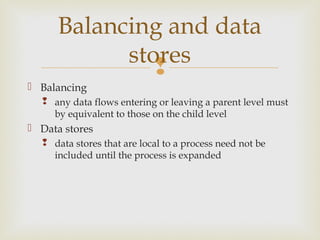
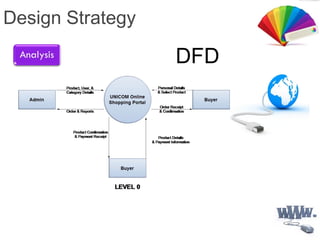
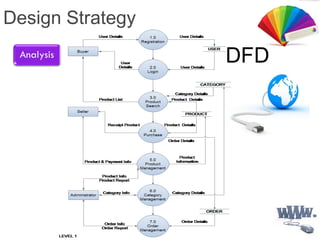
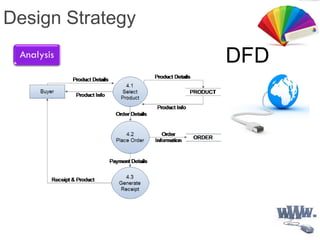
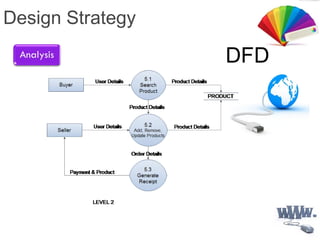
System analysis and design involves analyzing business processes and requirements and designing logical systems models. Key activities include fact finding, modeling current and required systems, and producing requirements specifications and logical models. Data flow diagrams (DFDs) are a common modeling technique, depicting the flow of data through a system via processes, external entities, and data stores. DFDs are drawn at different levels of detail, with level 0 providing an overview and higher levels showing more granular decompositions of processes. Proper notation, numbering, labeling, and balancing are important for effective DFDs.
A graphical tool, useful for communicating with users, managers, and other personnel.
Used to perform structured analysis to determine logical requirements.
Useful for analyzing existing as well as proposed systems.
Focus on the movement of data between external entities and processes, and between processes and data stores.
A relatively simple technique to learn and use.
Data flow Diagram
In this presentation we are going to briefly
Describe what is DFD.
Why Should Use DFD ?
Components of a generic DFD.
Levels of DFD.
DFD with an example (SMS Mela).
Data modeling is a process used to define and analyze data requirements needed to support the business processes within the scope of corresponding information systems in organizations.
the ppt contains the overview about the Data Flow Diagram.it will be the simple powerpoint file and it contains a brief view on elements of the Data Flow Diagram,it also contains the level 0 and level 1 diagrams.
In computer science, a data structure is a data organization, management, and storage format that enables efficient access and modification. More precisely, a data structure is a collection of data values, the relationships among them, and the functions or operations that can be applied to the data. https://apkleet.com
<a href="https://apkleet.com" >games apk </a>
This is the 3- Tier architecture of Data Warehouse. This is the topic under Data Mining subject. Data mining is extracting knowledge from large amount of data.
Agile Requirements are lightweight by design, so what can you do as the BA to convey requirements in a concise yet comprehensive way? How can you include real examples in your requirements to increase clarity and reduce ambiguity when working with your team?
In this presentation, Rebecca Halstead shares how to incorporate examples in your requirements as a way to encourage collaboration and build a shared understanding about the acceptance criteria. Rebecca delivered this presentation on Agile Requirements at the International Institute of Business Analysis, DC Chapter meeting on March 20, 2014.
in this presentation Data Flow Diagrams (DFD),DFD Development : Basic Rules,Process Naming,Creating Context Diagram,Context Diagram,Diagram 0 (Next Level),Child Diagram,Typical Errors in DFD,Logical & physical Data Flow,Transitions,Logical vs Physical Data Flow,Reason for partitioning DFD,CRUD Matrix,Event Response Table,Use Case and Flow Diagrams..
The data Flow Diagram(DFD) represents how data objects are transformed when they flow through a process or system.
DFD includes-
Data inputs and outputs.
Datastores.
Various processes and subprocesses the data moves through.
Standardized symbols and notations to describe various entities and their relationships.
Rules:
1. Each process should have at least one input and one output.
2. Datastore should have at least one flow in and one flow out.
3. Data can not flow between two entities or two data stores. Data flow can occur from one data store to many processes.
4. Data stored in a system must go through a process.
5. All the processes in DFD must go to another process or data store .
Operation “Blue Star” is the only event in the history of Independent India where the state went into war with its own people. Even after about 40 years it is not clear if it was culmination of states anger over people of the region, a political game of power or start of dictatorial chapter in the democratic setup.
The people of Punjab felt alienated from main stream due to denial of their just demands during a long democratic struggle since independence. As it happen all over the word, it led to militant struggle with great loss of lives of military, police and civilian personnel. Killing of Indira Gandhi and massacre of innocent Sikhs in Delhi and other India cities was also associated with this movement.
How to Create Map Views in the Odoo 17 ERPCeline George
The map views are useful for providing a geographical representation of data. They allow users to visualize and analyze the data in a more intuitive manner.
Instructions for Submissions thorugh G- Classroom.pptxJheel Barad
This presentation provides a briefing on how to upload submissions and documents in Google Classroom. It was prepared as part of an orientation for new Sainik School in-service teacher trainees. As a training officer, my goal is to ensure that you are comfortable and proficient with this essential tool for managing assignments and fostering student engagement.
Ethnobotany and Ethnopharmacology:
Ethnobotany in herbal drug evaluation,
Impact of Ethnobotany in traditional medicine,
New development in herbals,
Bio-prospecting tools for drug discovery,
Role of Ethnopharmacology in drug evaluation,
Reverse Pharmacology.
Synthetic Fiber Construction in lab .pptxPavel ( NSTU)
Synthetic fiber production is a fascinating and complex field that blends chemistry, engineering, and environmental science. By understanding these aspects, students can gain a comprehensive view of synthetic fiber production, its impact on society and the environment, and the potential for future innovations. Synthetic fibers play a crucial role in modern society, impacting various aspects of daily life, industry, and the environment. ynthetic fibers are integral to modern life, offering a range of benefits from cost-effectiveness and versatility to innovative applications and performance characteristics. While they pose environmental challenges, ongoing research and development aim to create more sustainable and eco-friendly alternatives. Understanding the importance of synthetic fibers helps in appreciating their role in the economy, industry, and daily life, while also emphasizing the need for sustainable practices and innovation.
The Roman Empire A Historical Colossus.pdfkaushalkr1407
The Roman Empire, a vast and enduring power, stands as one of history's most remarkable civilizations, leaving an indelible imprint on the world. It emerged from the Roman Republic, transitioning into an imperial powerhouse under the leadership of Augustus Caesar in 27 BCE. This transformation marked the beginning of an era defined by unprecedented territorial expansion, architectural marvels, and profound cultural influence.
The empire's roots lie in the city of Rome, founded, according to legend, by Romulus in 753 BCE. Over centuries, Rome evolved from a small settlement to a formidable republic, characterized by a complex political system with elected officials and checks on power. However, internal strife, class conflicts, and military ambitions paved the way for the end of the Republic. Julius Caesar’s dictatorship and subsequent assassination in 44 BCE created a power vacuum, leading to a civil war. Octavian, later Augustus, emerged victorious, heralding the Roman Empire’s birth.
Under Augustus, the empire experienced the Pax Romana, a 200-year period of relative peace and stability. Augustus reformed the military, established efficient administrative systems, and initiated grand construction projects. The empire's borders expanded, encompassing territories from Britain to Egypt and from Spain to the Euphrates. Roman legions, renowned for their discipline and engineering prowess, secured and maintained these vast territories, building roads, fortifications, and cities that facilitated control and integration.
The Roman Empire’s society was hierarchical, with a rigid class system. At the top were the patricians, wealthy elites who held significant political power. Below them were the plebeians, free citizens with limited political influence, and the vast numbers of slaves who formed the backbone of the economy. The family unit was central, governed by the paterfamilias, the male head who held absolute authority.
Culturally, the Romans were eclectic, absorbing and adapting elements from the civilizations they encountered, particularly the Greeks. Roman art, literature, and philosophy reflected this synthesis, creating a rich cultural tapestry. Latin, the Roman language, became the lingua franca of the Western world, influencing numerous modern languages.
Roman architecture and engineering achievements were monumental. They perfected the arch, vault, and dome, constructing enduring structures like the Colosseum, Pantheon, and aqueducts. These engineering marvels not only showcased Roman ingenuity but also served practical purposes, from public entertainment to water supply.
2024.06.01 Introducing a competency framework for languag learning materials ...Sandy Millin
http://sandymillin.wordpress.com/iateflwebinar2024
Published classroom materials form the basis of syllabuses, drive teacher professional development, and have a potentially huge influence on learners, teachers and education systems. All teachers also create their own materials, whether a few sentences on a blackboard, a highly-structured fully-realised online course, or anything in between. Despite this, the knowledge and skills needed to create effective language learning materials are rarely part of teacher training, and are mostly learnt by trial and error.
Knowledge and skills frameworks, generally called competency frameworks, for ELT teachers, trainers and managers have existed for a few years now. However, until I created one for my MA dissertation, there wasn’t one drawing together what we need to know and do to be able to effectively produce language learning materials.
This webinar will introduce you to my framework, highlighting the key competencies I identified from my research. It will also show how anybody involved in language teaching (any language, not just English!), teacher training, managing schools or developing language learning materials can benefit from using the framework.
The Indian economy is classified into different sectors to simplify the analysis and understanding of economic activities. For Class 10, it's essential to grasp the sectors of the Indian economy, understand their characteristics, and recognize their importance. This guide will provide detailed notes on the Sectors of the Indian Economy Class 10, using specific long-tail keywords to enhance comprehension.
For more information, visit-www.vavaclasses.com
2.
Where do they fit in?
Analysis (What do we do?)
Fact finding
investigate business process
and the current system
modelling the current and
required systems
deliverables -
requirements specification
logical models of the
required system
Life Cycle Phases
Planning
Feasibility Study
Analysis
Design
Code and Unit test
3.
3
DFDs describe the flow of data or information into
and out of a system
what does the system do to the data?
A DFD is a graphic representation of the flow of data
or information through a system
Data Flow Diagrams
(DFD)
4.
external entity - people or organisations that
send data into the system or receive data from
the system
process - models what happens to the data i.e.
transforms incoming data into outgoing data
data store - represents permanent data that is
used by the system
data flow - models the actual flow of the data
between the other elements
4 Main Elements
6.
DFD Shapes from Version
F r o m F lo w C h a r t /
D a t a F lo w D ia g r a m
P r o c e s s
D a t a S t o r e
E x t e r n a l E n t it y
F r o m S o f t w a r e D ia g r a m /
G a n e - S a r s o n D F D
P r o c e s s
ID #
ID
#
E x t e r n a l
E n t it y
D a t a S t o r e1
External
Entity
Data Store
Process
From Flow Chart /
Data Flow Diagram
Version 5.x Version 2000
7.
4
Even a small system could have many processes and
data flows and DFD could be large and messy
use levelled DFDs - view system at different levels of
detail
one overview and many progressively greater detailed
views
Levelled DFDs
8.
models system as one process box which represents
scope of the system
identifies external entities and related inputs and
outputs
Additional notation - system box
Level 0 - Context Diagram
System boxExternal
entity
Data flow out
Data flow in
9.
gives overview of full system
identifies major processes and data flows between
them
identifies data stores that are used by the major
processes
boundary of level 1 is the context diagram
Level 1 - overview
diagram
10.
level 1 process is expanded into more detail
each process in level 1 is decomposed to show its
constituent processes
boundary of level 2 is the level 1 process
Level 2 - detailed
diagram
11. Duplicates marked by diagonal line in corner
System Boundary
Elementary Processes - star in corner
Process that is levelled - dots on top
Other Notation
13.
On level 1 processes are numbered 1,2,3…
On level 2 processes are numbered x.1, x.2, x.3…
where x is the number of the parent level 1 process
Number is used to uniquely identify process not to
represent any order of processing
Data store numbers usually D1, D2, D3...
Numbering
14.
Process label - short description of what the process
does, e.G. Price order
Data flow label - noun representing the data flowing
through it e.G. Customer payment
Data store label - describes the type of data stored
Make labels as meaningful as possible
Labelling
15.
Balancing
any data flows entering or leaving a parent level must
by equivalent to those on the child level
Data stores
data stores that are local to a process need not be
included until the process is expanded
Balancing and data
stores
16.
Allowed to combine several data flows from lower
level diagrams at a higher level under one data flow
to reduce clutter
Flows should be labelled except when data to or
from a data store consists of all items in the data
store
Data Flows
17.
Find the people who send data into the system
Often data is part of a PHYSICAL transaction
When handing a bar of chocolate to a shopkeeper, you
are handing him/her a barcode.
Find the people who get data out of the system.
The only data you need is data that is transformed or
sent completely out of the system – not data that is
handled by an operator within the system.
Context Diagram
23.
Font: Arial
Font Size: 12
Title Page Margin
Top: 2”
Bottom: 1”
Left: 1.5”
Right: 1”
SAD Documentation
Font: Arial
Font Size: 12
Page Margin
Top: 1”
Bottom: 1”
Left: 1.5”
Right: 1”
Editor's Notes
Use example of borrow library book here to illustrate the different components.
Student is external passes in request (book and student details) into validate student process output valid student request into reserve book process. Two data stores, students and loans. Output back to student is book;
Case study - Just A Line system
sides of context process box = system boundary
Example context diagram for library, inputs= book request, book return and output = book; external entity = student.
Go through the case study - context Fig 3.4 pg 32; level 1- Fig 3.5 pg 32 level 2 - Fig 3.6 pg 33
Balancing - Give example of Level 1 with 3 processes, 1,2,3 and inputs between them. In level 2 add in extra flow and leave out one of the flows. Also at level 2 introduce new flows that are internal to level 2 to show that that is OK
e.g. for combining dataflows - use level 1 diagram with customer inputting deposit to accept booking process and cutomer inputting balance to issue ticket process. Context diagram then has one input flow of payment = deposit +balance.