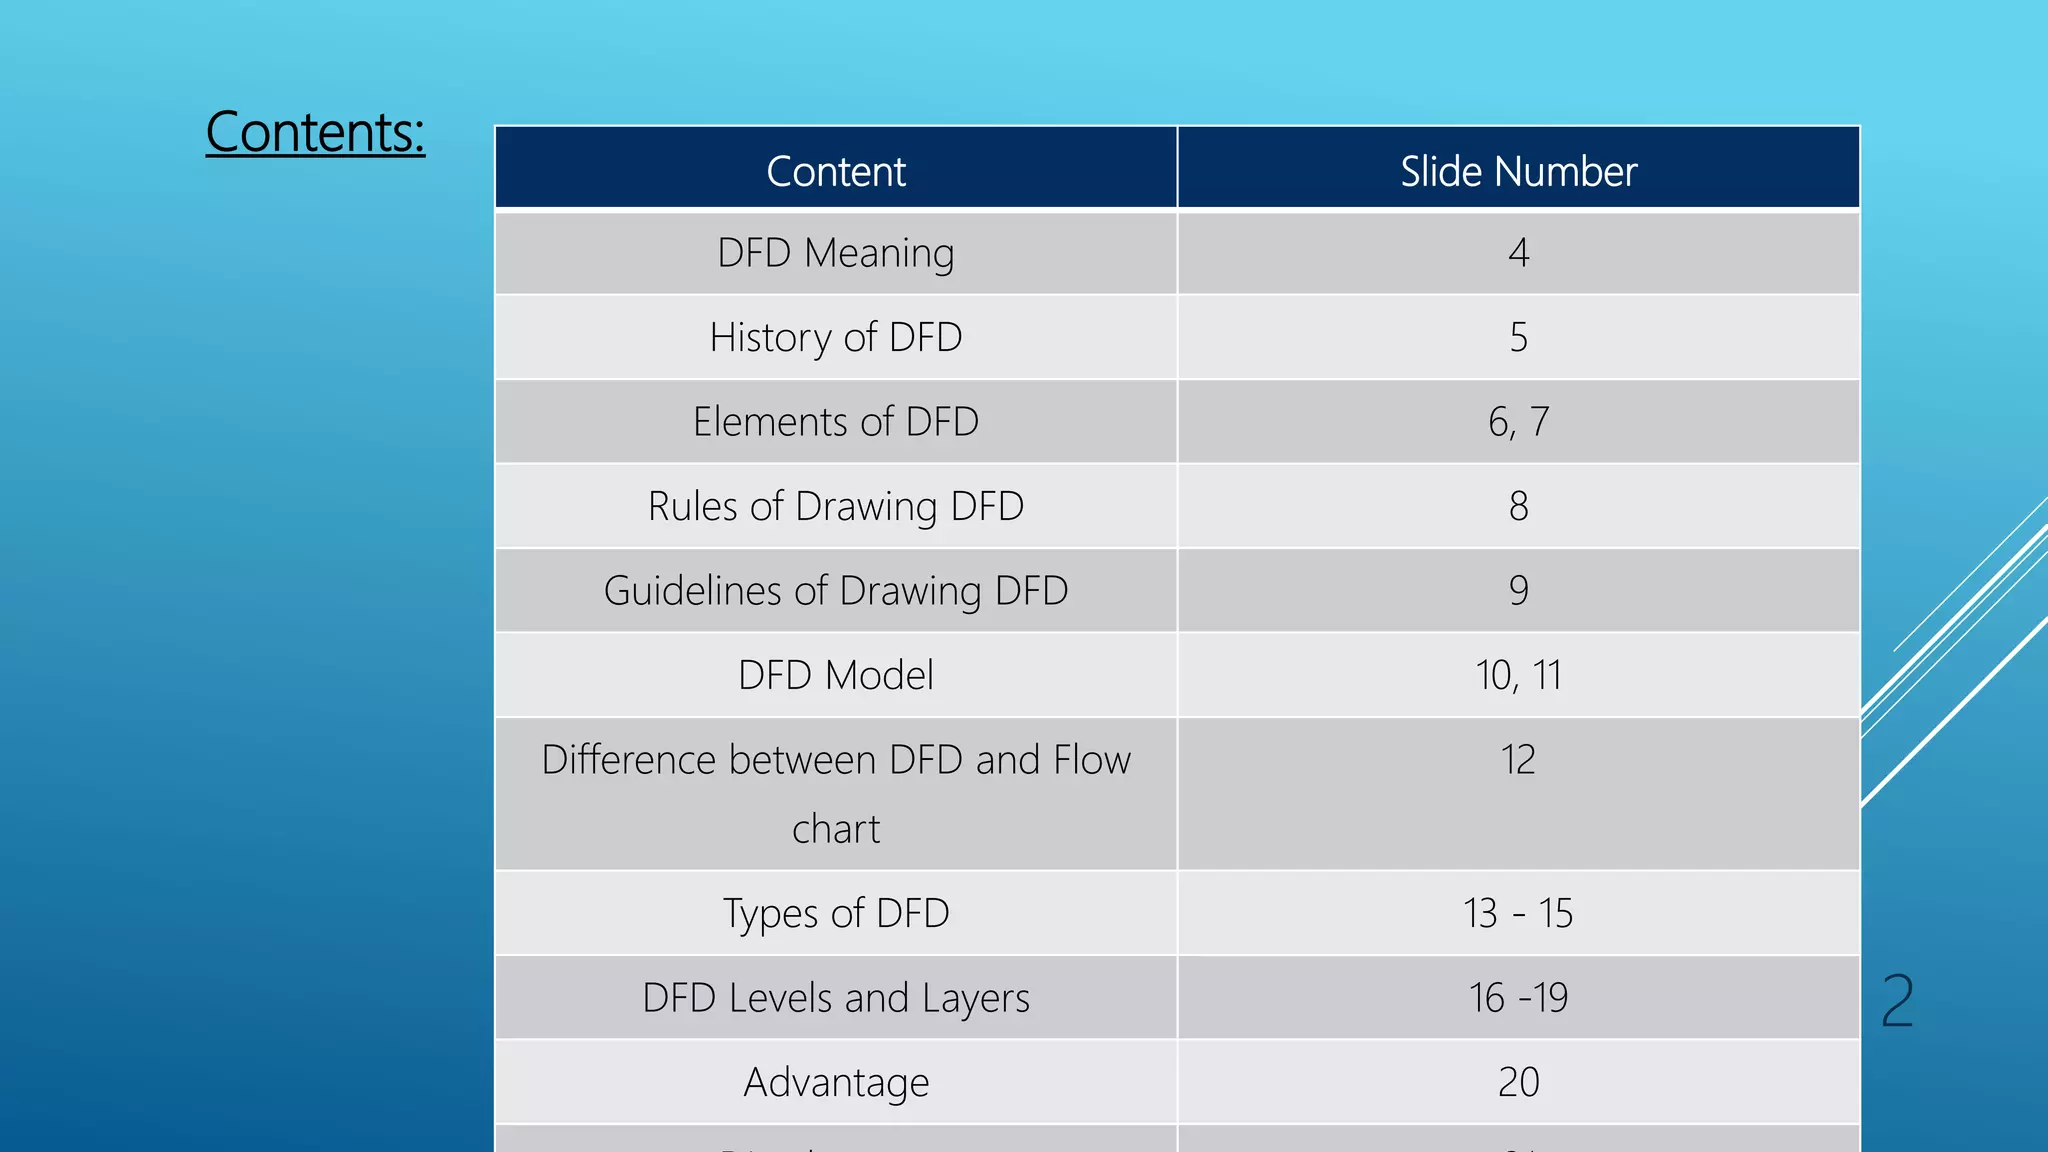
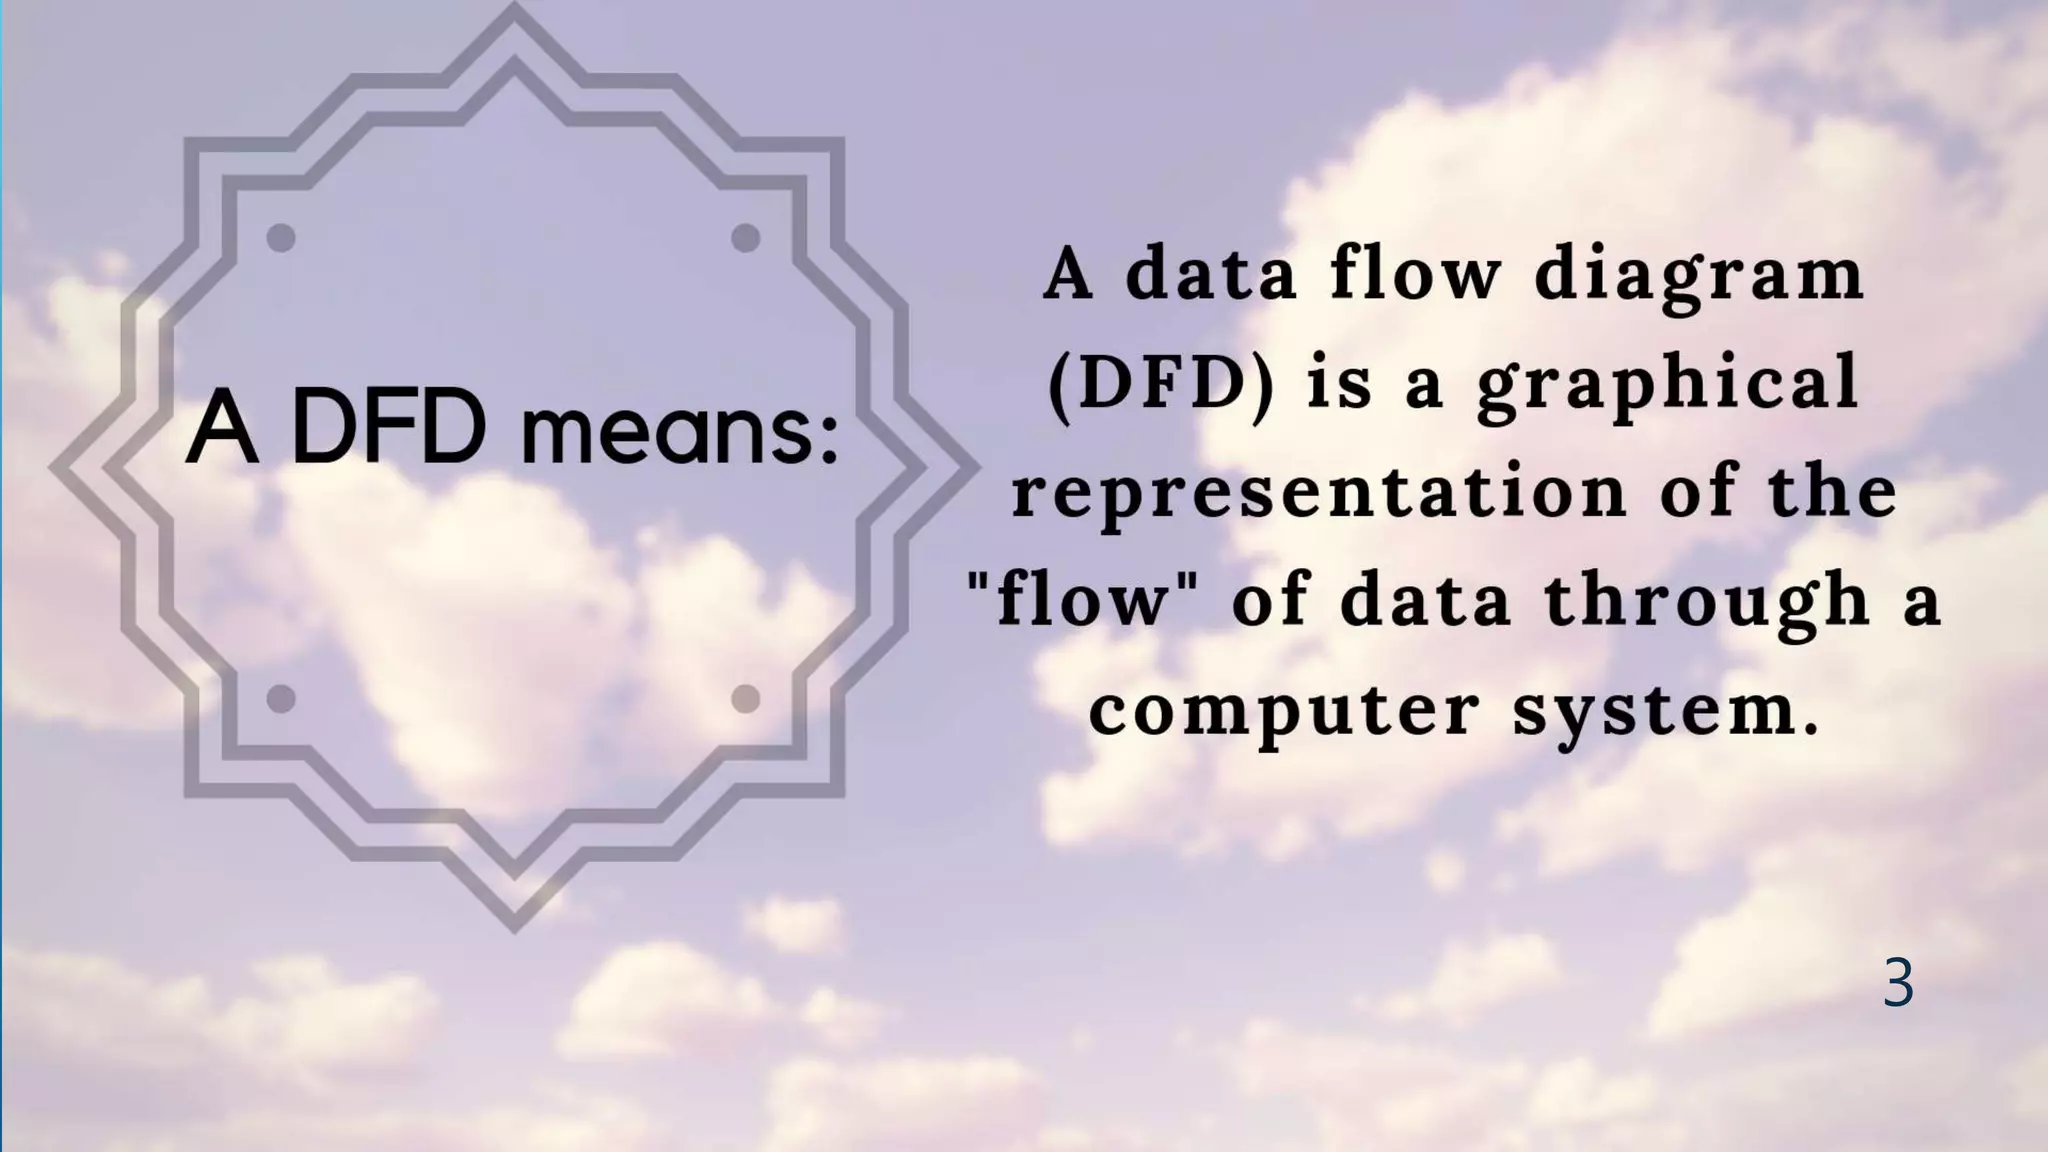
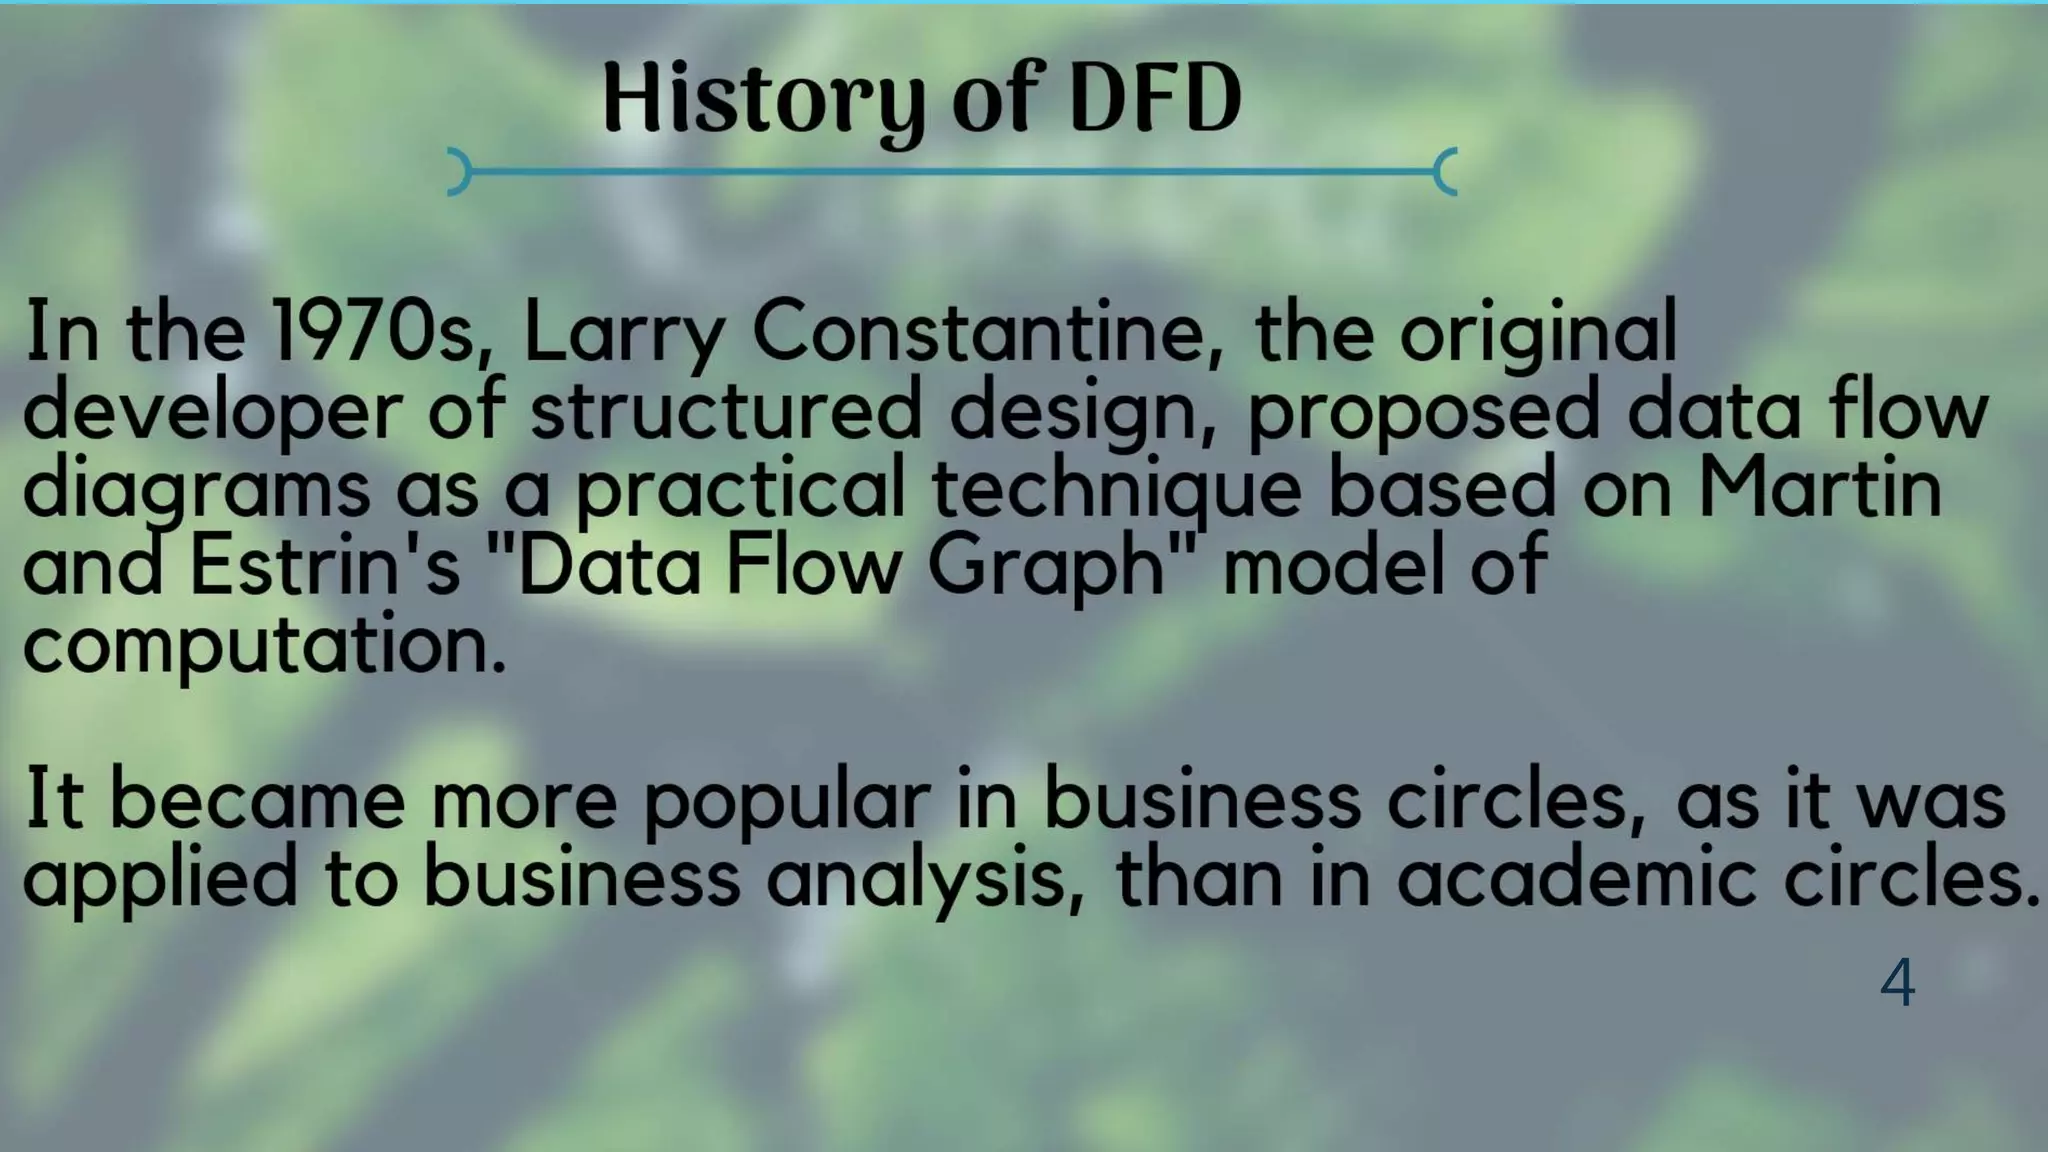
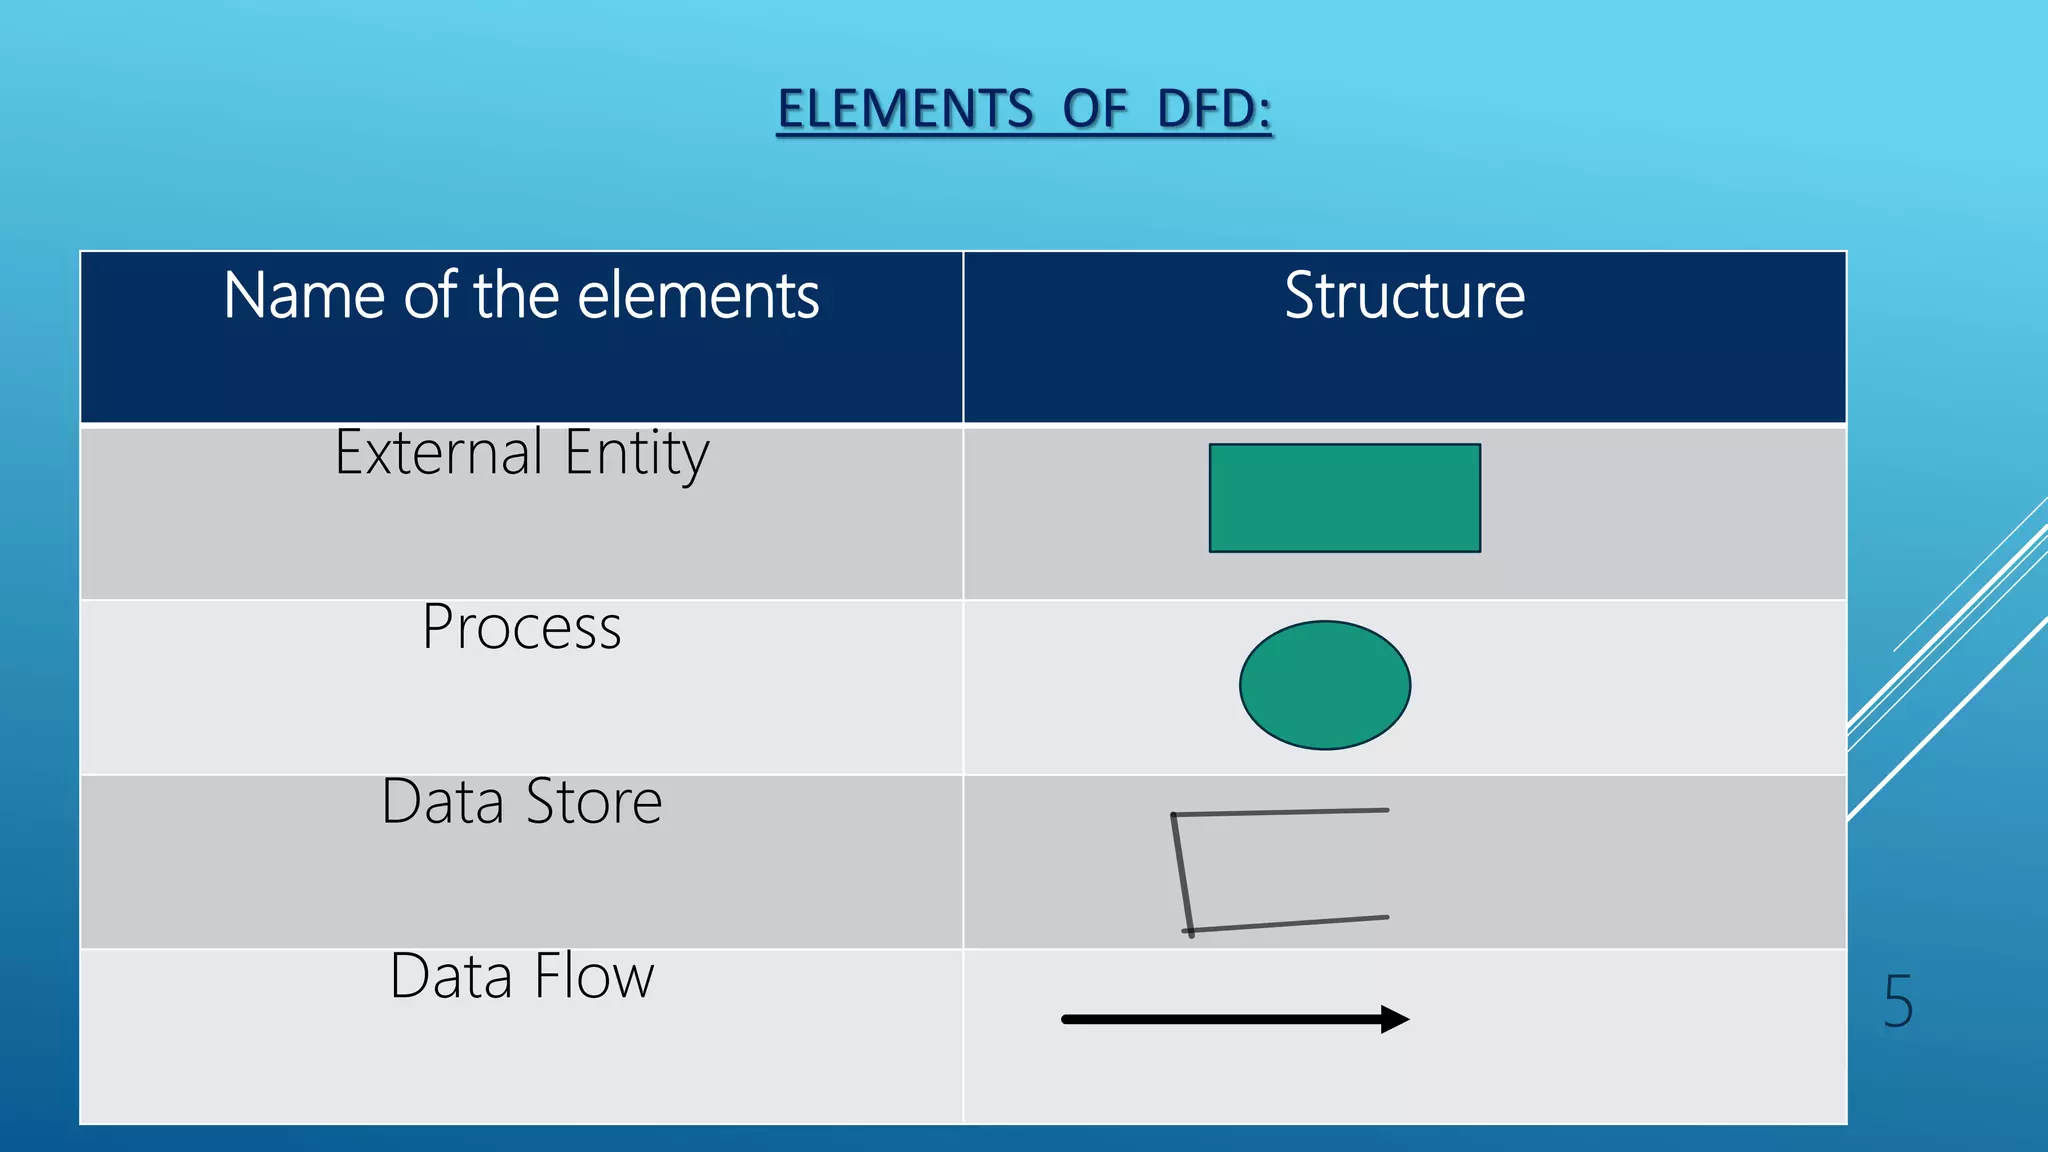
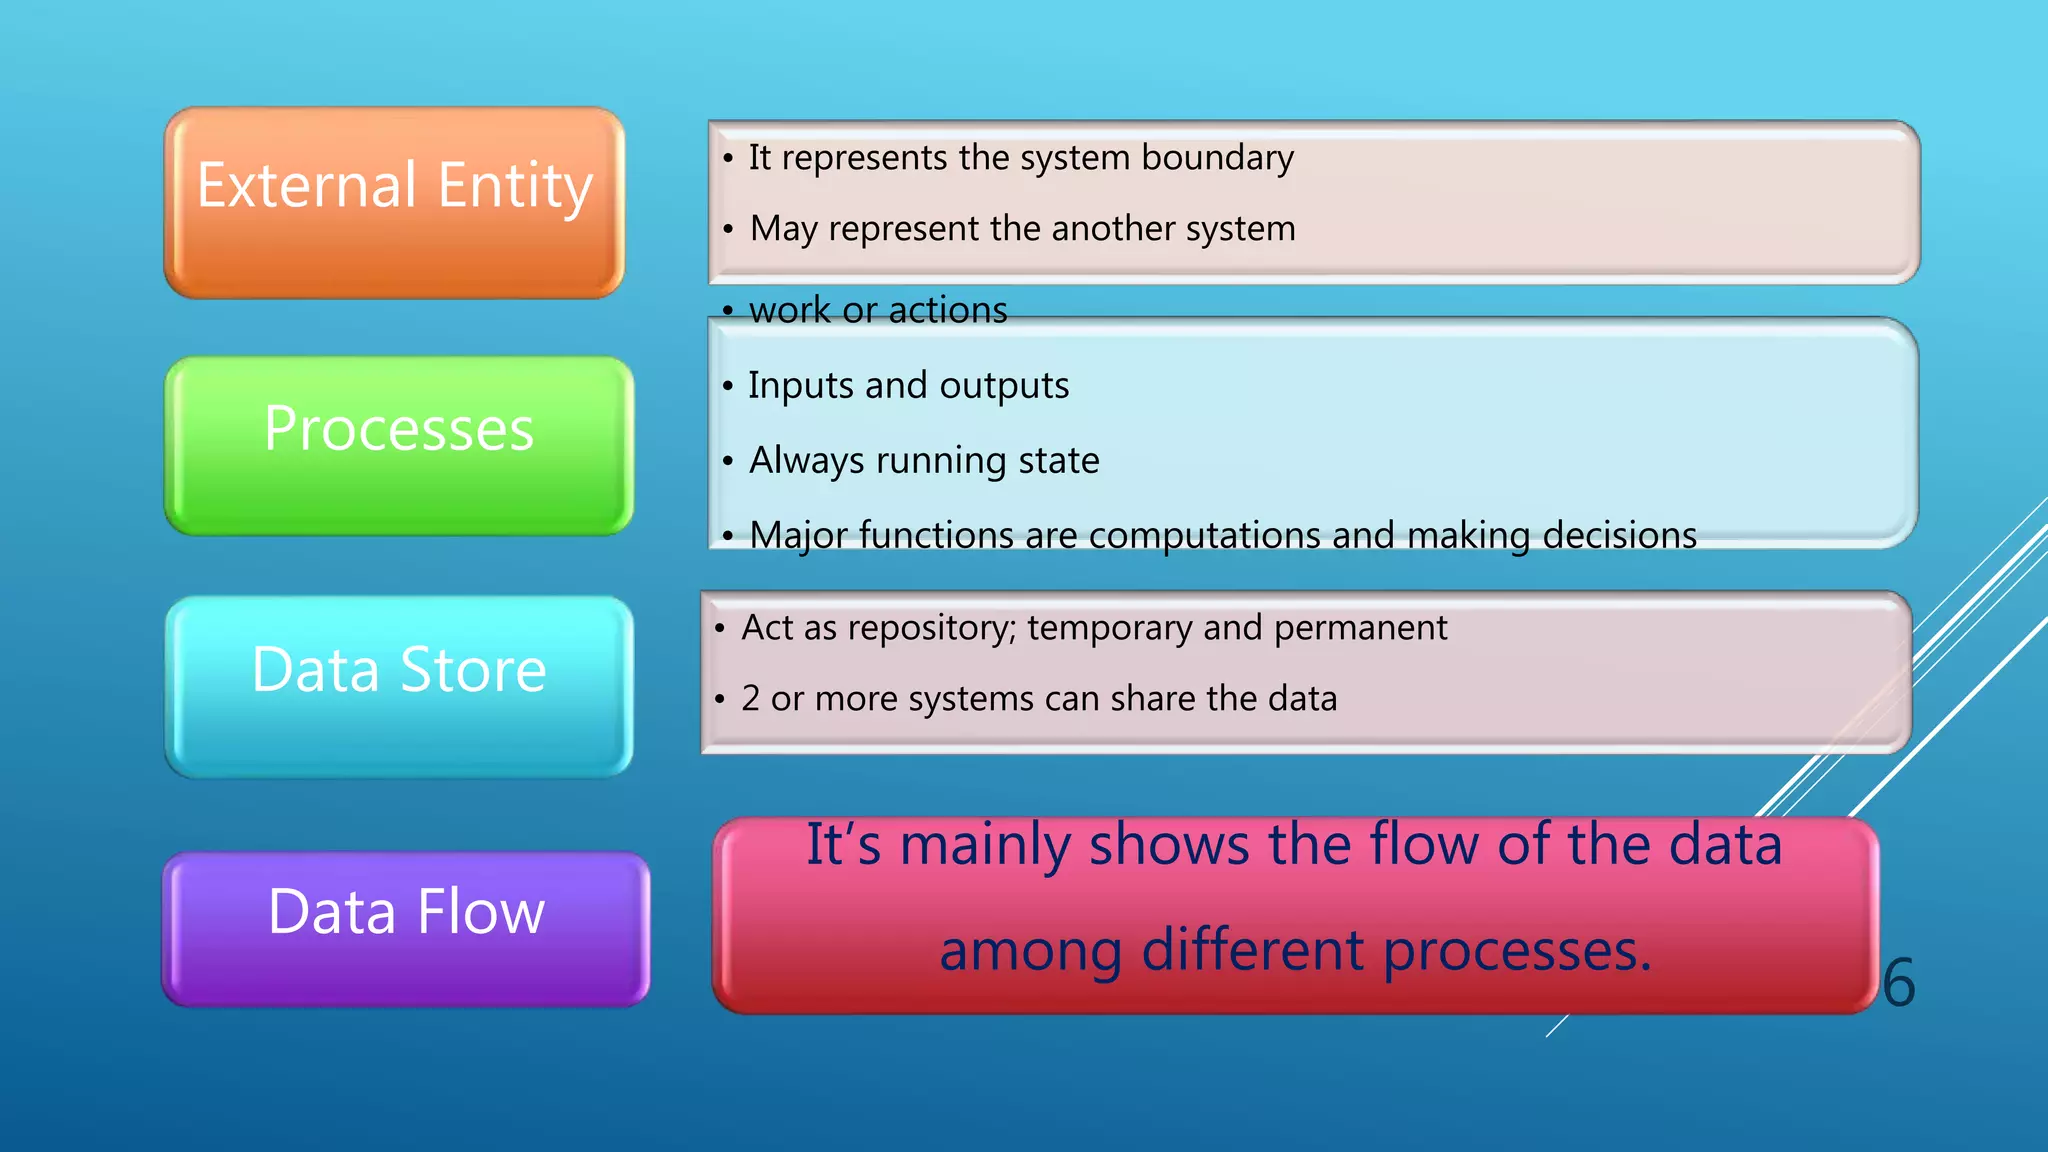
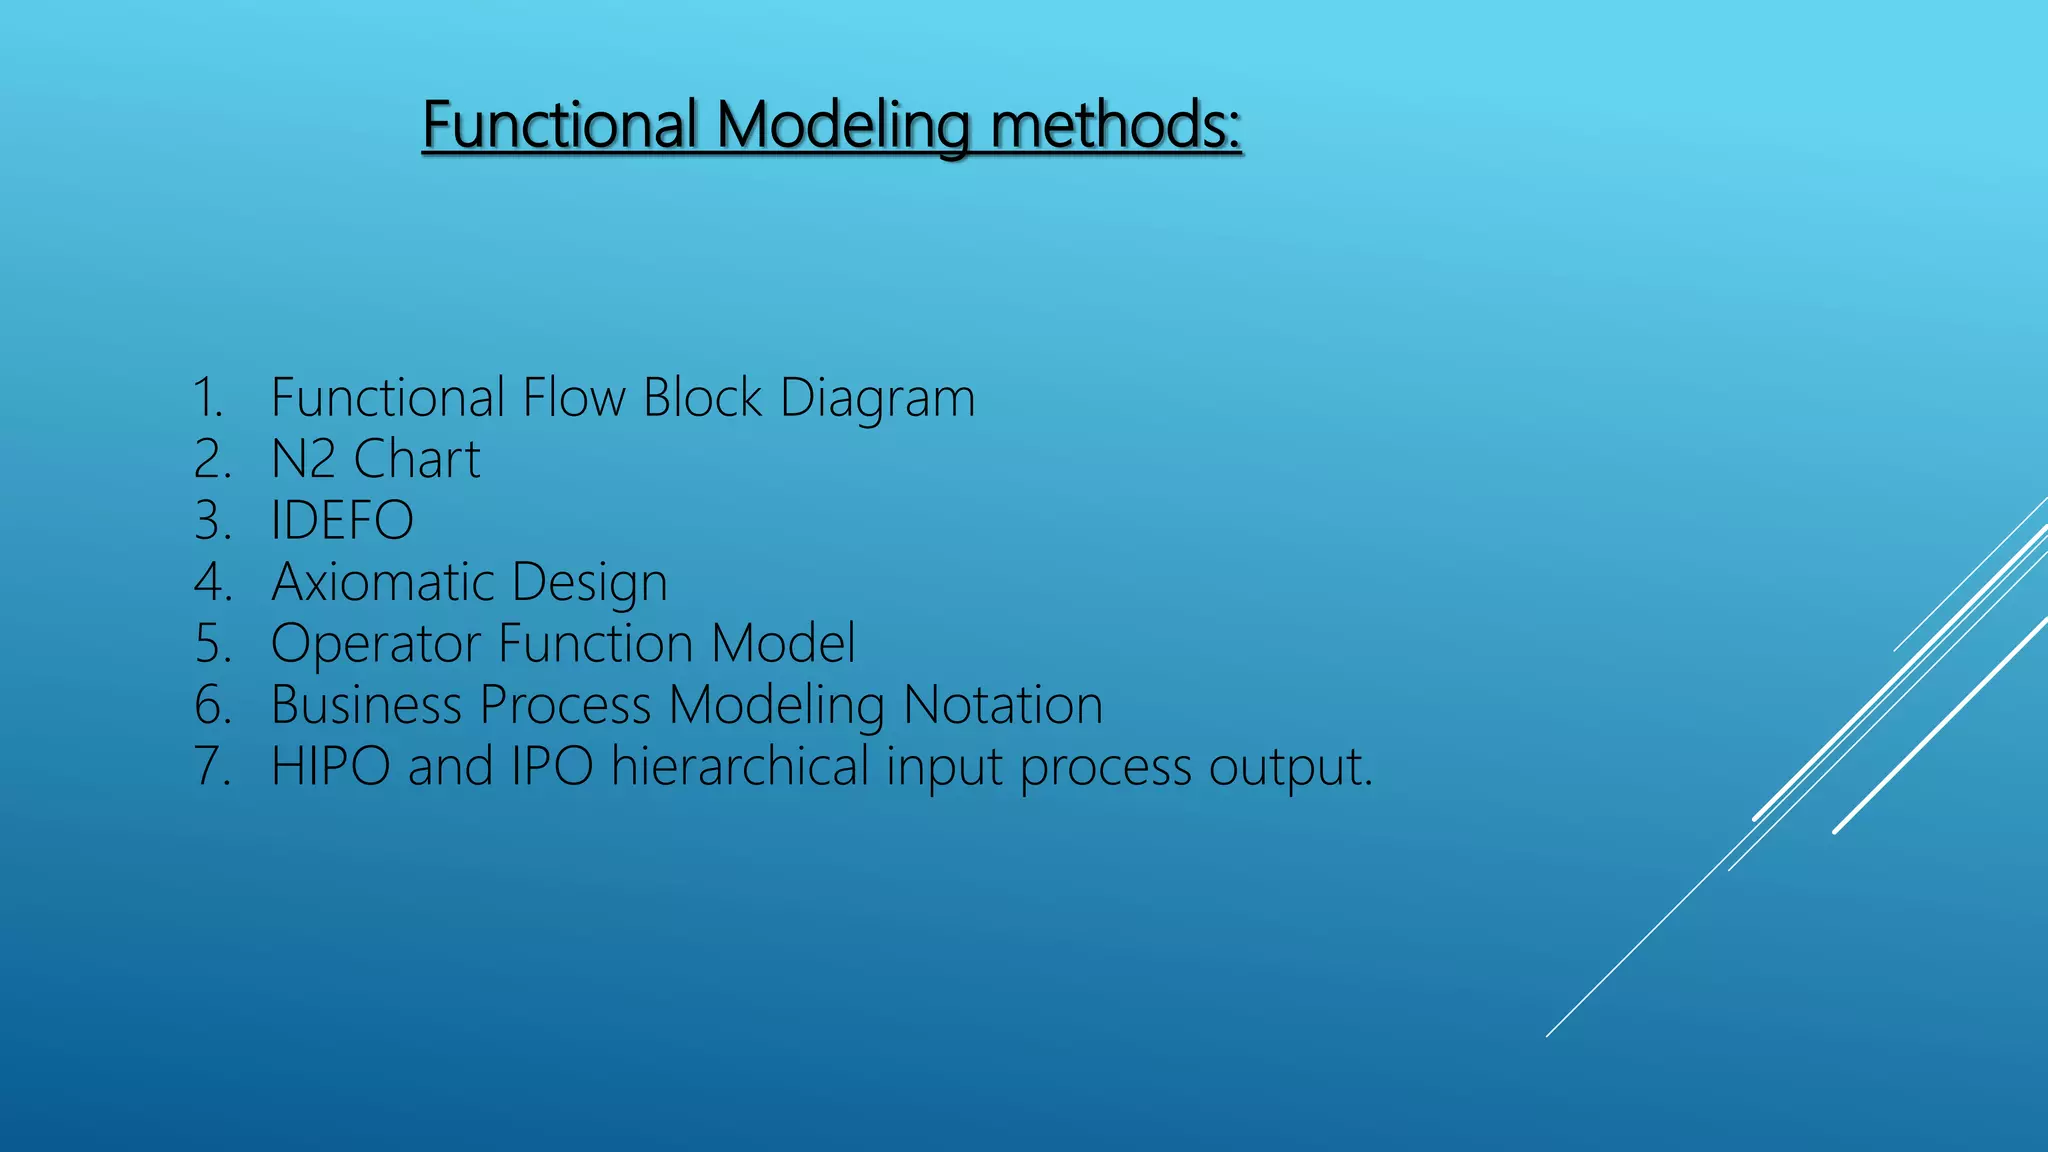
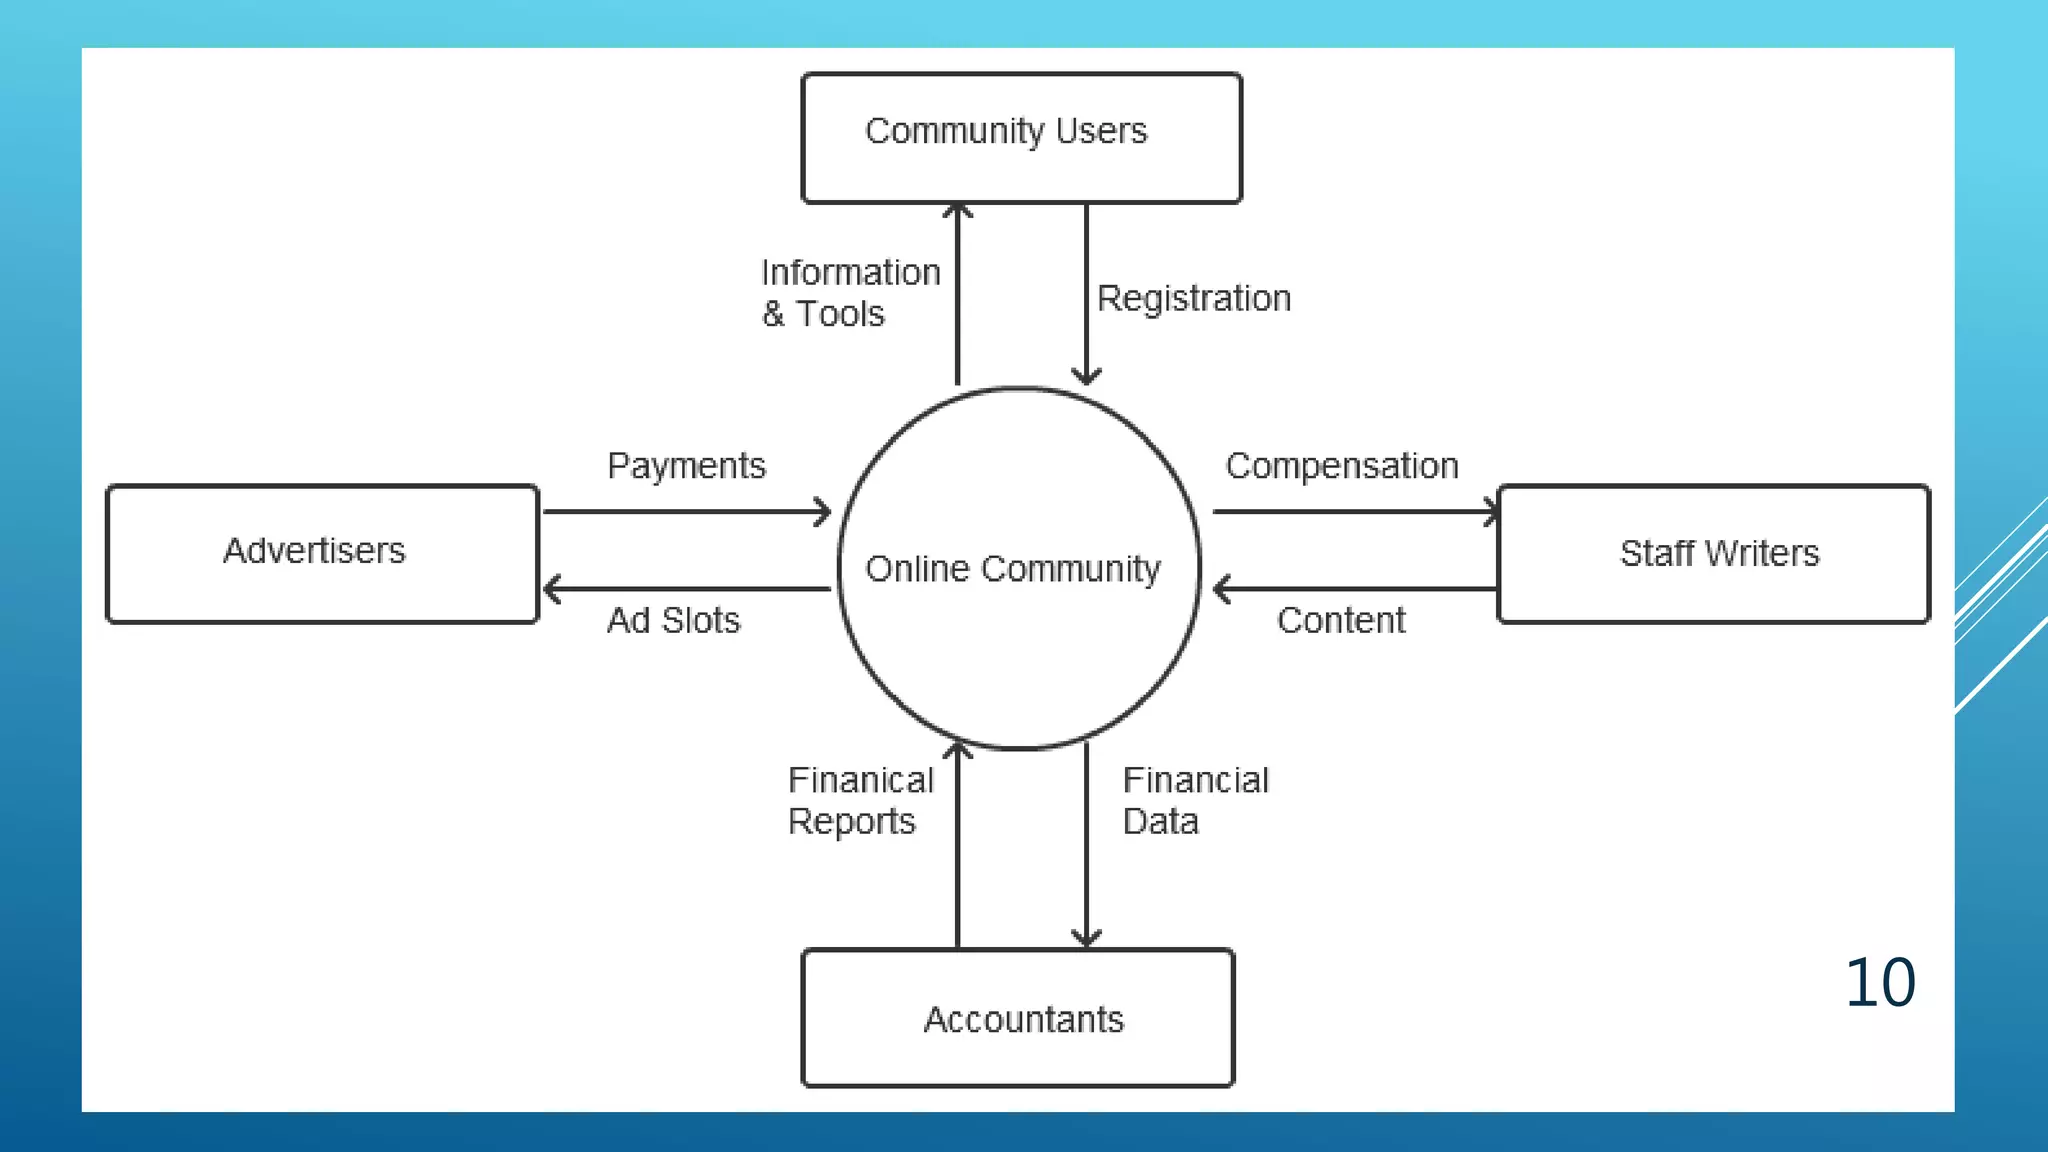
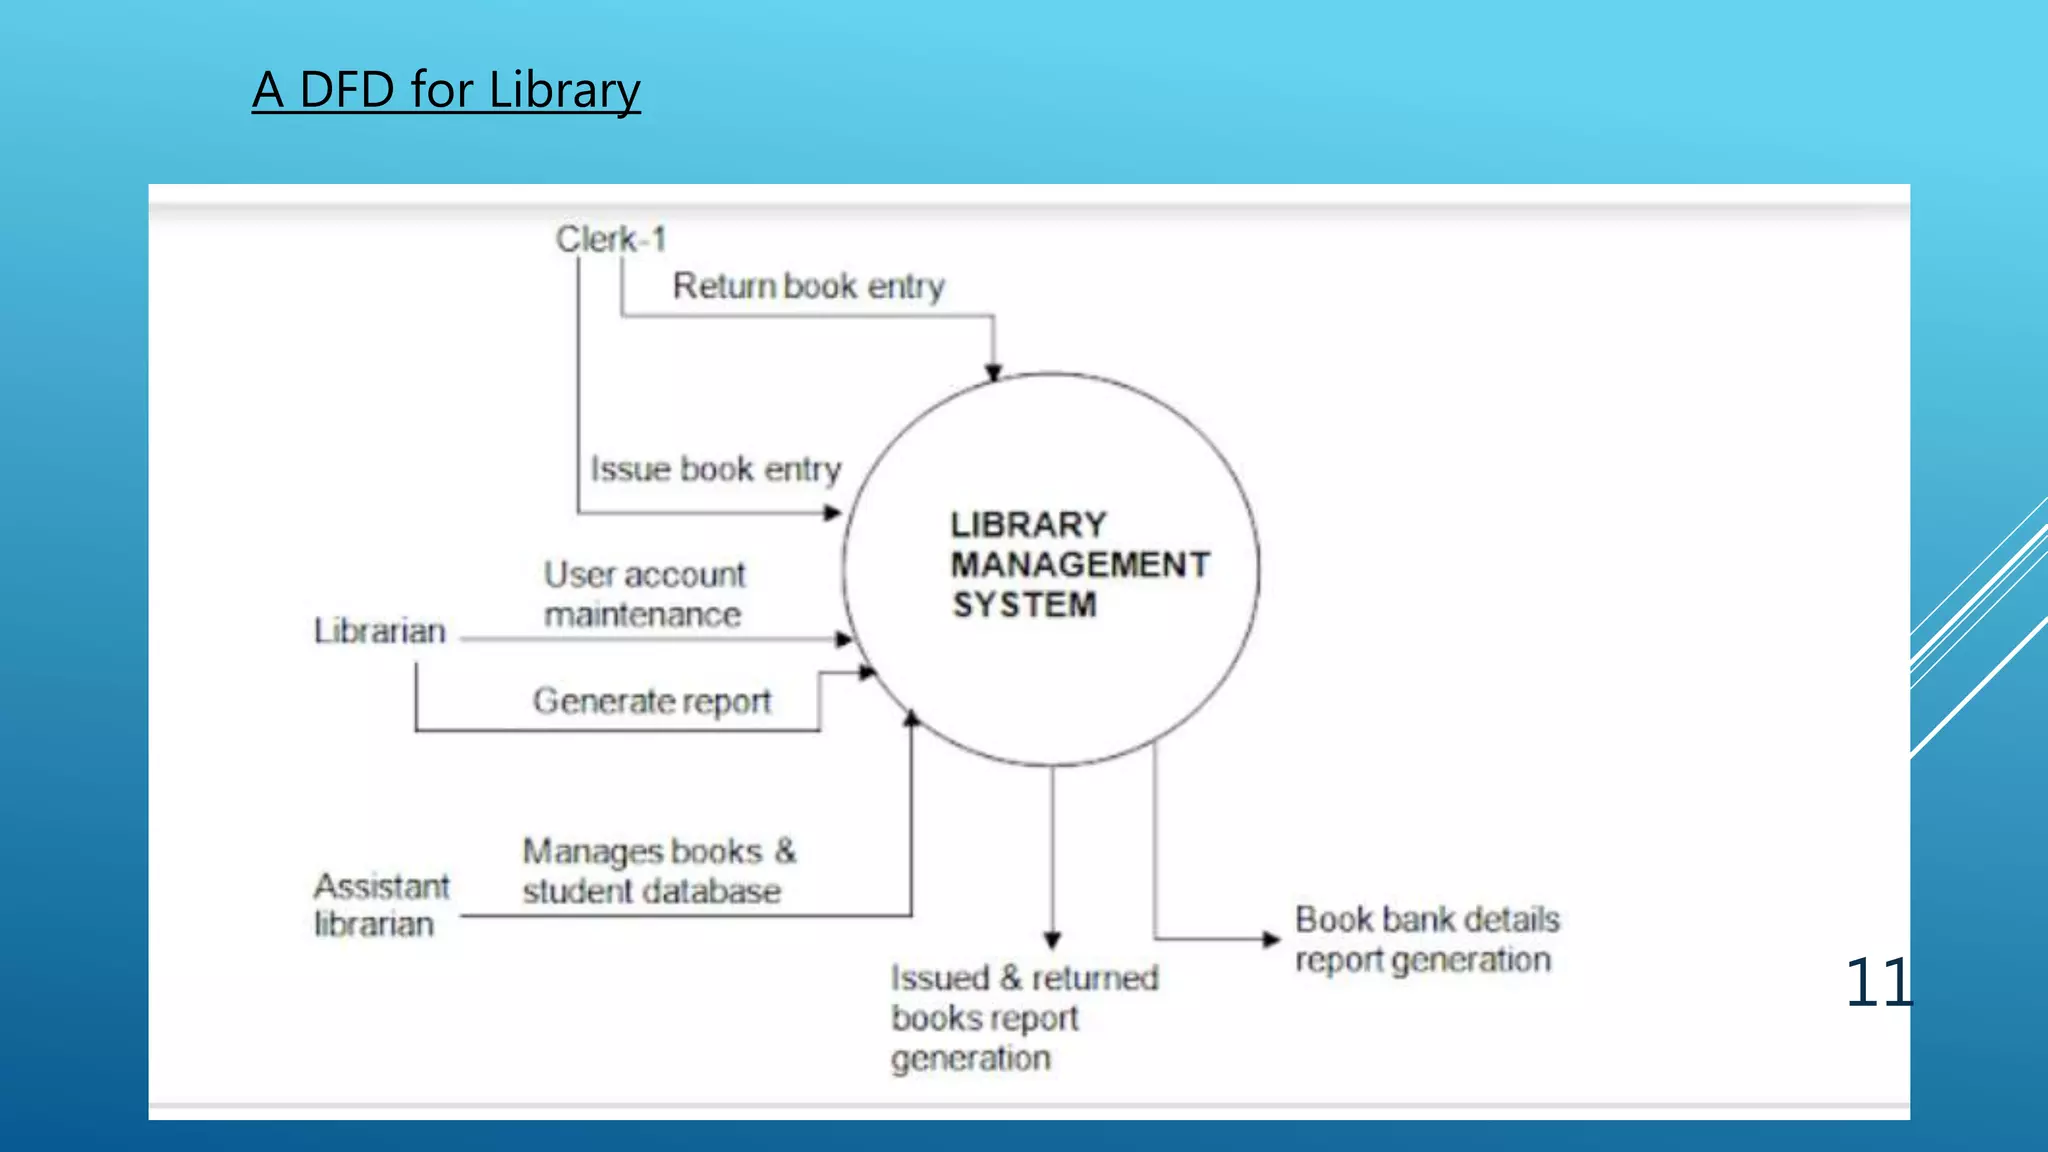
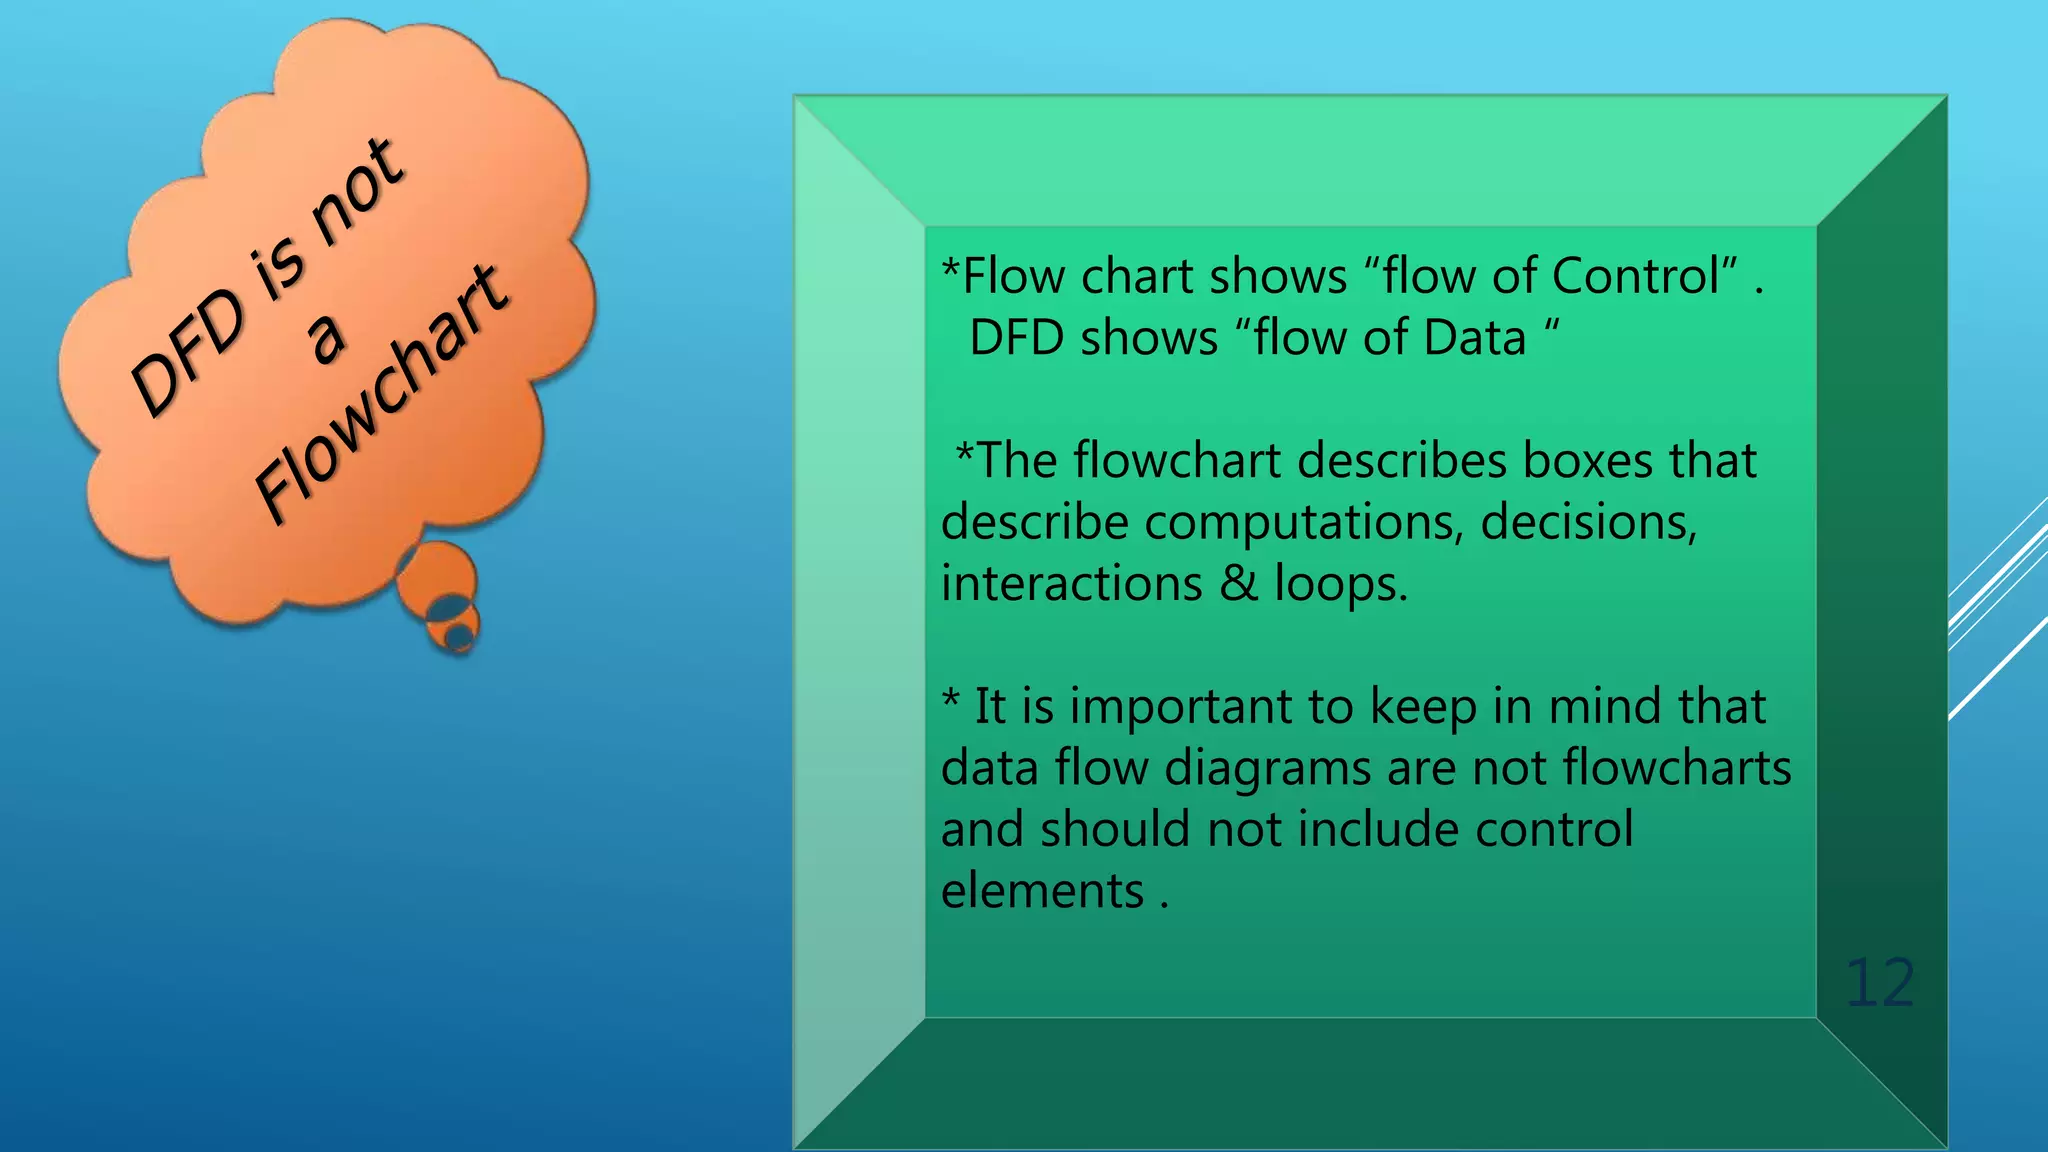
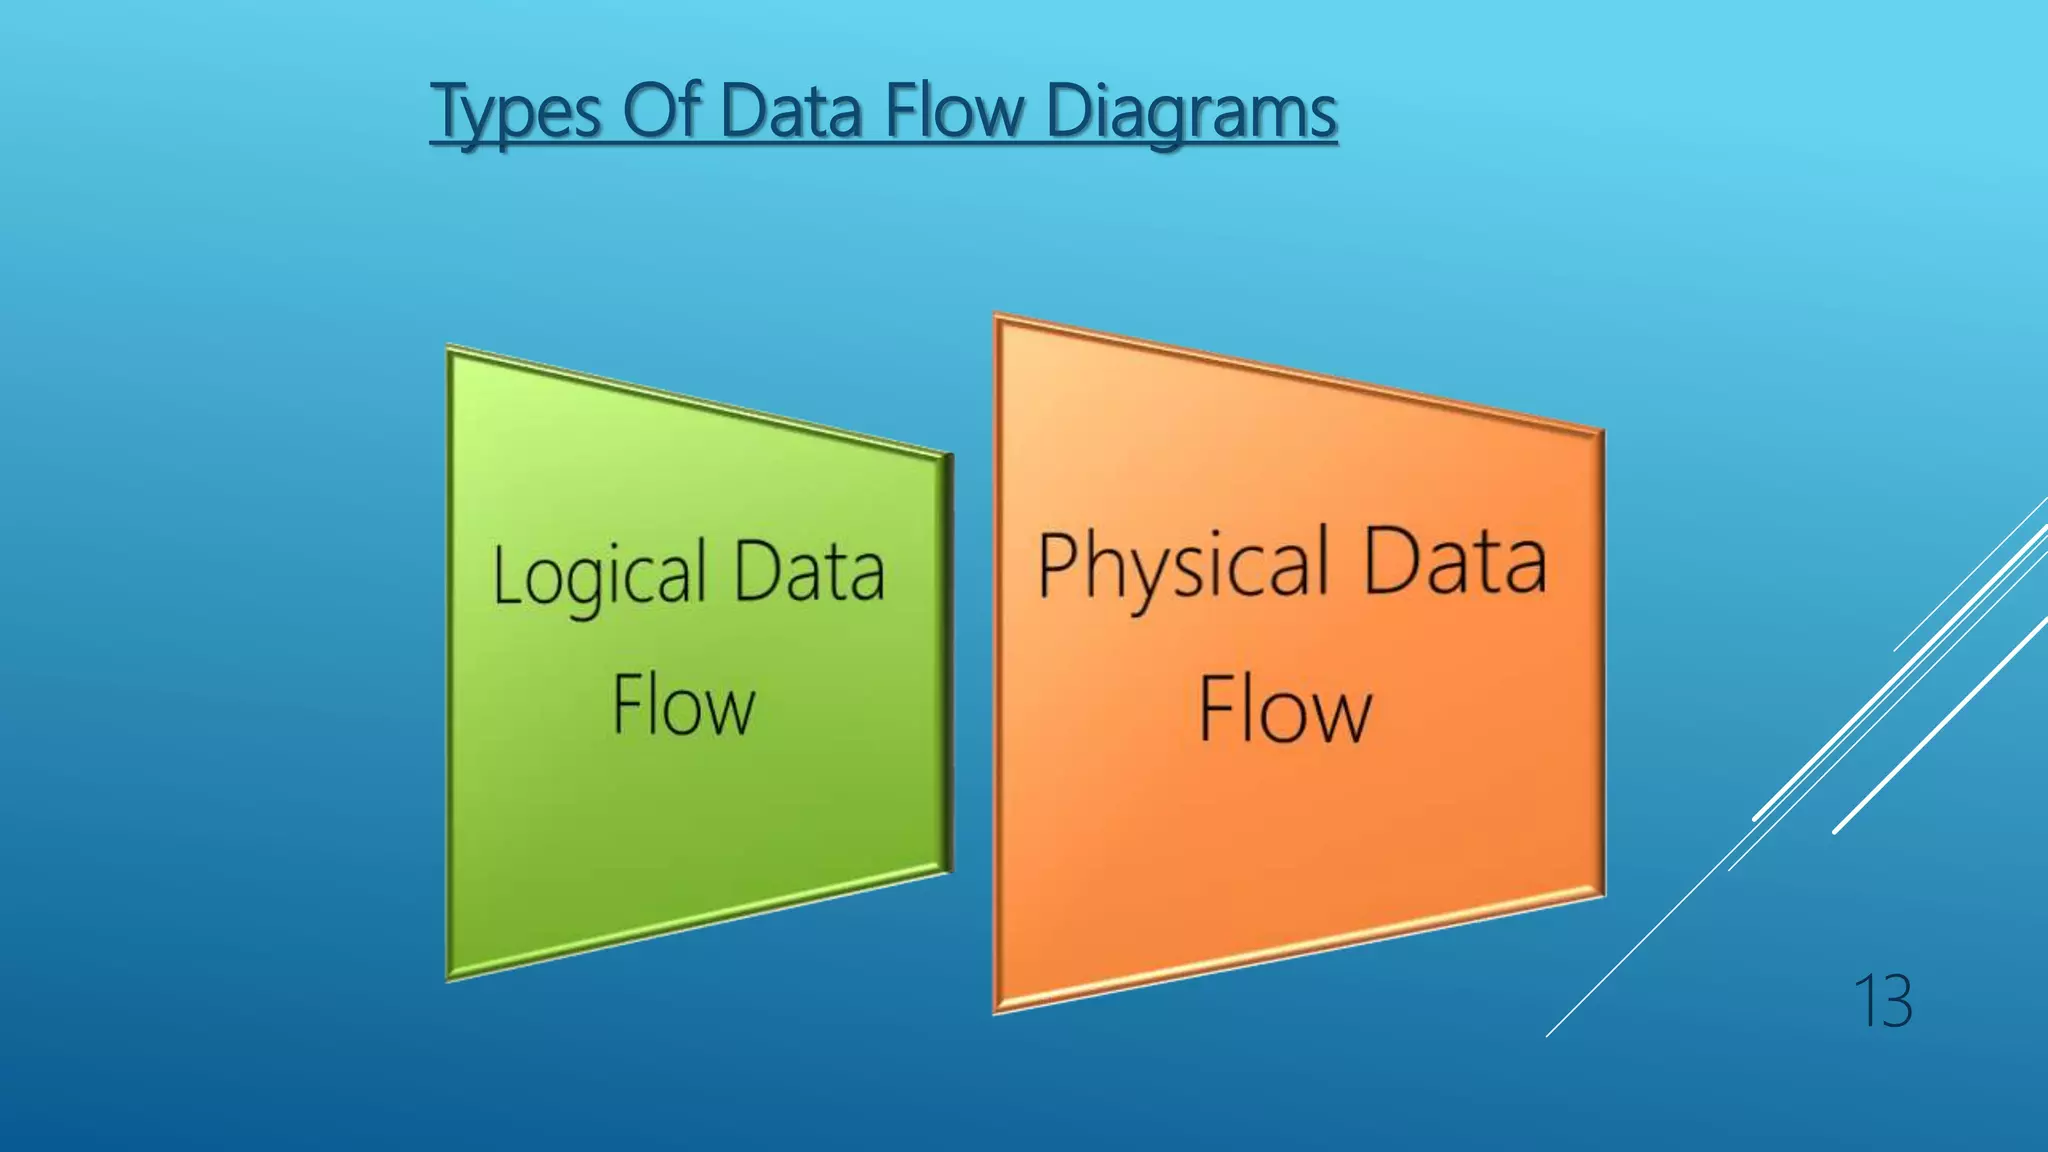
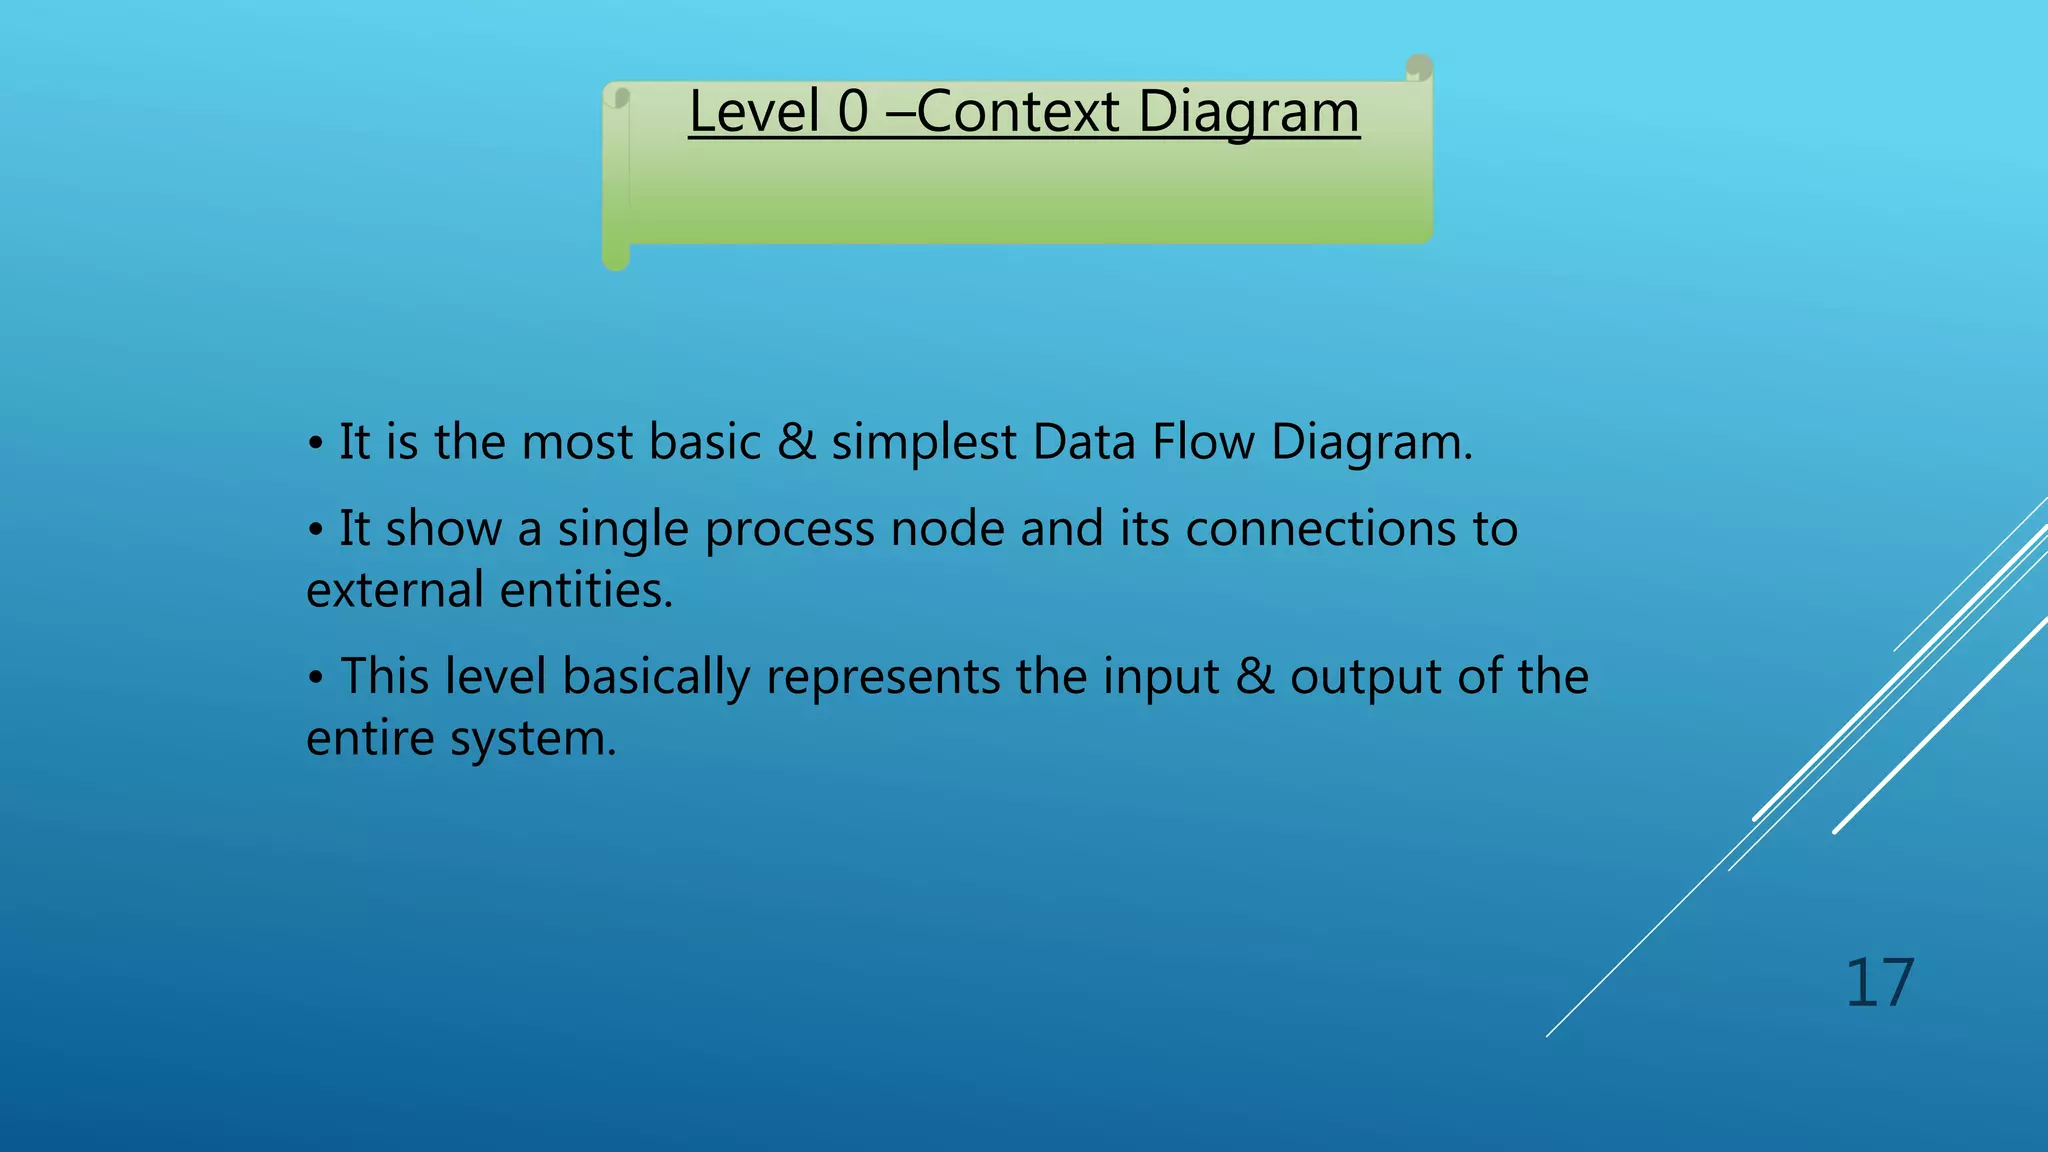
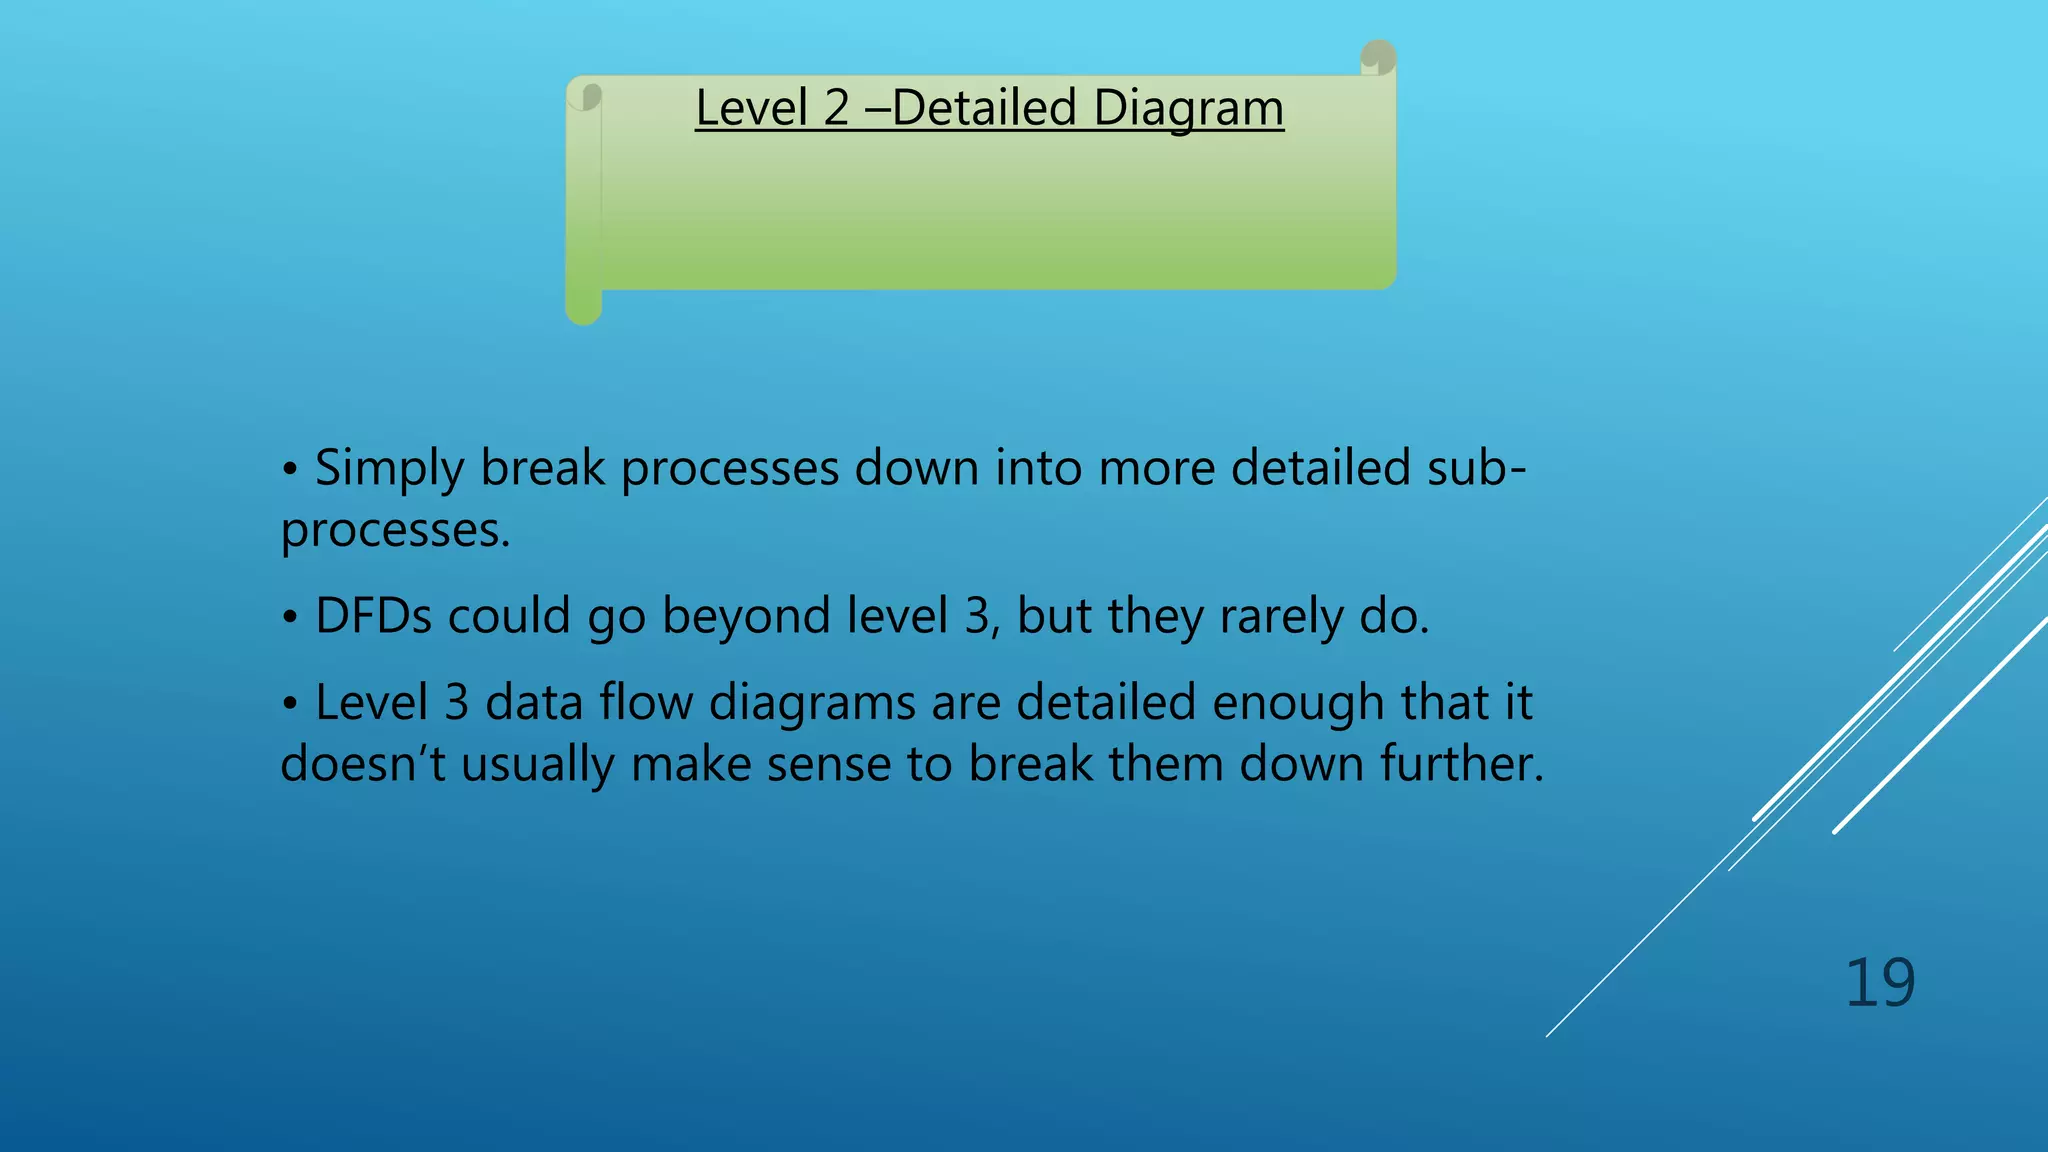
1
Contents:
2
Content Slide Number
DFD Meaning 4
History of DFD 5
Elements of DFD 6, 7
Rules of Drawing DFD 8
Guidelines of Drawing DFD 9
DFD Model 10, 11
Difference between DFD and Flow
chart
12
Types of DFD 13 - 15
DFD Levels and Layers 16 -19
Advantage 20
DEFINITION
A data flow diagram (DFD) is a graphical representation of the "flow" of data through a
computer system.
3
HISTORY:
In the 1970s, Larry Constantine, the original developer of structured design, proposed data
flow diagrams as a practical technique based on Martin and Estrin's "Data Flow Graph"
model of computation.
It became more popular in business circles, as it was applied to business analysis, than in
academic circles.
4
ELEMENTS OF DFD:
Name of the elements Structure
External Entity
Process
Data Store
Data Flow 5
• It represents the system boundary
• May represent the another system
External Entity
• work or actions
• Inputs and outputs
• Always running state
• Major functions are computations and making decisions
Processes
• Act as repository; temporary and permanent
• 2 or more systems can share the data
Data Store
Data Flow
It’s mainly shows the flow of the data
among different processes.
6
Rules of Drawing DFD:
1. Process must have one input and one output flow
2. Never level a process with an IF-Then statement
3. Never show time dependency directly on DFD
4. A process begins to performs its tasks as soon as it received the necessary input
data flows
5. A primitive process performs a single well-defined functions
6. Be sure that data stores, data flows, data processes have descriptive titles. Processes
should use imperative verbs to project action.
7. All processes receive and generate at least one data flow
8. Begin/ End data rows with the bubbles.
7
Guidelines of drawing a DFD:
Identify the key processing systems
Process bubbles should be arranged from
top left to bottom right
Name each data flow with noun
Data stores and destinations are also
named with noun
Number the each processes (1.0, 2.0)
name of the process with verb
Summarize the entire system as one bubble
and shows inputs and outputs to a system.
Don’t change the inputs and outputs
Do not try to put everything know on
the DFD
8
Functional Modeling methods:
1. Functional Flow Block Diagram
2. N2 Chart
3. IDEFO
4. Axiomatic Design
5. Operator Function Model
6. Business Process Modeling Notation
7. HIPO and IPO hierarchical input process output.
EXAMPLES:
10
A DFD for Library
11
*Flow chart shows “flow of Control” .
DFD shows “flow of Data “
*The flowchart describes boxes that
describe computations, decisions,
interactions & loops.
* It is important to keep in mind that
data flow diagrams are not flowcharts
and should not include control
elements .
12
Types Of Data Flow Diagrams
13
LOGICAL DATA FLOW DIAGRAM
• It focusses on the business & how the business operates.
• It describe the business events that take place & the data
required & produced by each event.
• It does not delve into the technical aspects of a process or
a system.
• Non-technical employees can understand these diagrams
easily.
Logical Data Flow Diagram
14
• It shows that the how system will be implemented.
• These diagrams specify the software, hardware, files & people
involved in an information flow.
• A detailed physical data flow diagram can facilitate the
development of the code needed to implement a data system.
Physical Data Flow Diagram
15
DFDs Levels & Layers
16
• It is the most basic & simplest Data Flow Diagram.
• It show a single process node and its connections to
external entities.
• This level basically represents the input & output of the
entire system.
Level 0 –Context Diagram
17
• Presents more detailed view of the system than Level 0.
• Highlight the main functions carried out by the system.
• It is basically the breakdown of level 0 into sub-processes
Level 1 –Overview Diagram
18
• Simply break processes down into more detailed sub-
processes.
• DFDs could go beyond level 3, but they rarely do.
• Level 3 data flow diagrams are detailed enough that it
doesn’t usually make sense to break them down further.
Level 2 –Detailed Diagram
19
ADVANTAGES
• Aids in describing the boundaries of the system.
• Beneficial for communicating existing system knowledge to
the users.
• Can provide a detailed representation of system
components.
• Used as the part of system documentation file.
• Easier to understand by technical and nontechnical
audiences
20
DISADVANTAGES
• Make the programmers little confusing concerning the
system.
• The biggest drawback of the DFD is that it simply takes
a long time to create, so long that the analyst may not
receive support from management to complete it.
21
22

Data Flow Diagram or DFD

  • 1.
  • 2.
    Contents: 2 Content Slide Number DFDMeaning 4 History of DFD 5 Elements of DFD 6, 7 Rules of Drawing DFD 8 Guidelines of Drawing DFD 9 DFD Model 10, 11 Difference between DFD and Flow chart 12 Types of DFD 13 - 15 DFD Levels and Layers 16 -19 Advantage 20
  • 3.
    DEFINITION A data flowdiagram (DFD) is a graphical representation of the "flow" of data through a computer system. 3
  • 4.
    HISTORY: In the 1970s,Larry Constantine, the original developer of structured design, proposed data flow diagrams as a practical technique based on Martin and Estrin's "Data Flow Graph" model of computation. It became more popular in business circles, as it was applied to business analysis, than in academic circles. 4
  • 5.
    ELEMENTS OF DFD: Nameof the elements Structure External Entity Process Data Store Data Flow 5
  • 6.
    • It representsthe system boundary • May represent the another system External Entity • work or actions • Inputs and outputs • Always running state • Major functions are computations and making decisions Processes • Act as repository; temporary and permanent • 2 or more systems can share the data Data Store Data Flow It’s mainly shows the flow of the data among different processes. 6
  • 7.
    Rules of DrawingDFD: 1. Process must have one input and one output flow 2. Never level a process with an IF-Then statement 3. Never show time dependency directly on DFD 4. A process begins to performs its tasks as soon as it received the necessary input data flows 5. A primitive process performs a single well-defined functions 6. Be sure that data stores, data flows, data processes have descriptive titles. Processes should use imperative verbs to project action. 7. All processes receive and generate at least one data flow 8. Begin/ End data rows with the bubbles. 7
  • 8.
    Guidelines of drawinga DFD: Identify the key processing systems Process bubbles should be arranged from top left to bottom right Name each data flow with noun Data stores and destinations are also named with noun Number the each processes (1.0, 2.0) name of the process with verb Summarize the entire system as one bubble and shows inputs and outputs to a system. Don’t change the inputs and outputs Do not try to put everything know on the DFD 8
  • 9.
    Functional Modeling methods: 1.Functional Flow Block Diagram 2. N2 Chart 3. IDEFO 4. Axiomatic Design 5. Operator Function Model 6. Business Process Modeling Notation 7. HIPO and IPO hierarchical input process output.
  • 10.
  • 11.
    A DFD forLibrary 11
  • 12.
    *Flow chart shows“flow of Control” . DFD shows “flow of Data “ *The flowchart describes boxes that describe computations, decisions, interactions & loops. * It is important to keep in mind that data flow diagrams are not flowcharts and should not include control elements . 12
  • 13.
    Types Of DataFlow Diagrams 13
  • 14.
    LOGICAL DATA FLOWDIAGRAM • It focusses on the business & how the business operates. • It describe the business events that take place & the data required & produced by each event. • It does not delve into the technical aspects of a process or a system. • Non-technical employees can understand these diagrams easily. Logical Data Flow Diagram 14
  • 15.
    • It showsthat the how system will be implemented. • These diagrams specify the software, hardware, files & people involved in an information flow. • A detailed physical data flow diagram can facilitate the development of the code needed to implement a data system. Physical Data Flow Diagram 15
  • 16.
    DFDs Levels &Layers 16
  • 17.
    • It isthe most basic & simplest Data Flow Diagram. • It show a single process node and its connections to external entities. • This level basically represents the input & output of the entire system. Level 0 –Context Diagram 17
  • 18.
    • Presents moredetailed view of the system than Level 0. • Highlight the main functions carried out by the system. • It is basically the breakdown of level 0 into sub-processes Level 1 –Overview Diagram 18
  • 19.
    • Simply breakprocesses down into more detailed sub- processes. • DFDs could go beyond level 3, but they rarely do. • Level 3 data flow diagrams are detailed enough that it doesn’t usually make sense to break them down further. Level 2 –Detailed Diagram 19
  • 20.
    ADVANTAGES • Aids indescribing the boundaries of the system. • Beneficial for communicating existing system knowledge to the users. • Can provide a detailed representation of system components. • Used as the part of system documentation file. • Easier to understand by technical and nontechnical audiences 20
  • 21.
    DISADVANTAGES • Make theprogrammers little confusing concerning the system. • The biggest drawback of the DFD is that it simply takes a long time to create, so long that the analyst may not receive support from management to complete it. 21
  • 22.