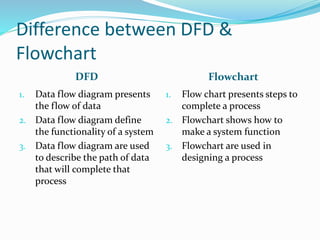
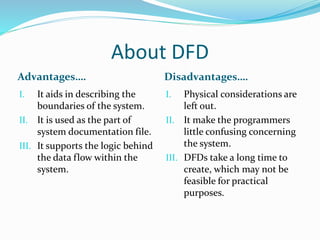
The DFD
Presented By
Akshay Modak ,Arijit Sadhukhan,
Biswarup Mondal,Yubraj mallick
Contents
 What is DFD
 History of DFD
 Difference between DFD & Flowchart
 Types of DFD
 DFD symbols
 LEVEL 0 DFD
 LEVEL 1 DFD
 LEVEL 2 DFD
 Uses of DFD
 About DFD
 Conclusion
What is DFD
 A Data Flow
Diagram (DFD) is a
graphical representation
of the "flow" of data
through an information
System.
 DFD is can also be used for
the visualization of Data
processing(Structured
program)
History
In the 1970’s, Larry Constantine, the original developer of
structured design, proposed data flow diagrams as a
practical technique based on Martin and Estrin's "Data
Flow Graph" model of computation
Difference between DFD &
Flowchart
DFD Flowchart
1. Data flow diagram presents
the flow of data
2. Data flow diagram define
the functionality of a system
3. Data flow diagram are used
to describe the path of data
that will complete that
process
1. Flow chart presents steps to
complete a process
2. Flowchart shows how to
make a system function
3. Flowchart are used in
designing a process
Types of DFD
Data flow diagrams(DFD)are categorized as
either logical or physical.
1).LOGICAL DFD:- A logical DFD focuses on the
business and how the business operates. It
describes the business events that take place and
the data required and produced by each event.
2).PHYSICAL DFD:- A physical DFD shows how the
system will be implemented.
Difference Between Physical and
Logical DFD
Physical DFD Logical DFD
I. It is describe h0w the
process will be
implemented.
II. It represent Program
modules and manual
procedures.
III. The data stores in physical
file database and manual
files.
I. It represent how the
business operator.
II. It represent the business
activities.
III. The data store represent the
collection of data regardless
the data store.
DFD symbols
The Process..
The process is the
manipulation or work that
transforms data, performing
computations, making decisions
(logic flow),or directing data
flows based on business rules,
In other words, a process
receives input and Generates.
The Data flow..
Data flow is the movement of data
between the external entity, the
process, and the data store. Data flow
portrays the interface between the
components of the DFD.
The Data store..
A data store is where a process
stores data between processes for
later retrieval by that same
process or another one.
The External Entity..
An entity is the source or
destination of data. The source
in a DFD represents these
entities that are outside the
context of the system.
LEVEL 0 DFD
Rules of Level 0 DFD:-
Definition:-
 Data stores NOT shown.They are within the system.
 one process represent the entire system.
 Data arrows show input and output.
A context diagram is a top level (also known as "Level 0") data flow
diagram. It only contains one process node ("Process 0") that
generalizes the function of the entire system in relationship to external
entities. DFD Layers.
LEVEL 1 DFD
Definition :-
Rules of Level 1 DFD:-
The Level 1 DFD shows how the system is divided into sub-systems
(processes), each of which deals with one or more of the data
flows to or from an external agent, and which together provide all
of the functionality of the system as a whole.
 Level 1 DFD must balance with the context diagram it
describes.
 Input going into a process are different from outputs leaving
the process.
 Data stores are first shown at this level.
LEVEL 2 DFD
Definition:-
Rules of level 2 DFD:-
A level 2 data flow diagram (DFD) offers a more detailed look at the
processes that make up an information system than a level 1 DFD does. It
can be used to plan or record the specific makeup of a system. ... You can
then input the particulars of your own system.
 Level 2 DFD must balance with the Level 0 it describes.
 input going into a process are different from output leaving
the process.
 Continue to show data stores.
Use of DFD
About DFD
Advantages…. Disadvantages….
I. It aids in describing the
boundaries of the system.
II. It is used as the part of
system documentation file.
III. It supports the logic behind
the data flow within the
system.
I. Physical considerations are
left out.
II. It make the programmers
little confusing concerning
the system.
III. DFDs take a long time to
create, which may not be
feasible for practical
purposes.
Conclusion
Data flow analysis has proved itself to be an essential technique in
the grand scheme of developing custom software solutions. It
greatly improves conceptual clarity, for both the developer and
the client. It helps show the true scope of the project, which is
almost always bigger than originally anticipated.
www.google.co.in
www.wikipedia.org
www.lucidchart.com/pages/data-flow-diagram
The DFD

The DFD

  • 1.
    The DFD Presented By AkshayModak ,Arijit Sadhukhan, Biswarup Mondal,Yubraj mallick
  • 2.
    Contents  What isDFD  History of DFD  Difference between DFD & Flowchart  Types of DFD  DFD symbols  LEVEL 0 DFD  LEVEL 1 DFD  LEVEL 2 DFD  Uses of DFD  About DFD  Conclusion
  • 3.
    What is DFD A Data Flow Diagram (DFD) is a graphical representation of the "flow" of data through an information System.  DFD is can also be used for the visualization of Data processing(Structured program)
  • 4.
    History In the 1970’s,Larry Constantine, the original developer of structured design, proposed data flow diagrams as a practical technique based on Martin and Estrin's "Data Flow Graph" model of computation
  • 5.
    Difference between DFD& Flowchart DFD Flowchart 1. Data flow diagram presents the flow of data 2. Data flow diagram define the functionality of a system 3. Data flow diagram are used to describe the path of data that will complete that process 1. Flow chart presents steps to complete a process 2. Flowchart shows how to make a system function 3. Flowchart are used in designing a process
  • 6.
    Types of DFD Dataflow diagrams(DFD)are categorized as either logical or physical. 1).LOGICAL DFD:- A logical DFD focuses on the business and how the business operates. It describes the business events that take place and the data required and produced by each event. 2).PHYSICAL DFD:- A physical DFD shows how the system will be implemented.
  • 7.
    Difference Between Physicaland Logical DFD Physical DFD Logical DFD I. It is describe h0w the process will be implemented. II. It represent Program modules and manual procedures. III. The data stores in physical file database and manual files. I. It represent how the business operator. II. It represent the business activities. III. The data store represent the collection of data regardless the data store.
  • 8.
  • 9.
    The Process.. The processis the manipulation or work that transforms data, performing computations, making decisions (logic flow),or directing data flows based on business rules, In other words, a process receives input and Generates.
  • 10.
    The Data flow.. Dataflow is the movement of data between the external entity, the process, and the data store. Data flow portrays the interface between the components of the DFD.
  • 11.
    The Data store.. Adata store is where a process stores data between processes for later retrieval by that same process or another one.
  • 12.
    The External Entity.. Anentity is the source or destination of data. The source in a DFD represents these entities that are outside the context of the system.
  • 13.
    LEVEL 0 DFD Rulesof Level 0 DFD:- Definition:-  Data stores NOT shown.They are within the system.  one process represent the entire system.  Data arrows show input and output. A context diagram is a top level (also known as "Level 0") data flow diagram. It only contains one process node ("Process 0") that generalizes the function of the entire system in relationship to external entities. DFD Layers.
  • 14.
    LEVEL 1 DFD Definition:- Rules of Level 1 DFD:- The Level 1 DFD shows how the system is divided into sub-systems (processes), each of which deals with one or more of the data flows to or from an external agent, and which together provide all of the functionality of the system as a whole.  Level 1 DFD must balance with the context diagram it describes.  Input going into a process are different from outputs leaving the process.  Data stores are first shown at this level.
  • 15.
    LEVEL 2 DFD Definition:- Rulesof level 2 DFD:- A level 2 data flow diagram (DFD) offers a more detailed look at the processes that make up an information system than a level 1 DFD does. It can be used to plan or record the specific makeup of a system. ... You can then input the particulars of your own system.  Level 2 DFD must balance with the Level 0 it describes.  input going into a process are different from output leaving the process.  Continue to show data stores.
  • 17.
  • 18.
    About DFD Advantages…. Disadvantages…. I.It aids in describing the boundaries of the system. II. It is used as the part of system documentation file. III. It supports the logic behind the data flow within the system. I. Physical considerations are left out. II. It make the programmers little confusing concerning the system. III. DFDs take a long time to create, which may not be feasible for practical purposes.
  • 19.
    Conclusion Data flow analysishas proved itself to be an essential technique in the grand scheme of developing custom software solutions. It greatly improves conceptual clarity, for both the developer and the client. It helps show the true scope of the project, which is almost always bigger than originally anticipated.
  • 20.