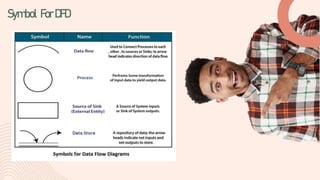
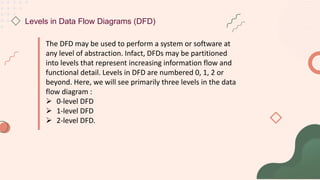
Data Flow Diagrams (DFDs) are graphical tools used in software engineering to visualize how data moves through a system. A DFD shows the flow of data between external entities and processes, as well as data storage components. It uses standard symbols like rectangles, circles, and arrows. DFDs are hierarchical, with multiple levels showing increasing detail. A 0-level DFD provides an overview of the entire system as a single bubble, while 1-level and 2-level DFDs decompose this into subprocesses and further detail. Key aspects like inputs, outputs, processes, and data storage are represented. DFDs do not show control flow or logic.