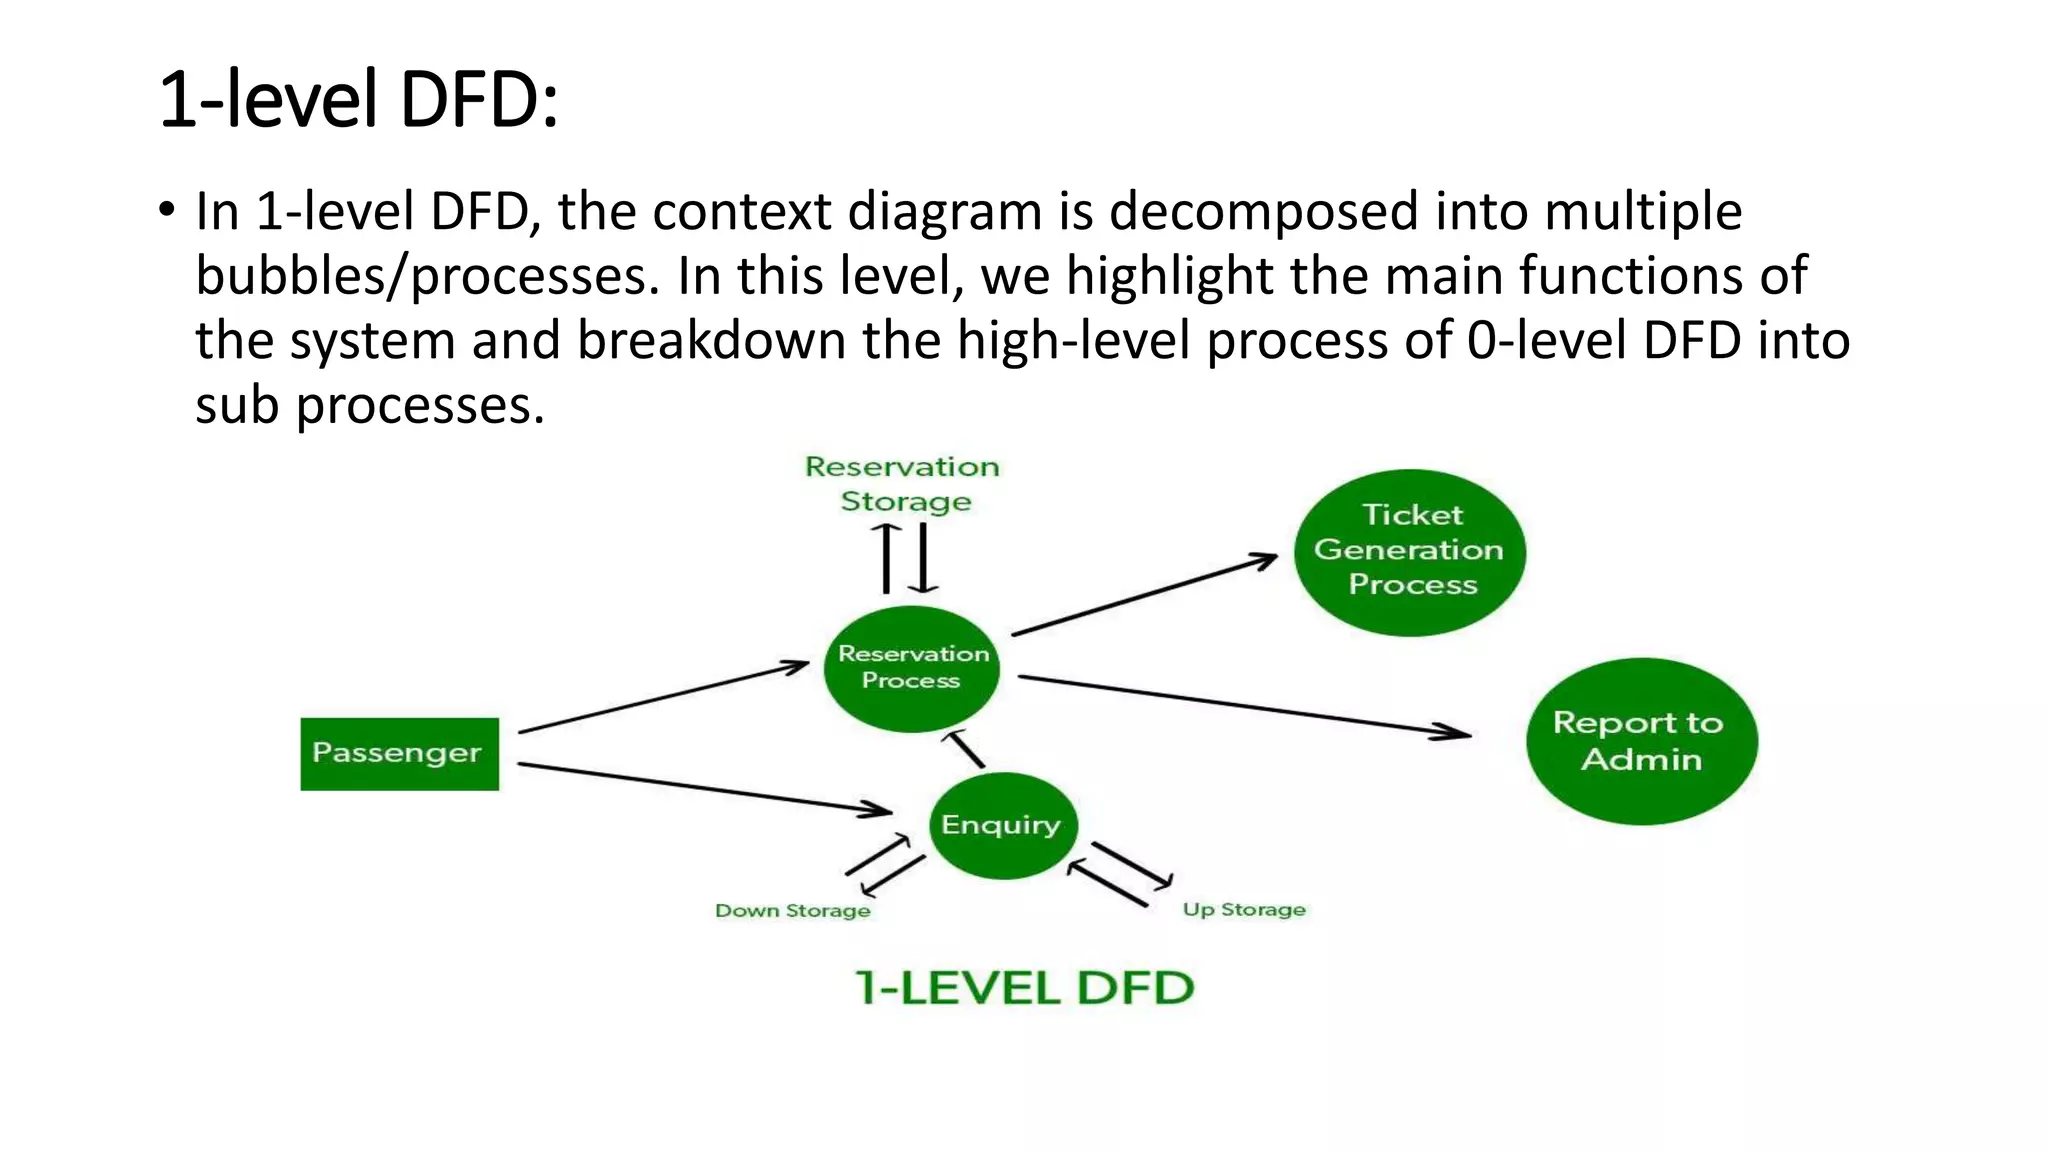
2. Data Flow Diagram
• A Data Flow Diagram (DFD) is a traditional visual representation of the
information flows within a system. A neat and clear DFD can depict
the right amount of the system requirement graphically. It can be
manual, automated, or a combination of both.
• It shows how data enters and leaves the system, what changes the
information, and where data is stored.
• The objective of a DFD is to show the scope and boundaries of a
system as a whole. It may be used as a communication tool between
a system analyst and any person who plays a part in the order that
acts as a starting point for redesigning a system. The DFD is also called
as a data flow graph or bubble chart.
3. The following observations about DFDs are essential:
• All names should be unique. This makes it easier to refer to elements
in the DFD.
• Remember that DFD is not a flow chart. Arrows is a flow chart that
represents the order of events; arrows in DFD represents flowing
data. A DFD does not involve any order of events.
• Suppress logical decisions. If we ever have the urge to draw a
diamond-shaped box in a DFD, suppress that urge! A diamond-shaped
box is used in flow charts to represents decision points with multiple
exists paths of which the only one is taken. This implies an ordering of
events, which makes no sense in a DFD.
• Do not become bogged down with details. Defer error conditions and
error handling until the end of the analysis.
5. Symbols Represenation
• Circle: A circle (bubble) shows a process that transforms data inputs
into data outputs.
• Data Flow: A curved line shows the flow of data into or out of a
process or data store.
• Data Store: A set of parallel lines shows a place for the collection of
data items. A data store indicates that the data is stored which can be
used at a later stage or by the other processes in a different order.
The data store can have an element or group of elements.
• Source or Sink: Source or Sink is an external entity and acts as a
source of system inputs or sink of system outputs.
6. Levels in Data Flow Diagrams (DFD)
• The DFD may be used to perform a system or software at any level of
abstraction. In fact, DFDs may be partitioned into levels that
represent increasing information flow and functional detail. Levels in
DFD are numbered 0, 1, 2 or beyond. Here, we will see primarily three
levels in the data flow diagram, which are: 0-level DFD, 1-level DFD,
and 2-level DFD.
• 0-level DFD:
It is also known as a context diagram. It’s designed to be an
abstraction view, showing the system as a single process with its
relationship to external entities. It represents the entire system as a
single bubble with input and output data indicated by
incoming/outgoing arrows.
7.
8. 1-level DFD:
• In 1-level DFD, the context diagram is decomposed into multiple
bubbles/processes. In this level, we highlight the main functions of
the system and breakdown the high-level process of 0-level DFD into
sub processes.
9. 2-level DFD:
• 2-level DFD goes one step deeper into parts of 1-level DFD. It can be
used to plan or record the specific/necessary detail about the
system’s functioning.